12. Interface & Application Programming

This week we are using a sensor board (from week 10) along side Processing to generate a visual representation of the output data.
Application Programming: Sensor + Processing
Hello.Light Board (Phototransistor)
![]()
I had a lot of issues with the other boards so decided to use the board I know for sure is working correctly without any complications. In addition this board contains a sensor I am most interested in. As an architect, I will most probably use this sensor or similar sensor for various experiments.
Example Sketch
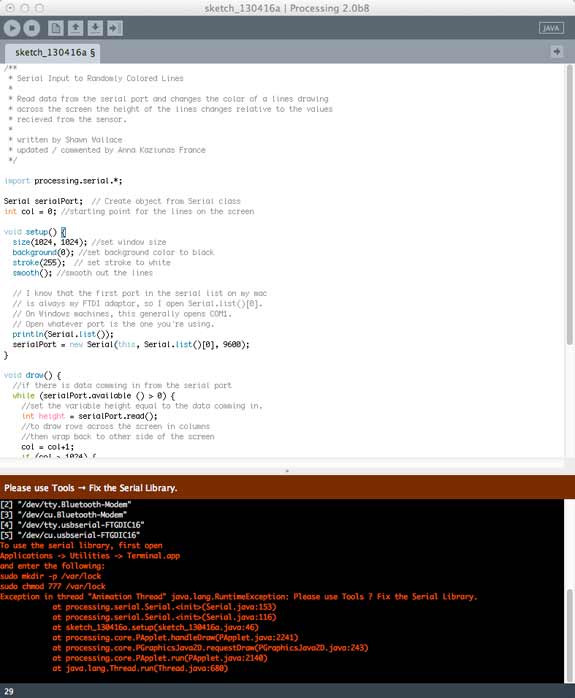
I ran the example code from Anna's Processing tutorial page, however I was not able to get it to successfully run at first. To fix this error go to Tools -> 'Fix the Serial Library'. This should automatically fix the problem and open the drawing.
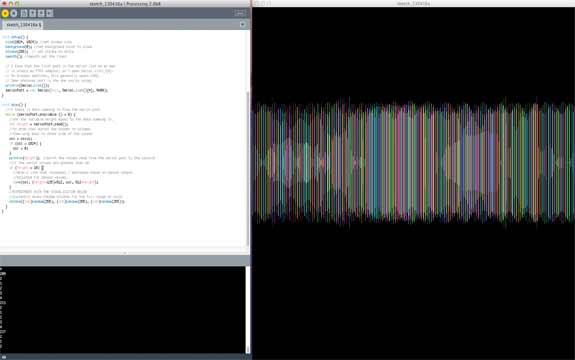
The working code, drawing a line every unit of measurement, showing the light intensity.
Before writing my own sketch I tested another example sketch to try to see how they are set up.
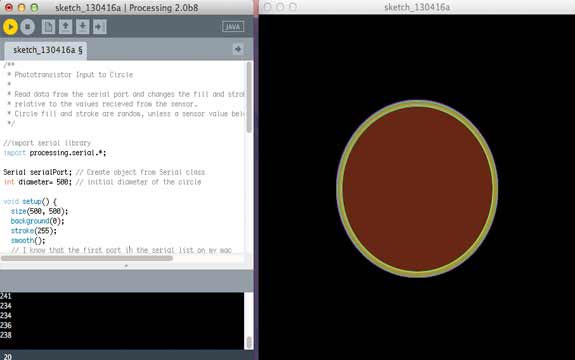
Customizing The Sketch
The next step is to create my own sketch (still in combination with the Phototransistor Board). The process will be a set of tests for me to understand how the code works and what possibilities there are.
/**
* Phototransistor Input
*
* Read data from the serial port and changes the fill and stroke color of a circle
* relative to the values recieved from the sensor.
* Circle fill and stroke are random, unless a sensor value below 200 is recived.
*///import serial library
Serial serialPort; // Create object from Serial class
import processing.serial.*;
int length= 500; // initial diameter of the circlevoid setup() {
void draw() {
size(700, 700);
background(0);
stroke(255);
smooth();
// I know that the first port in the serial list on my mac
// is always my FTDI adaptor, so I open Serial.list()[0].
// On Windows machines, this generally opens COM1.
// Open whatever port is the one you're using.
println(Serial.list());
serialPort = new Serial(this, Serial.list()[4], 9600);
}
//filter out the 1,2,3,4 framing code numbers
while (serialPort.available () > 4) {
int lightIn = serialPort.read();
//if the sensor value is greater than 200
//(you may need to tweak this number to get the code to respond to your board)
if (lightIn > 200) {
//print in the sensor values to the console
println(lightIn);
//set the variable diameter to the sensor value
length = lightIn;
//use the sensor value to draw an ellipse
rect((int)random(700), (int)random(700), (int)random(200), (int)random(200));
//redraw the screen
redraw();
}
}
//EXPERIMENT WITH THE VISUALIZATION BELOW
//if the sensor values are less that 200, the elipse with random stroke and fill colors
stroke((int)random(255), (int)random(255), (int)random(255));
fill((int)random(255), (int)random(255), (int)random(255));
}
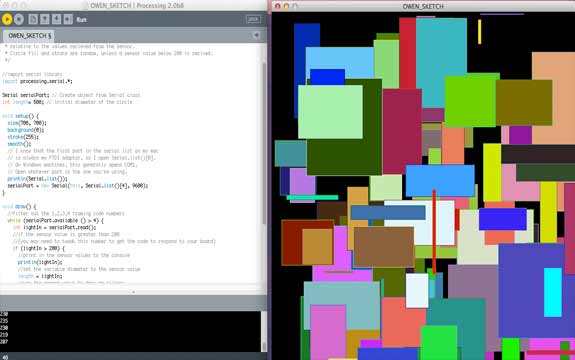
My first test was to make a completely random drawing using components from the examples. I used the stroke and fill color from the first example along with a newly added shape (a random rectangle with variable sizes). This is of course fun for a beginner like myself, but clearly it has no real use in terms of data visualization.
Final Customized Sketch
/**
* Serial Input to Randomly Colored Lines
*
* Read data from the serial port and changes the color of a lines drawing
* across the screen the height of the lines changes relative to the values
* recieved from the sensor.
*
* written by Shawn Wallace
* updated / commented by Anna Kaziunas France
*/import processing.serial.*;
Serial serialPort; // Create object from Serial class
int col = 0; //starting point for the lines on the screenvoid setup() {
// I know that the first port in the serial list on my mac
size(1024, 1024); //set window size
background(0); //set background color to black
stroke(255); // set stroke to white
smooth(); //smooth out the lines
// is always my FTDI adaptor, so I open Serial.list()[0].
// On Windows machines, this generally opens COM1.
// Open whatever port is the one you're using.
println(Serial.list());
serialPort = new Serial(this, Serial.list()[4], 9600);
}void draw() {
//filter out the 1,2,3,4 framing code numbers
while (serialPort.available () > 4) {
//set the variable height equal to the data comming in.
int height = serialPort.read();
//to draw rows across the screen in columns
//then wrap back to other side of the screen
col = col+1;
if (col > 1024) {
col = 0;
}
println(height); //print the values read from the serial port to the console
//if the serial values are greater than 10
if (height > 10) {
//draw a line that increases / decreases based on sensor output.
//adjusted for sensor values.
rect(col, (height-125)+512, 10, 512-height);
}
//EXPERIMENT WITH THE VISUALIZATION BELOW
//currently draws random strokes for the full range of color
stroke(0);
}
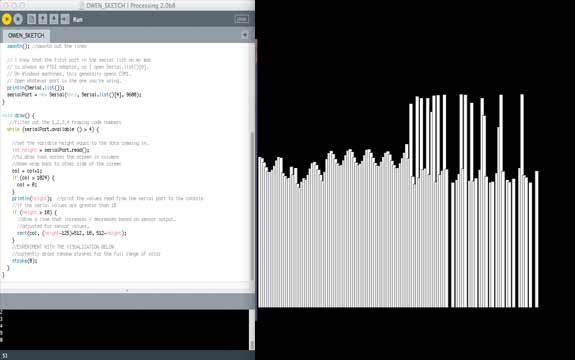
}
For the next step I tried to simulate a bar graph. Simple but an effective way to communicate values. I wanted to have a background image as a visual reference of the values. In further weeks I will work on perfecting the code to get the exact desired results. There clearly is still a lot to learn and I believe this could be a powerful tool for data visualization in connection with sensors.

