Week 11:
Input Devices
This week, finally, I will be able to start developing parts of my final project. I hope I can get a concrete image of what electronics I will need to read the colors of the environment for my lamp.
The sensations that this week gives me are great. I feel super motivated to start working on the project, which although it has already been done previously, I think I will enjoy it a lot. Electronics is not my strong suit, but I think that with the help of my instructors I will be able to do what I want. Later in the Individual Assignment chapter I will explain something better that I want to do.
Before we really start working, let's make it clear what are the objectives to be met during this week.
The assignments for this week are:
Group assignment:
• Probe an input device's analog levels and digital signals.
Individual assignment:
• Measure something: add a sensor to a microcontroller board that you have designed and read it.
Group assignments
For this week's group assignment I would like to highlight the work of my partner Carla. He has done a brutal job of theoretical and practical analysis of digital and analog sensors. It has also helped me a lot to understand the sensor that I would like to design.
I have to admit that the work that he has done and that he has put online again (you will see that on his website he explains that this work was done 3 years ago but that he stopped being online), has made me understand the difference between analog signal and signal digital.
The first part of theoretical explanations are wonderful, the diagrams are good, clean and also the explanations have made me super easy to understand. I think that for someone who has never approached sensors (me) it is a great way to understand how it works.
In addition to the grpup assignment with which he has helped me so much, I recommend that you look at the project of his flex sensors, it is a super cool concept!
Input + Oscilloscope
To have a clearer vision of how the inputs work, I asked my partner Adrien for advice. For his final project, he wants to have a large number of sensors so he had no problem giving me a little masterclass on how to understand the input readings and visualize it on an oscilloscope.
To have a clearer vision of how the inputs work, I asked my partner Adrien for advice. For his final project, he wants to have a large number of sensors so he had no problem giving me a little masterclass on how to understand the input readings and visualize it on an oscilloscope.
Although the readings we got on the oscilloscope weren't too sharp, also using the LED as an indicator was interesting. In general, this experience was a kind of flashforward to when we come to communicate the inputs with the outputs.
Individual Assignment
Once the group assignment is over, we enter this week's Individual Assignment. As I have already mentioned before, it is the first week that my efforts will focus on developing parts of my final project.Check the link to have a more indepth idea of what my final project is about.
Idea
As with my final project I want to be able to control the color of some rgb LEDs, I think there is no better assignment than this to understand how to obtain color data.
I want to understand how to make a color sensor or photoresistor work so that they read the colors that I want. The difficult thing in this case I think will be to design the electronics correctly: both at the hardware and software level.
Reviewing the internet I have seen several projects that are similar to what I want to do and I would like to give the credit their authors deserve. In the following table you will find my references and products that focus their efforts on getting color readings:
References
| Author | Link |
|---|---|
| Jiri | DIY color reading |
| Marc-AndreH | High-performance Color Detector for Under 1$ |
| Lamiaa Nail | Week 11: Intput Device: Phototransistor |
| Nada Abdelfattah | Sorting M&M by color |
| Buddhishan Manamperi | How to get the RGB value of a color using phototransistor or photodiode? |
Theoretical Foundations
To begin, I want to understand the operation and theoretical concepts on which light control is based. You have to take into account several concepts of optical physics that I think are interesting to develop the project, under control.
The first concept we must understand is "Why do we see colored things and why those colors?". To understand this concept better, let's look at the following graphic
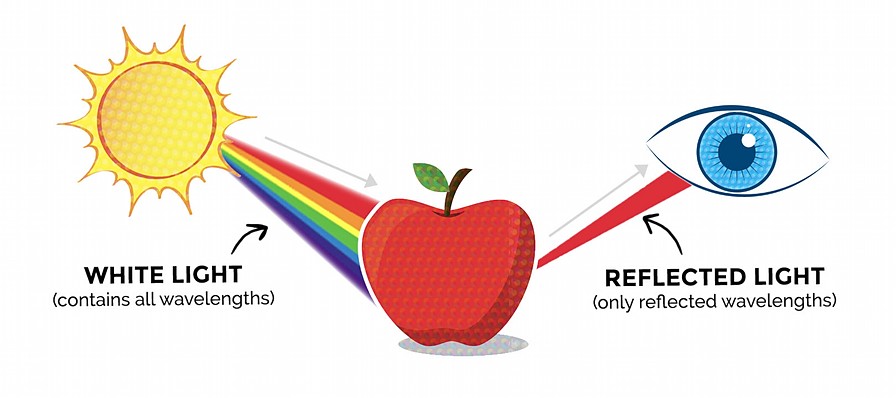
Light is, in a simplified way, a wave, so the color change is produced by the wavelength at which the wave vibrates. Objects absorb all colors, except the color that we see that is reflected towards our eyes. All the waves added generate the white color (only in additive color) so that when we bounce off the object we lose part of the light spectrum and we only see the reflected that enters our eyes.
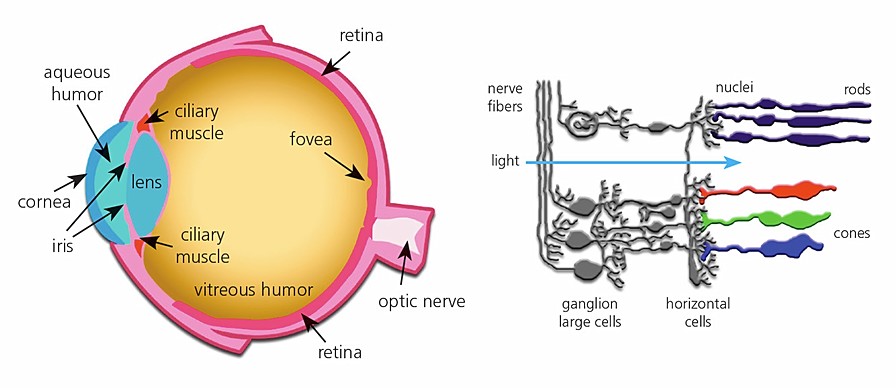
Another concept to understand is how our eye (which is still a sensor but biological) transforms the length of one it receives into information. Inside the eye we have cells called Cone Cells, which are capable of understanding the colors that objects reflect.
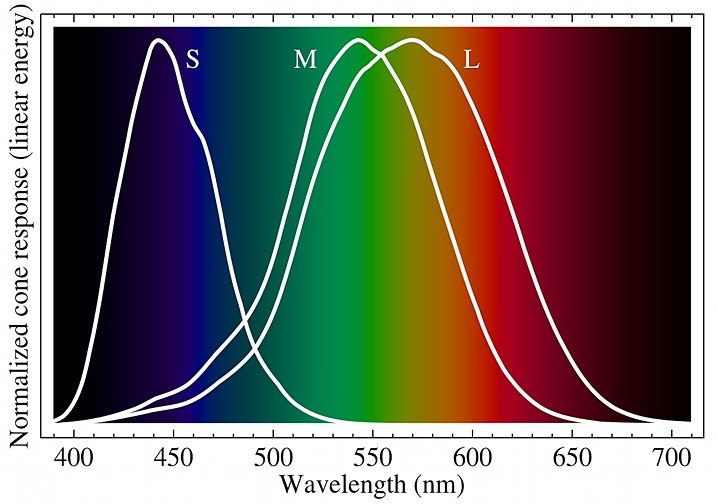
The sensitivity of our eyes to light is relevant for the project, since we have to be able to read colors within the spectrum of light that our eye can understand. Because of the advancement of electronics, we are currently able to read spectra of light outside of our capabilities. The visible spectrum of light that our eye can see is the following.
For a better conclusion of this point, we draw the following conclusions after understanding the two previous graphs and the next one.

Conclusions
- White light contains all wavelengths within the visible spectrum.
- The matter that receives the light, absorbs all the lights except the one we see, which is reflected towards our eyes.
- The spectrum of light visible to humans is 380 to 750 nm, and under perfect conditions it is 310 to 1050 nm. We start to look at purple and reach up to red.
- The optimal points of view are, for each color within RGB: R (570nm), G (540nm) and B (440nm).
- The sensor that we use for the project must have an optimal behavior between 400-600nm to be able to appreciate it in the best way with the eyes.
Datasheets: what do I use?
To start working on this week's project, the first job consists of seeing the specifications that we can obtain with the color sensors that we have in the Lab. Reviewing the inventory, we have the following options:
| Sensor | Datasheet |
|---|---|
| OP580DA | https://media.digikey.com/pdf/Data%20Sheets/TT%20Electronics%20PDFs/OP580DA.pdf |
| PT15-21B/TR8 | http://www1.futureelectronics.com/doc/Everlight/DPT-0000481.pdf |
| PT15-21C/TR8 | https://datasheet.octopart.com/PT15-21C/TR8-Everlight-datasheet-12525336.pdf |
| VEML6040A3OGCT | https://www.vishay.com/docs/84276/veml6040.pdf |
In order not to complicate the choice of the sensor to use, we will focus our efforts on finding the one that works best within the visible spectrum. To do this, below we have a small graphic summary of all of them.
Analogical Sensors: OP580DA / PT15-21B/TR8 / PT15-21C/TR8
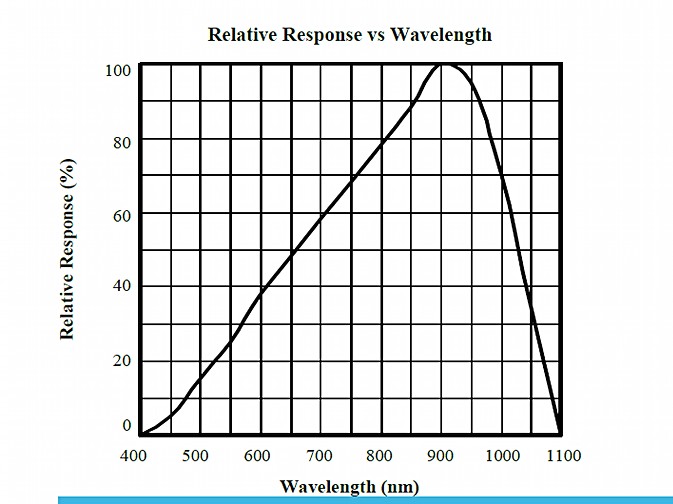
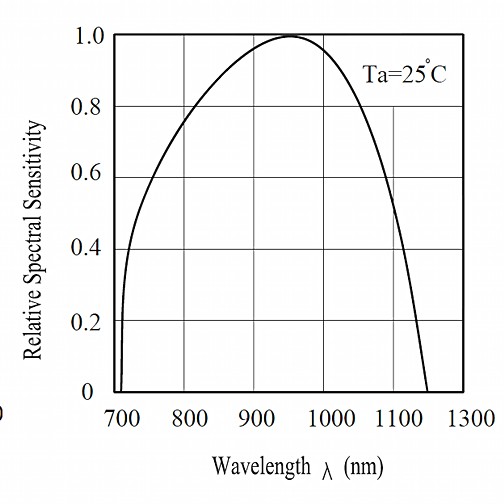
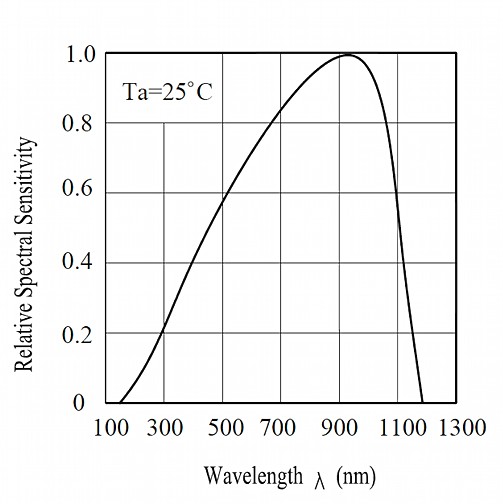
As we can see, within analogs the spectrum of light changes a lot between them. Remember that we must find the most sensitive between approximately 400-600nm.The decision is clearly between the first and third sensor. The PT15-21B-TR8, does not make sense since it begins its sensitivity after 700 nm, therefore discarded.
Taking as a reference the central data of the RGB spectrum (500 nm) we can see that the third sensor has a relative sensitivity of 55% at that point. In contrast to the first, it only results in a 15% sensitivity. Finally of the analogical ones we will focus on the PT15-21C-TR8.
Digital Sensor: VEML6040A3OGCT
This sensor is not so easy to compare with others because its digital readings do not follow the same pattern as previous analog sensors.
By only having one type of digital sensor in the Lab, the decision is clear: we will choose the VEML6040A3OGCT . Anyway, I think doing a couple of iterations to compare analog and digital behavior can be more than interesting. Not only for this week but also for the development of the final project.
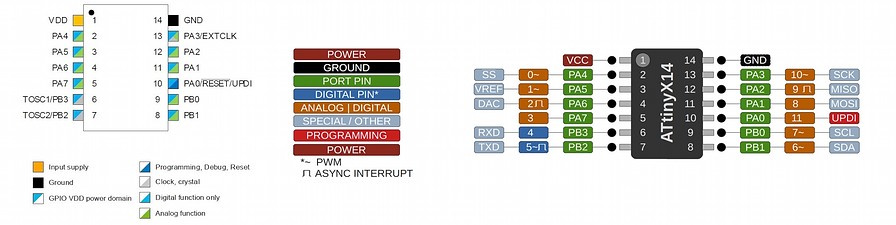
ATTiny1614: pinout and characteristics
Other information needed to design the PCB that I will be using this week is the pinout of the ATTiny1614. We have to know the characteristics that each pin offers us to understand how we should design the electrical scheme.
I will use the ATTiny1614 (in theory, if nothing goes wrong) because commenting with my instructors, they told me that it has a priori enough power to manage the content of this week. Also reviewing some projects of the references, I have seen that the microcontrollers they use are less powerful than this one. Another important reason is that I already programmed with him during previous weeks and I feel quite comfortable already.
In addition to knowing the pinout of the microcontroller, it is important to also know the maximum stress values to which the device can be subjected. We have to take into account that we will need some LEDs, the phototransistor and other components. Reading the ATtiny1614 datasheet, towards the end of the document we find the following table:
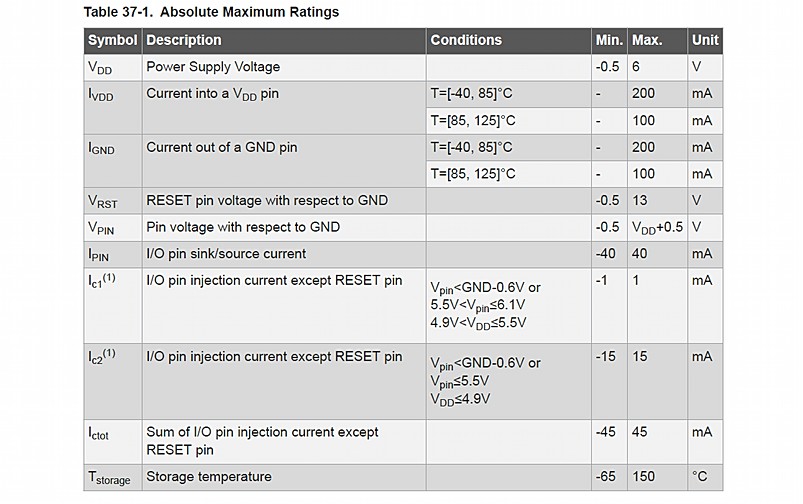
We must keep in mind the maximum values to decide the number of pins that will be necessary to obtain the information from the peripherals attached to the microcontroller.
RGB LEDs
With the LEDs that we need to illuminate the surface, things get complicated. Basically we have to understand these LEDs as a 3-1. They are one red, one blue and one green in the same contender. Playing with the light intensity of each one of them we can get the entire spectrum of visible light based on mixtures. That concept seems simple a priori, but believe me, it is turning out to be much more complex than expected.
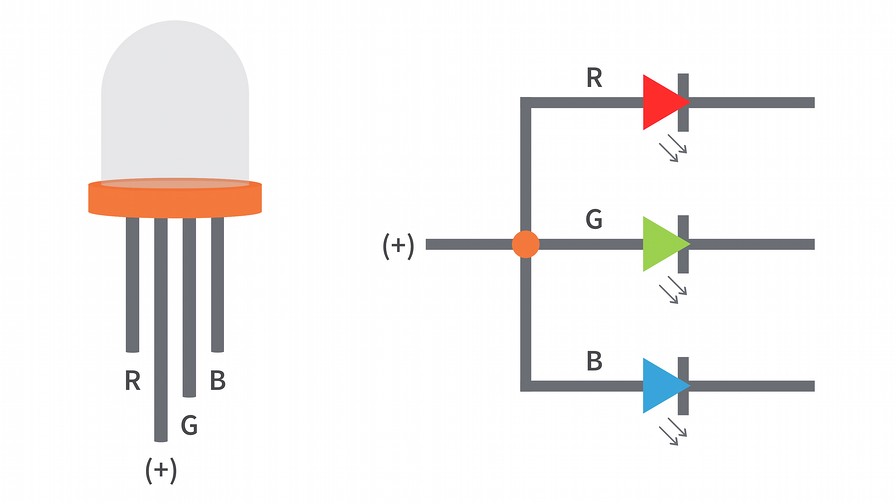
Just because they are a 3-in-1 does not eliminate the need to protect each LED with a different resistor value. Therefore, I will have to design a PCB with 3 resistors for each RGB LED. The idea of these LEDs is to project light onto the surface to be read so that it reflects the white light from the LEDs back to the color sensor.
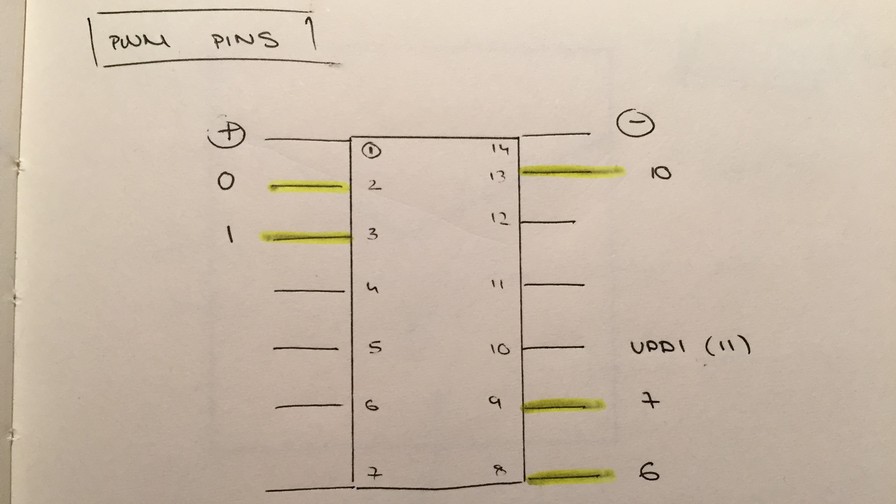
By combining the data from the ATtiny1614 datasheet and the current of the LEDs, the connection will have to be in color pairs for each pin. Thus giving a value of 20 + 20mA smaller than 50mA which is the maximum current that the microcontroller pin can withstand
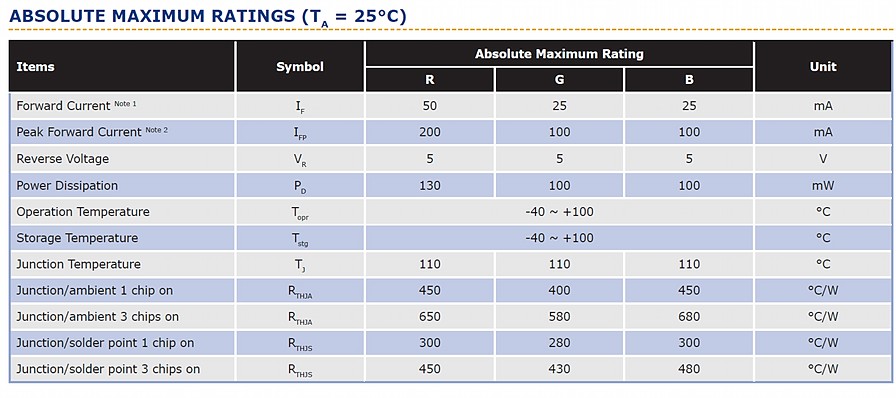
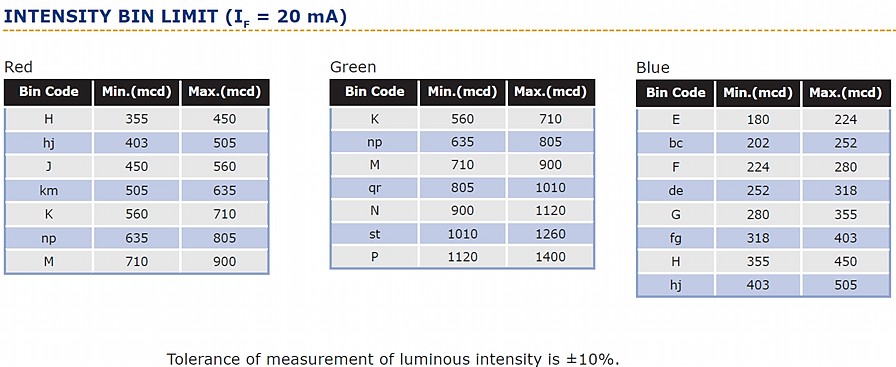
Apart from that, I have to take into account the intensity of light that each RGB phase generates at the intensity of 20mA. To do this, and back to the LED datasheet, we see that green is very intense, red is moderate and blue is very low. That opens the door to treating each color phase with PWM (Pulse-Width Modulation). That way we can get the whitest light possible and the sensor read as closely as possible to reality. Anyway, we'll take care of that when we get to the software.
Color Sensor: Basic Functioning
Once we have the RGB LEDs throwing white light on the colored surfaces, we need to receive the reflected light and analyze its RGB content through a set of photodiodes. Each of them is responsible for perceiving a color, just as happens in our eye with cone cells. Once the color and its mixture have been received, in digitals this information is converted into a digital signal. Check the following schema:
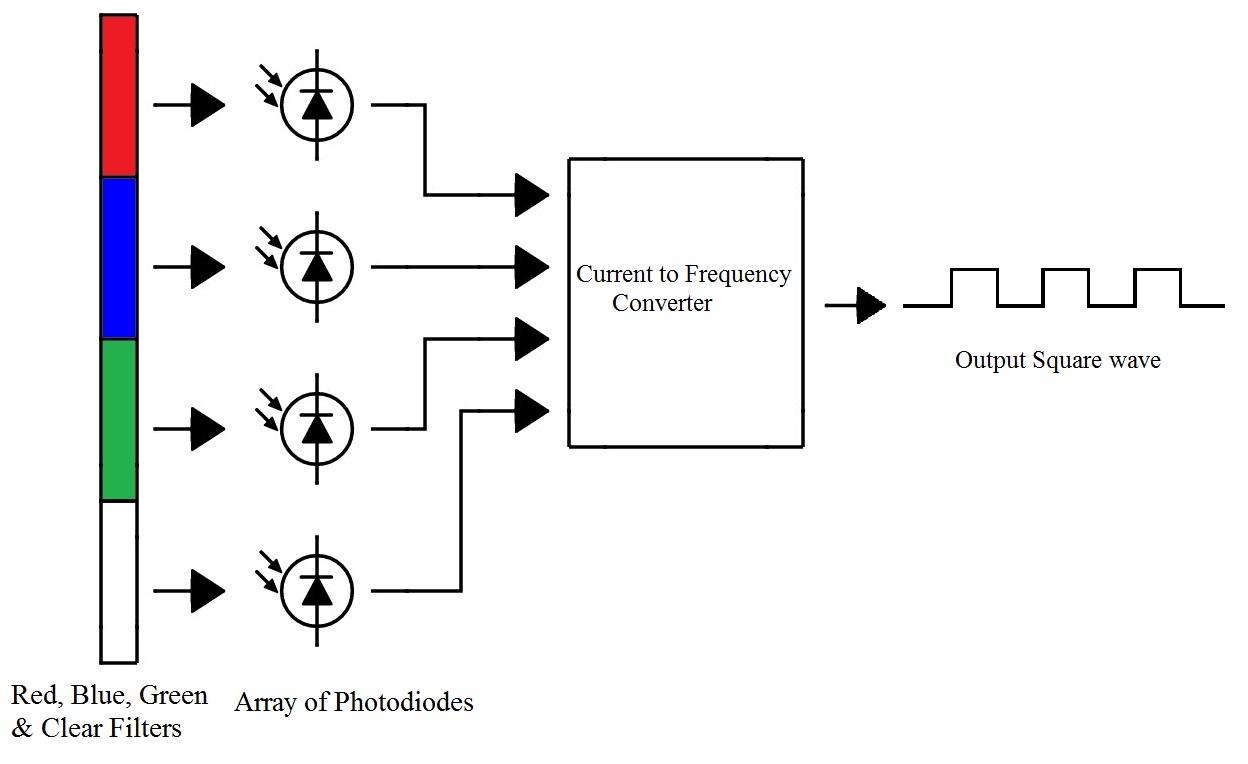
This part should not be a problem, as it is the color sensor itself that detects and generates the signal. The problem will be to understand and read that information through the computer. Later the logical step would be to transmit that data to an Output.
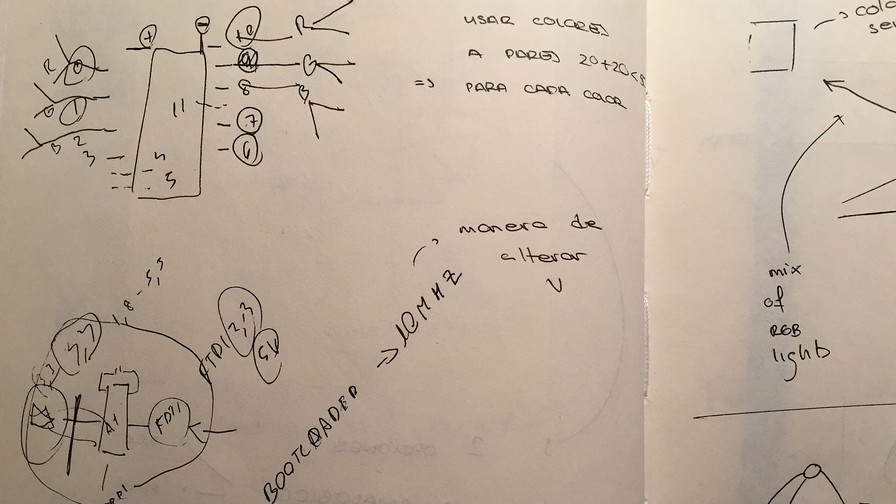
Design by Hand
At this point, when the investigation seems to be over (surely not but, it seems at least ... :)), it is time to design the PCB system that I will need to develop everything I have learned. In the same way as during electronic design week, I prefer to start by hand before entering the Kicad workflow.
Resistor Values: LED Resistor Calculator
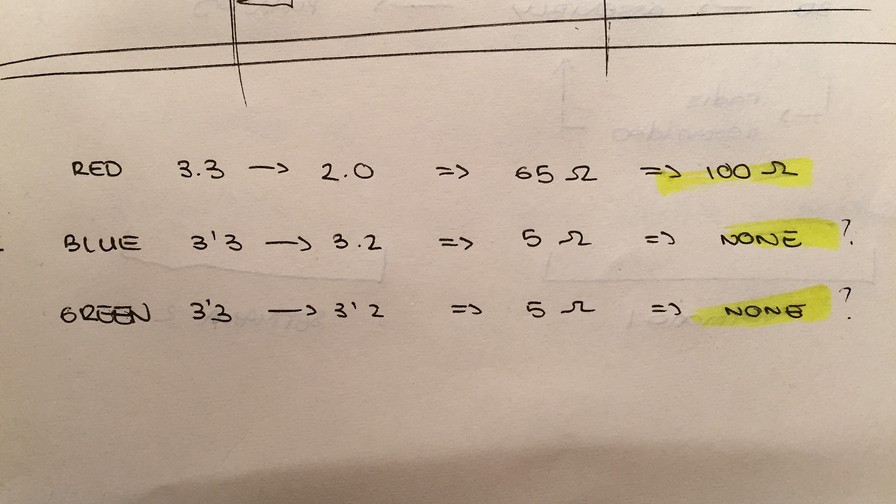
An important part is knowing the values of the resistors to protect the phases of the RGB LED. Each color has its values and depending on the connection scheme these values may vary. To facilitate the calculations I use the LED datasheet and a simple online calculator. Finally the values are:
| Color | Vin | Vout | R value | R real |
|---|---|---|---|---|
| RED | 3.3V | 2.0V | 65Ω | 100Ω |
| GREEN | 3.3V | 3.2V | 5Ω | none |
| BLUE | 3.3V | 3.2V | 5Ω | none |
Having such low values, I doubted a lot about which resistors to place as protectors of those LEDs (actually they only protect the blue and green phases of the RGB LEDs). Discussing with my instructors we consider that the best option was not to place any resistance. The voltage drop is only 0.1V so the possibility of burning the component is very low.
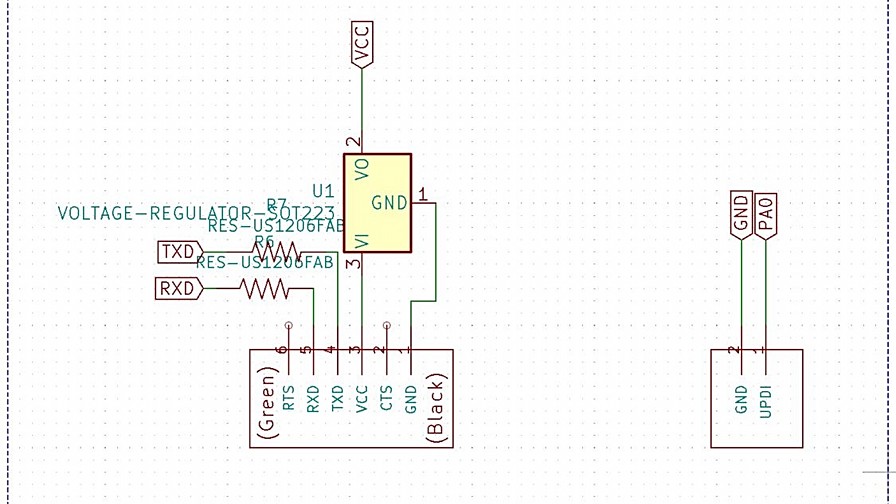
Kicad Design
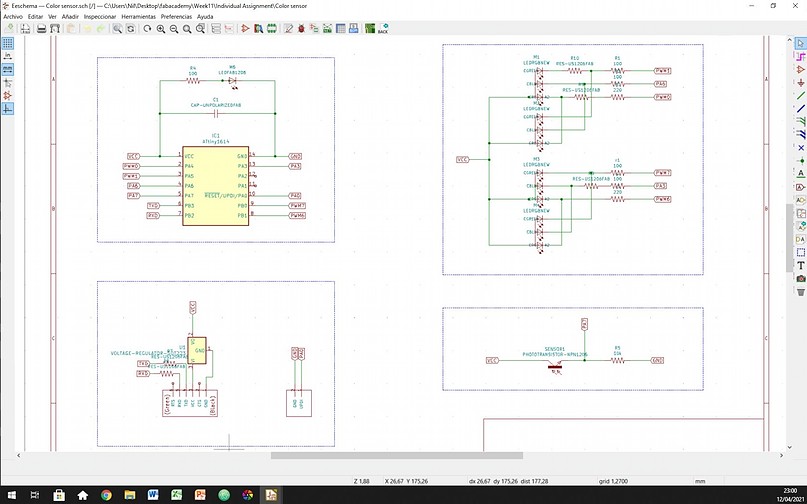
Working with Kicad is not the goal this week, but they do make up an important part of PCB manufacturing. For this reason, and without spending too much time on documentation. Here are some images of the process I followed to design the electronics that surround the color sensor.
Making the schematics did not turn out to be too complex, because the connections were simple and the previous work of researching and reading datasheets helped a lot to facilitate the process.As you can see in the image below, I find that the result is good and that the connections are correct. As you will see there are many resistors of unknown value. During the wiring of the PCB there was a point of desperation where I could not close the circuit because of so many parallels in the RGB LEDs.

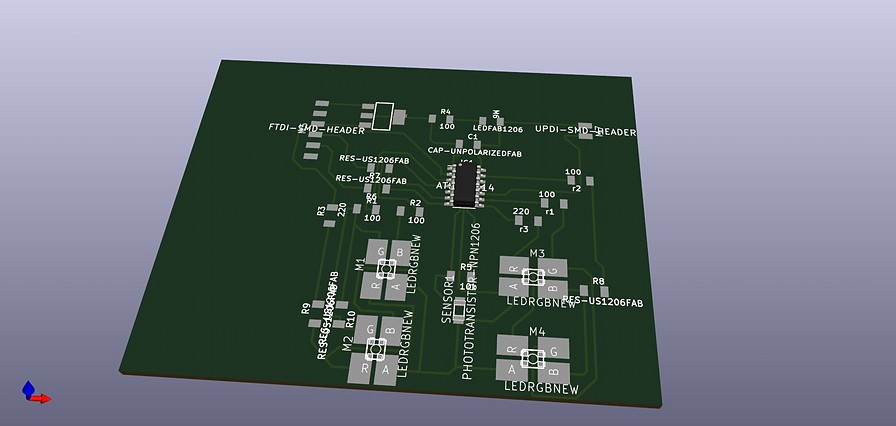
When loading the 3D view I realized that the size of the pads for RGB is huge next to the size of the component. I do not know what the problem is, but I will try to discuss it with my instructors before cutting. They may know what to do. It's weird because the pad is inside our footprint library. I don't quite understand what happens. It shouldn't be a problem anyway because the geometry seems to adapt to the component connections.
SVG to PNG
This I always think is the worst part of the process. Kicad is a very closed software that helps a lot in an unknown way in the design of electronic components. On the other hand, the jump to vector software such as Illustrator or Inkscape is not very parametric in comparison. Anyway, I find the results to be good and it looks good.
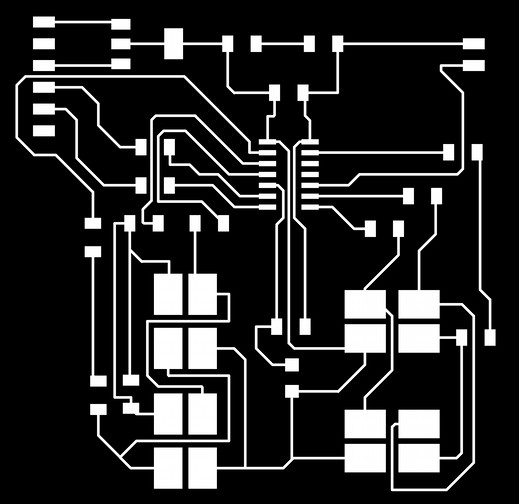

When jumping to ModsProject, I realized that the 1/64 "endmill was not able to get into some of the finer areas of the traces file. Tomorrow I will try to discuss with my instructors what options I have.
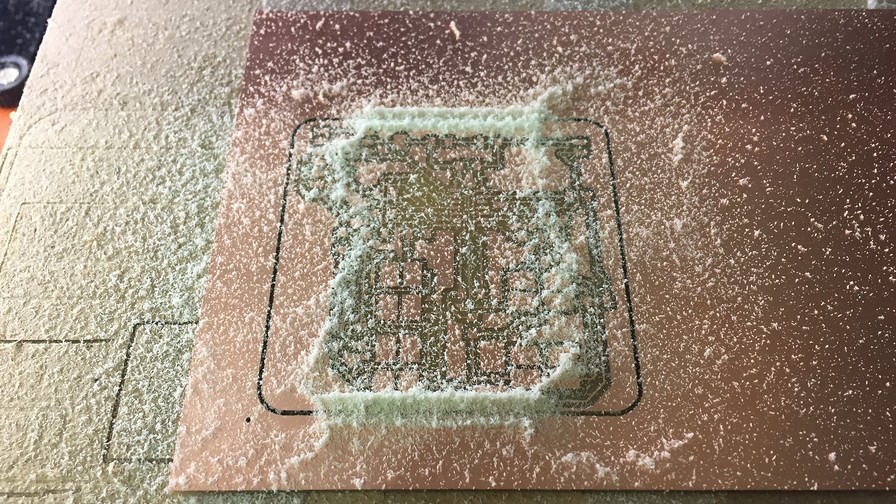
Milling
It's Tuesday and I still haven't been able to finish manufacturing the component. Hope the milling process works fine and I can get down to scheduling in the morning. For now I am going to prepare the files in the cloud so in case I receive some advice, I can start milling and soldering.
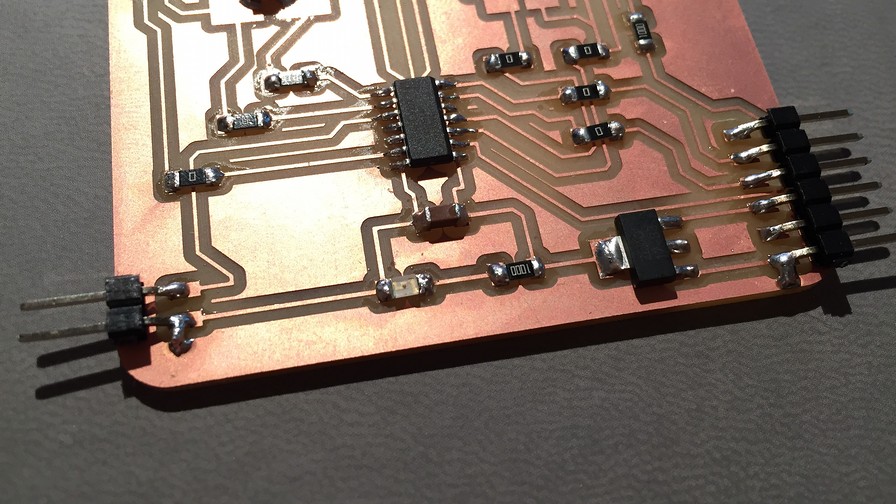
I arrived very early at the Lab this morning and I started to work. After yesterday's work until 2am, I think it's worth continuing to work hard. I prepare the machine, the Roland SRM-20 and start milling. After about 30 minutes between the trace and the interior, I am super happy with the result. The 0.3mm traces did not give me much confidence but the result is great !!!
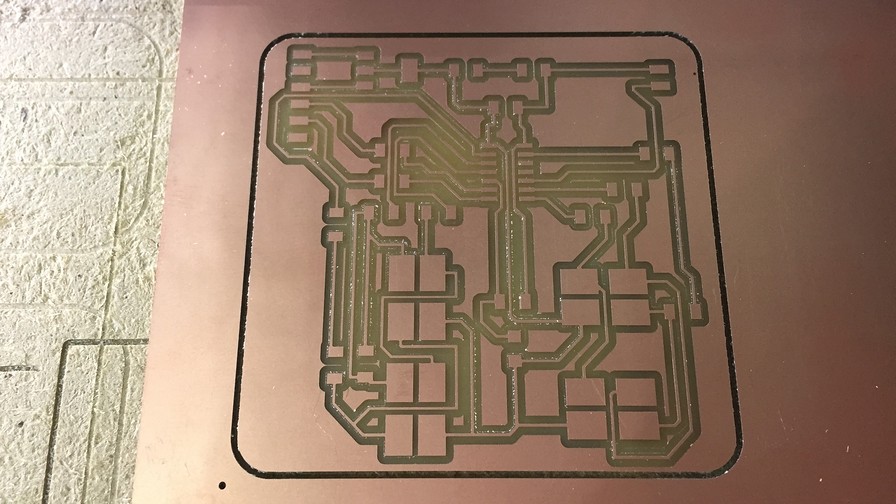
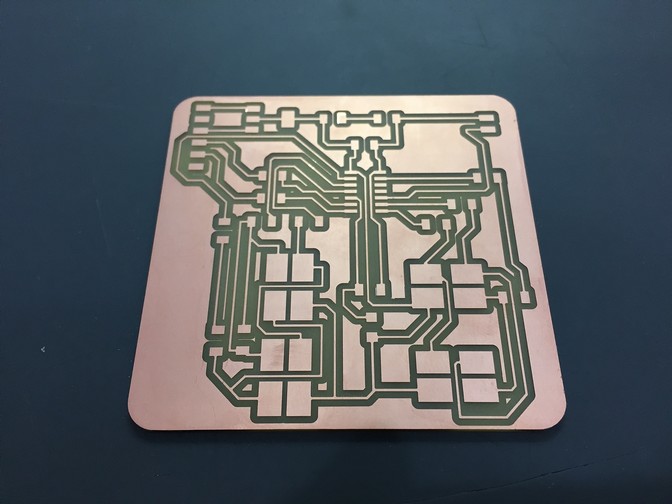
I've checked all the connectors and all the tracks. Everything seems to have continuity and I think it is time to weld all the components in their positions. Hopefully it's less of a headache than the milling process.
Surely you have noticed the large number of resistors on the PCB, but I only told you the value of those that protected the LEDs and that of the sensor pullup. Commenting with my partner Adrien, he explained to me the trick of using resistors of value 0 to be able to pass cables underneath. That's really what allowed me to make this one-sided PCB. I think working on two sides would have been too much new information for this assignment.
Soldering
During Monday afternoon, I had some problems with the computer and preferred to focus on finding the components to weld on the PCB. I prepared the kit, in a few minutes and now I really appreciate it. I can't imagine having to search for the components now.
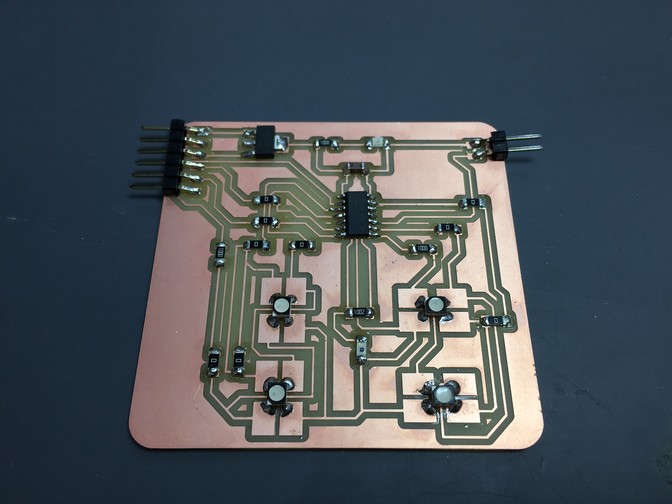
The soldering process went great. Everything seemed to fit together well and it finally looks like we can get into the fun of this week. Read colors and visualize the data on the computer. I'm looking forward to Output week to be able to control some LEDs with that data.
When I finished soldering I noticed an error in the Kicad schematics. The green LED was not turning on so something was not working properly. Luckily my partner Diego (big shoutout to him too !!) realized that one of the GNDs was not connected to the others. In the following images I show you the error in Kicad and the solution. It is not the best, but it is discreet.
Not having completely removed the copper on the PCB, I decided to convert all the outer excess to GND. As you can see I soldered the two GND's to the excess copper. At last everything was working properly. It was time to have fun: program it and finally turn on the LEDs.
Programming
Huge shoutout to Adrián Torres for his documentation related to the color sensor project. It was a great starting point to start working on my code. As I always say, the programming part is where I feel weakest, but with this little push I am motivated to program my PCB.
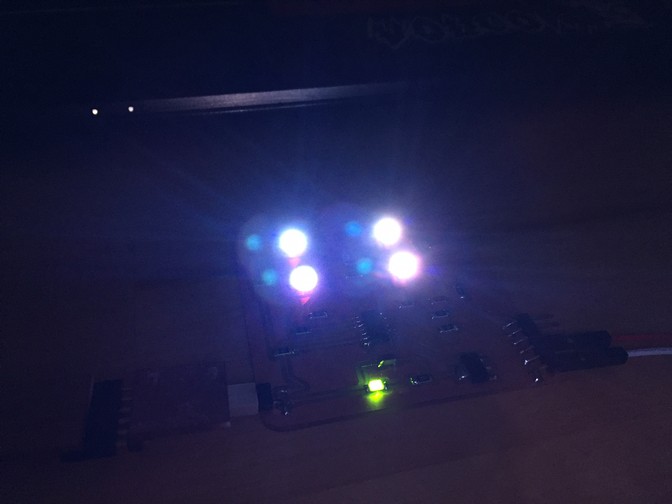
RGB Blink
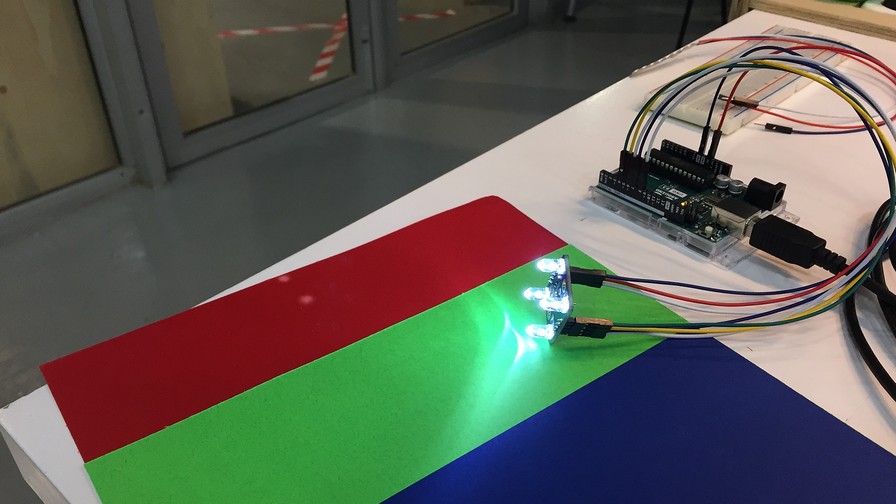
The first step was to turn on the lights and understand how the three color channels within each can be controlled. For this and with the help of Josep (instructor) I understood and developed my first code made entirely by me. It is a simple blink system that alternates between the 3 RGB color channels in small intervals. I think it is a good way to check that everything works correctly. AND IT IS GREAT !!!
The LEDs are very powerful and the phone has trouble focusing in the sudden change of light. Here is another video in which they are covered with a PLA screen.
int BL = 2;
int RL = 0;
int GL = 1;
int BR = 10;
int RR = 6;
int GR = 7;

int lectura;

void setup() {
	// initialize digital pin LED_BUILTIN as an output.
	Serial.begin(9600);
	pinMode(BL, OUTPUT); //
	pinMode(GL, OUTPUT);
	pinMode(RL, OUTPUT);
	pinMode(BR, OUTPUT);
	pinMode(RR, OUTPUT);
	pinMode(GR, OUTPUT);
	digitalWrite(BL, HIGH);
 	digitalWrite(GL, HIGH);
	digitalWrite(RL, HIGH);
	digitalWrite(BR, HIGH);
	digitalWrite(RR, HIGH);
	digitalWrite(GR, HIGH);
	pinMode(3, INPUT);
}


void loop() {
	lectura = analogRead(3);
	Serial.println(analogRead(3));
	delay(1000);
	blinkRed();
	blinkGreen();
	blinkBlue();
	//whiteLight();
}

void blinkRed() {
	digitalWrite(RL, HIGH);
	digitalWrite(RR, HIGH);
	delay(100);                       // wait for a second
	digitalWrite(RL, LOW);
	digitalWrite(RR, LOW);
	delay(100);                       // wait for a second
	digitalWrite(RL, HIGH);
	digitalWrite(RR, HIGH);
	delay(100);                       // wait for a second
}

void blinkGreen() {
	digitalWrite(GL, HIGH);
	digitalWrite(GR, HIGH);
	delay(100);                       // wait for a second
	digitalWrite(GL, LOW);
	digitalWrite(GR, LOW);
	delay(100);                       // wait for a second
	digitalWrite(GL, HIGH);
	digitalWrite(GR, HIGH);
	delay(100);                       // wait for a second
}

void blinkBlue() {
	digitalWrite(BL, HIGH);
	digitalWrite(BR, HIGH);
	delay(100);                       // wait for a second
	digitalWrite(BL, LOW);
	digitalWrite(BR, LOW);
	delay(100);                       // wait for a second
	digitalWrite(BL, HIGH);
	digitalWrite(BR, HIGH);
	delay(100);                       // wait for a second
}
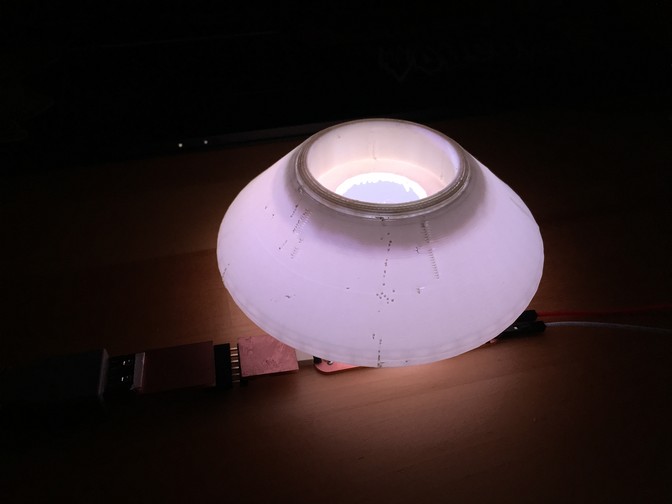
White Light
The next step to get on with the color reading was to generate white light to be able to bounce off the colored surfaces and have the sensor read the wavelength it receives back. For this reason, in this second program, I activate the three color phases at maximum intensity. The color does not turn out to be pure white, but I think that when we get to future weeks of programming, I will be able to modulate the channels and get closer to the purest white possible.
int BL = 2;
int RL = 0;
int GL = 1;
int BR = 10;
int RR = 6;
int GR = 7;

int lectura;

void setup() {
  // initialize digital pin LED_BUILTIN as an output.
  Serial.begin(9600);
  pinMode(BL, OUTPUT); //
	pinMode(GL, OUTPUT);
  pinMode(RL, OUTPUT);
  pinMode(BR, OUTPUT);
  pinMode(RR, OUTPUT);
  pinMode(GR, OUTPUT);
  digitalWrite(BL, HIGH);
  digitalWrite(GL, HIGH);
  digitalWrite(RL, HIGH);
  digitalWrite(BR, HIGH);
  digitalWrite(RR, HIGH);
  digitalWrite(GR, HIGH);
  pinMode(3, INPUT);
}

void loop() {
  lectura = analogRead(3);
  Serial.println(analogRead(3));
  delay(1000);
  //blinkRed();
  //blinkGreen();
  //blinkBlue();
  whiteLight();
}

void whiteLight() {
  digitalWrite(BL, LOW);
  digitalWrite(GL, LOW);
  digitalWrite(RL, LOW);
  digitalWrite(BR, LOW);
  digitalWrite(RR, LOW);
  digitalWrite(GR, LOW);
}
Serial Monitor
At this point, it only remains to see how the phototransitor works and try to understand how it is reading the color of the surface. It must be taken into account that since it does not have the integrated digital sensor, which already generates the readings through R, G, B, this measurement would require a lot of post-processing to be transformed into an understandable data. For now I think that receiving a reading alteration is more than enough as a first approximation to the color reading of my final project.
Readings range from 20-30 while you are away from the surface and quickly rise to 950-1000 when you approach the surface. I do not think that at this moment I am reading color but intensity of light. I think it would be necessary to process the information, to understand how to transform the voltage change into an RGB color code.
Checking with Adrian's documentation, I realized that his digital/ sensor aready reads four values: RED, GREEN BLUE, WHITE. It performs 4 simultaneous readings of R, G, B and W, thus being able to extract the super clear information first hand. I think that is the path I must follow in order to transfer the input knowledge that I have acquired this week to the final project.
Conclusions
The most important conclusion that I draw from this week is the following:
The ability to feel the real world through electronic devices is an incredibly powerful tool. Not only from the perspective of a designer, but as a person. In this case, reading color has been used to help color blind people to be able to see colors through sounds related to color. The fact of extracting data in real time from the world results in electronics entering our day to day. Today, we cannot imagine our lives without electronics, but I consider that it is in the input branch, where we have advanced the most.
Doing some analysis of my week, I consider that the objective of reading color is not fulfilled at 100%, but it is at 90%. With the specific sensor that analyzes the 4 phases of color, it could be reading color in a matter of a couple of days. I have also realized the need for data processing. A number without scale or meaning is nothing more than figures written together. It is necessary to develop the second layer of code that allows you to understand this data in real time.
Iteration 2: TCS3200 Color Sensor
After spending the whole week "suffering" with the phototransistor to read color (I do not consider it a mistake, because the knowledge I have acquired has been a lot), my classmate Den appeared to save me.
Without asking, he brought me a TCS3200 sensor from his case so that he could read colors with more guarantees. The important difference between the PT15-21C / TR8 sensor and this new one is the way it generates the readings. Next we enter the datasheet of the sensor so that you better understand how it performs the readings.
TCS3200 Datasheet
The sensor datasheet focuses on the sensor itself, but leaves out the surrounding PCB, for now let's focus on the operation of the TSC3200.
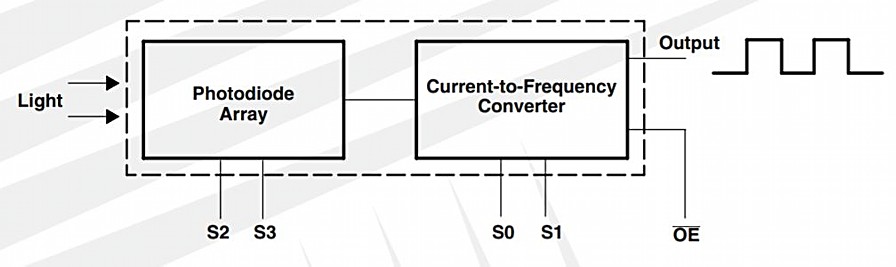
What it does in broad strokes is to receive the reflection of the color of the material and convert it into a high / low digital output, of the 3 colors of the RGB spectrum. Putting it in order:
- Emit light on the material with the entire visible spectrum (white light)
- Receive the reflected wavelength and convert it to 3 RGB tracks
- Transform current change readings into frequency changes
- Send that information separate on pins s1-s4 to understand the colors separately
- Repeat the process in short time intervals
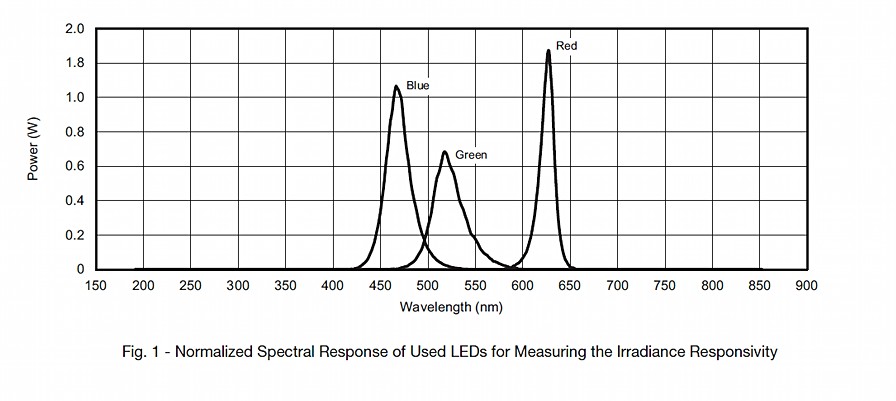
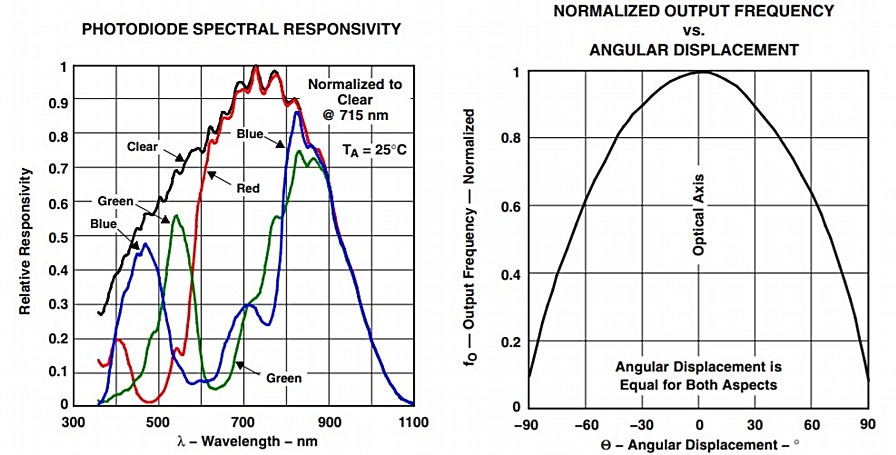
Color Sensitivity: Better but no perfect
Reviewing the data it offers at the sensitivity level, this sensor is much better than the one previously used, and is focused on reading colors not only light intensity. Below you have the graph of color peaks so that you can compare with the previous one.
Reviewing a bit of online codes to understand how to treat the sensor's input and output, it turns out that the way it works can be done in two main ways. Next I will explain to you how I have worked with him.
Programming Logic
Way 1: calibration and mapping
This first way, seeks to calibrate the sensor according to the ambient light of the place and adjust the color according to where the sensor is. Here is the complete code, once calibrated:
/*     Arduino Color Sensing Tutorial
 *
 *  by Dejan Nedelkovski, www.HowToMechatronics.com
 *
 */

#define S0 4
#define S1 5
#define S2 6
#define S3 7
#define sensorOut 8
int frequency = 0;
void setup() {
  pinMode(S0, OUTPUT);
  pinMode(S1, OUTPUT);
  pinMode(S2, OUTPUT);
  pinMode(S3, OUTPUT);
  pinMode(sensorOut, INPUT);

  // Setting frequency-scaling to 20%
  digitalWrite(S0,HIGH);
  digitalWrite(S1,LOW);

  Serial.begin(9600);
}
void loop() {
  // Setting red filtered photodiodes to be read
  digitalWrite(S2,LOW);
  digitalWrite(S3,LOW);
  // Reading the output frequency
  frequency = pulseIn(sensorOut, LOW);
  //Remaping the value of the frequency to the RGB Model of 0 to 255
  frequency = map(frequency, 40,95,255,0);
  // Printing the value on the serial monitor
  Serial.print("R= ");//printing name
  Serial.print(frequency);//printing RED color frequency
  Serial.print("  ");
  delay(100);
  // Setting Green filtered photodiodes to be read
  digitalWrite(S2,HIGH);
  digitalWrite(S3,HIGH);
  // Reading the output frequency
  frequency = pulseIn(sensorOut, LOW);
  //Remaping the value of the frequency to the RGB Model of 0 to 255
  frequency = map(frequency, 37,200,255,0);
  // Printing the value on the serial monitor
  Serial.print("G= ");//printing name
  Serial.print(frequency);//printing RED color frequency
  Serial.print("  ");
  delay(100);
  // Setting Blue filtered photodiodes to be read
  digitalWrite(S2,LOW);
  digitalWrite(S3,HIGH);
  // Reading the output frequency
  frequency = pulseIn(sensorOut, LOW);
  //Remaping the value of the frequency to the RGB Model of 0 to 255
  frequency = map(frequency, 31,60,255,0);
  // Printing the value on the serial monitor
  Serial.print("B= ");//printing name
  Serial.print(frequency);//printing RED color frequency
  Serial.println("  ");
  delay(100);
}
The problem with these readings is the calibration, basically what we are doing is finding the optimal colors and establishing the upper and lower digital limit (0-255) depending on where the sensor is. The environmental sensitivity is very high and as you will see on the serial monitor, the values quickly lose sense.
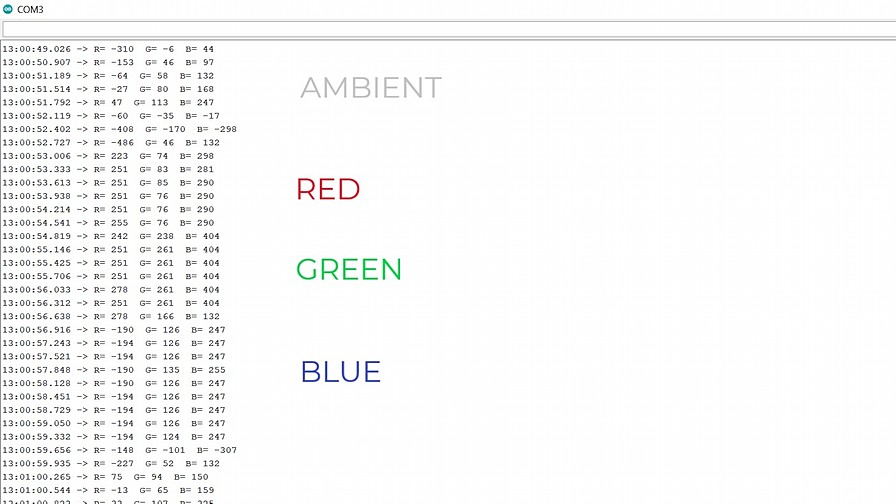
As you can see, the exact color readings are perfect, but the other two colors lose all sense giving negative or higher values than 255. So, let's try another way to detect color in a controlled way.
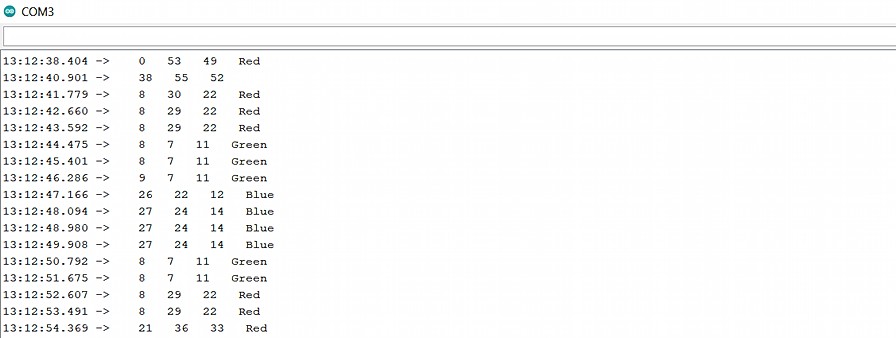
Way 2: Read Color and Mix it
This second code uses a simpler system, but one that is easier to understand: it reads the colors separately and proposes a function of mixtures between them. Consider that the lowest value corresponds to the color you are reading. That partly helps to understand what you are doing, but on the other hand, it forces you to define a blending function for each color you want to read.
const int s0 = 4;
const int s1 = 5;
const int s2 = 7;
const int s3 = 6;
const int out = 8;
int rojo = 0;
int verde = 0;
int azul = 0;

void setup(){
  Serial.begin(9600);
  pinMode(s0,OUTPUT);
  pinMode(s1,OUTPUT);
  pinMode(s2,OUTPUT);
  pinMode(s3,OUTPUT);
  pinMode(out,INPUT);
  digitalWrite(s0,HIGH);
digitalWrite(s1,HIGH);
}


void loop(){
  color();
  Serial.print("   ");
  Serial.print(rojo, DEC);
  Serial.print("   ");
  Serial.print(verde, DEC);
  Serial.print("   ");
  Serial.print(azul, DEC);

  if (rojo < azul && verde > azul && rojo < 35)
  {
   Serial.println("   Red");
  }
  else if (azul < rojo && azul < verde && verde < rojo)
  {
   Serial.println("   Blue");
  }

  else if (rojo > verde && azul > verde )
  {
   Serial.println("   Green");
  }
  else{
  Serial.println("  ");
  }
  delay(900);
  }

void color()
{
  digitalWrite(s2, LOW);
  digitalWrite(s3, LOW);
  rojo = pulseIn(out, digitalRead(out) == HIGH ? LOW : HIGH);
  digitalWrite(s3, HIGH);
  azul = pulseIn(out, digitalRead(out) == HIGH ? LOW : HIGH);
  digitalWrite(s2, HIGH);
  verde = pulseIn(out, digitalRead(out) == HIGH ? LOW : HIGH);
}
As you can see in this case, I can have clear readings of the color that I am seeing, thus being quite easy to transfer that data directly to an output such as an RGB LED. In any case, the readings are still limited by the number of functions that are defined. You should find a better alternative for the sensor.
Original Files
Link to Original files from this week.
What to improve for next assignments?
I don't think there is anything concrete that has gone wrong this week. I believe that the level of this second phase of the Academy has increased the level of difficulty compared to the previous cycle. Now we are no longer focusing on the basics but we are taking previous knowledge for granted.
What to keep an eye on during week 11?
· Do not lose sight of the basic concepts of the first cycle of the FabAcademy.
· Try to continue focusing my efforts on content of interest to the Final Project. It is more difficult to overcome the weeks, but it is time that I win before I come across eventual problems with the project.
· Trying to stay in the mood for this past Saturday. I was totally concentrated working for hours but dancing in front of the computer, because I was having a great time.