13. Interface and application programming
Group assignment:
- Compare as many tool options as possible
Individual assignment:
- Write an application that interfaces a user with an input &/or output device that you made
Group assignment
Our group assignment can be found here
Individual assignment
I decided to use Processing to visualize my final project ultrasonic distance sensor data. This assignment was the last one that I complited since the corona virus situation. I had already designed and fabricated my final project board and fastened it to my lamp. Since I tried to make a very simple board using the components available in my home town Fablab (Fablab Tampere) I programmed my chip in Arduino board and attached the programmed microcontroller to my own board instead of having a programming pin in my own board. It was not convenient to do it that way but I managed to make my lamp work so I accepted it.
In this week’s assignment I’m using Arduino Nano to visualize sensor data since I don’t have TX and RX pins or programming pin in my board. In addition to having a pin for programmin the board, I also should have added FTDI header connected to my microcontroller TX and RX. TX, RX and programming pins are something I would change in my board design if I was going design my lamp again and the corona virus was not there to mix all up. If I had those, I would have programmed my board using week 5 programmer and then connected my board to the computer using FTDI header.
I’m also using my week 7 board to make an interface that turns the board LED on and off.
I started by downloding Processing from download page. Next I read through Processing Overview and tested some example codes. I also watched a very good tutorial about serial communication and processing which helped to understand better what I should do. Next I took time reading through and trying to understand sparkfun’s Connecting Arduino to Processing tutorial.
I spent quite a long time browsing internet and trying to decide what kind of visualization I wanted to make. I ended up following this tutorial to have distance value printed as a number and this tutorial to have the sensor data control an image size.
I also found Nisha’s page and used it as a reference to make an interface for my own board.
Sensor data visualized as number
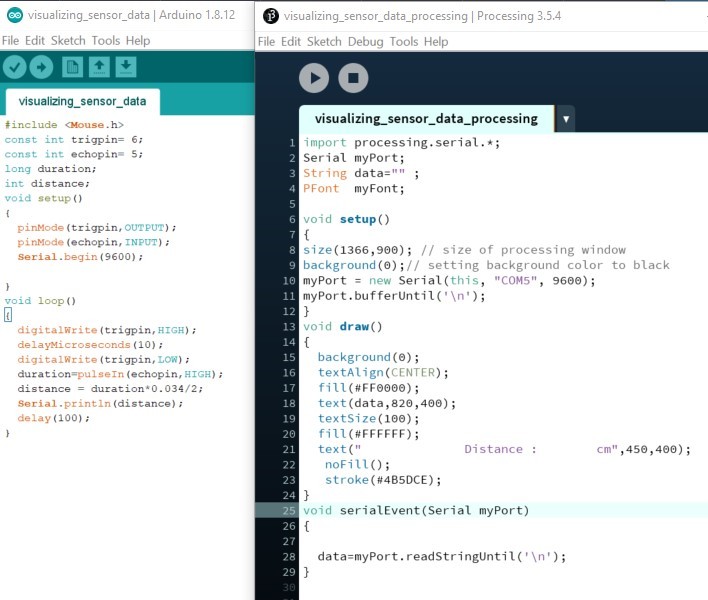
I copied the number tutorial code to Arduino IDE and made some modifications to it.
<Mouse.h> is library built-in by Arduino which allows an Arduino board to act as a mouse (not sure why it is used in the example code). I changed trig and echo pin
numbers to mach my Arduino Nano pin numbers (trigpin= 6, echopin= 5). I also added delay(100) to end of the
void loop() to have less noisy data printed in the processing window.
Next I copied processing code to my Processing sketch window. setup() is used for an initialization; in this case, setting the screen size and making the background black.
I added my port number to myPort = new Serial(this, "COM5", 9600);.
draw() is used to handle the animation. I changed sensor data text colour to red (fill(#FF0000)) and
Distance___cm text colour to white (fill(#FFFFFF)). text() functions are used to write a text and the data received from serial communication is
presented by taking it into account in text(data,820,400);.
I am using asynchronous serial communication with 9600 baud rate. The data that is sent from the board to computer is in string format (string presenting the calculated distance in decimal).
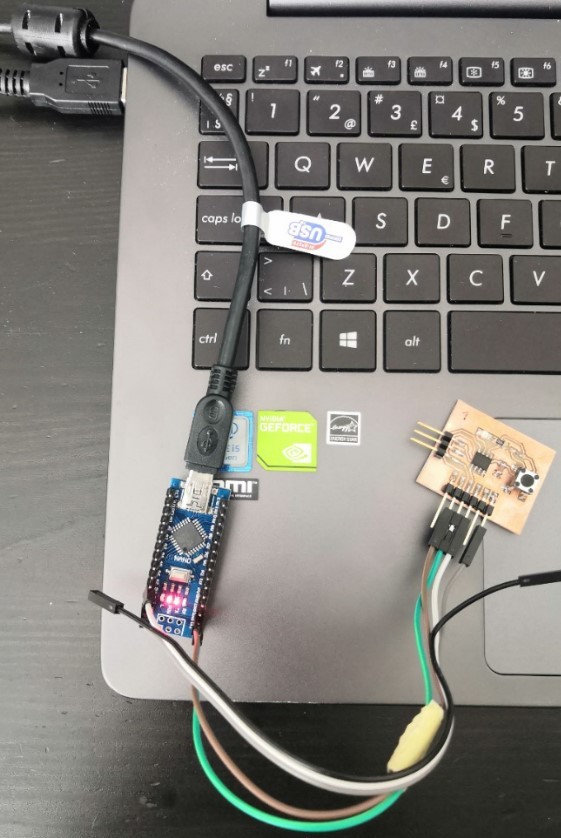
My Arduino Nano board with Ultrasonic Distance sensor:

After modifying the code and wiring my board I uploaded the Arduino IDE code to my board and ran the processing code. The sensor data was read and printed successfully.

Video: sensor data visualized as number
Sensor data visualized as an image size
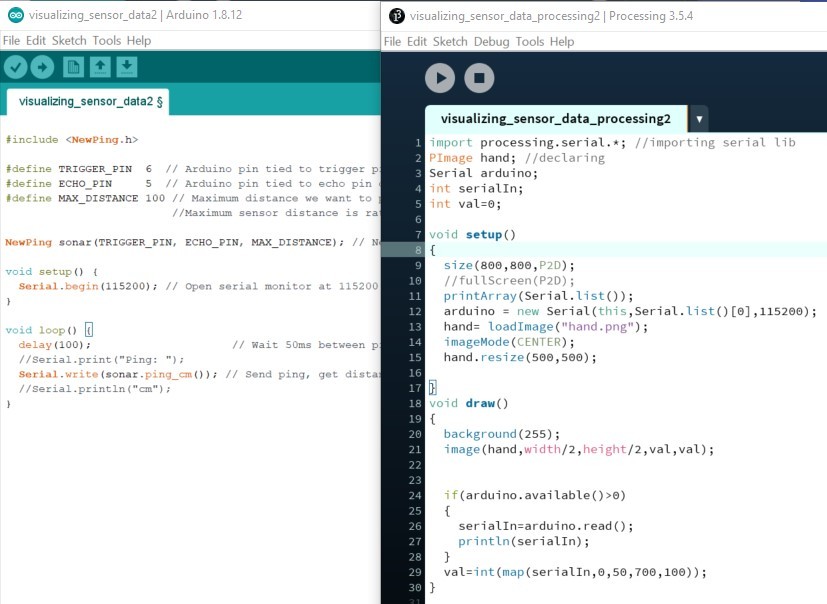
I copied the processing code to Arduino IDE.
First, I installed <NewPing.h> library. It is a library that should make working with ultrasonic sensors easier.
In this code there was delay(100) set at the void loop() so I didn’t have to add that. In this part 115200 baud rate is used.
I downloaded an image
that I wanted to make bigger and smaller based on the sensed data. I added the picture to same folder as my
processing file. The image() function draws an image to the display window. Images must be in the sketch’s “data” directory to load correctly.
In image(img, a, b, c, d) function the img parameter specifies the image to display and by default the a and b parameters define the location of its
upper-left corner. The image is displayed at its original size unless the c and d parameters specify a different size (here specified by val variable).
diy image is replaced with my hand image.
I changed val=int(map(serialIn,0,50,100,500)) to
val=int(map(serialIn,0,50,700,100)) to make the picture bigger when the object gets closer. val is used to define the image size in the animation.
map() function re-maps sensor data value so that when object is closer (distance is shorter) the image is represented bigger.
Next I hit the run button. This code was also working nicely.

Video: sensor data visualized as an image size
Controlling my own board
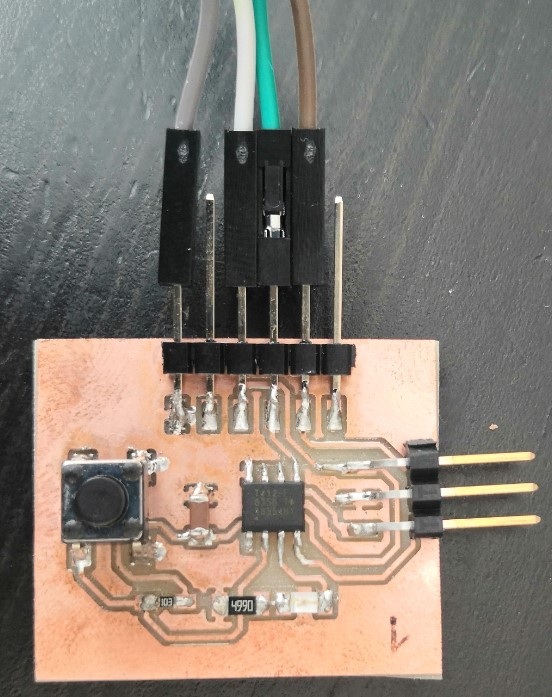
I used my week 7 board in this section to make and interface that turns the board LED on and off. I modified Nisha’s original code by changing the LED, TX and RX pin numbers in Arduino IDE to mach the ones in Networking and Communications code.
I used my week 5 UPDI programmer to program my board. This was done the same way as in Networking and Communications week.
In processing code I modified myPort = new Serial() by adding my port number COM5.
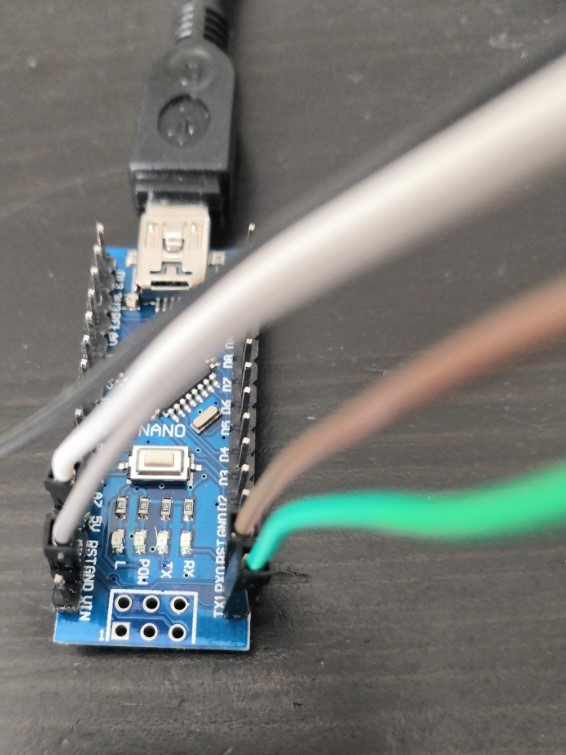
I used Arduino Nano as a hub since I don’t have a FTDI cable. I made wiring using the same principle as in Network and Communications assignment.
Now when I ran processing code I was able to control the LED by pressing on/off in the processing user interface (sending a string with value ‘1’ to turn the LED on or ‘0’ to turn the LED off).

Video: controlling my own board
Reflection
This was the final assignment that I completed in the Fab Academy since Corona virus mixed everything up. But actually it was a good thing. When this assignment was given to us I had no understanding of serial communication. Now that I have completed my final project I feel like this week assignment was quite easy to finish. I had at first some troubles using the image code since I was using the number Arduino code which was not in sync with the processing code. I fixed noisy data by adding some delay to the code.
The biggest problem was to figure how the processing works. I am not that familiar with coding but by browsing the internet I was able to find the examples used in this assignment. With small modifications (modifying the pin numbers, port numbers and adding some delay) I was able to make working interfaces.
Since I used these example codes and made only small modifications I did not face any problems. With my own board I had already solved all the problems with pin numbers, wiring etc. in the Networking and Communications week so it was pretty strightforward to make the interface.