Week 14
Interface and Application Programming
This weeks assignment was to write an application that interfaces with an input &/or output device. Group assignment was to compare as many tool options as possible.
Python & Tkinter
Python is an interpreted high-level programming language for general-purpose programming. By default, python in installed in Ubuntu. Python has a large standard library that provides tools suited to many tasks. We have to select the required library packages and install it before writing the code. pip is a package management system used to install and manage software packages written in Python. To install pip, enter the following command in terminal.
sudo apt-get install python-pipNumpy is the fundamental package for scientific computing with Python. To install numpy, enter the following command in the terminal.
sudo apt-get install python-numpyMatplotlib is a plotting library which can generate plots, histograms, power spectra, bar charts, errorcharts, scatterplots, etc., with just a few lines of code. To install matplotlib, enter the following command in the terminal.
sudo apt-get install python-matplotlibDrawnow allows updates of any figure. This can be used to update the figures created using matplotlib. To install drawnow, enter the following command in the terminal.
sudo pip install drawnowpySerial module encapsulates the access for the serial port. This is needed to interface the MCU in serial communication. This library allows us to receive and send data through serail ports. To install pySerial, enter the following command in the terminal.
pip install pyserialTkInter is Python's standard GUI (Graphical User Interface) package which is widely used. To install TkInter, enter the following command in the terminal.
sudo apt-get install python-tk Writing a programme in python begins with importing the required libraries.
For integrating serial communication into TkInter, I relied upon
this website in particular.
Python GUI-TkInter
TkInter with serial
Interfacing with LED on the Hello World Board made during Electronics Design Week.
The first step is to programme the ATtiny44 to read serial data, and to then interpret it and act accordingly. I uploaded the below sketch in Arduino IDE. (Using Arduino IDE during the Embedded Programming Week.)
  // This Arduino sketch is written to read a character send over serial communication
  // and to control the status of an LED according to the character received
  // If the character received is "h", MCU will make the LED ON.
  // If the character received is "l", MCU will make the LED OFF.
  // If the character received is "1","2" or "3", MCU will blink the LED 1, 2 & 3 times respectively.
  //
  // Akhil Hari 24-06-2018
  // Fab Academy 2018, Fab Lab Trivandrum, India
  // Interface & Application Programming Week

  // MCU - ATTINY44-SSU
  // LED is connnected to PA7 (Arduino Pin No. 7).

  #include <SoftwareSerial.h>
  SoftwareSerial Serial(0, 1);    // Initialize serial communications with pins 0, 1  (RXD, TXD).
  void setup() {                  // the setup function runs once.
    pinMode(7, OUTPUT);           // LED is connected to PA7, hence initialize digital Arduino pin No.7 as an output.
    Serial.begin(9600);           // Initialize serial communication at a baud rate of 9600.
  }
  void loop() {                   // the loop function runs over and over again forever
    if (Serial.available()) {     // check if any serial data is available
      char x = Serial.read();     // reads the serial and assign the value to a variable charecter "x"
      if (x == 'h') {             // check if the character received is "h"
        digitalWrite(7, HIGH);    // turn on the LED on PA7
      }
      else if (x == 'l') {        // check if the character received is "l"
        digitalWrite(7, LOW);     // turn off the LED on PA7
      }
      else if (x == '1') {        // check if the character received is "1"
        digitalWrite(7, HIGH);    // LED ON.
        delay(50);                // delay of 50ms
        digitalWrite(7, LOW);     // LED OFF
        delay(50);                // delay of 50ms
      }
      else if (x == '2') {        // Check if the character received is "2"
        digitalWrite(7, HIGH);    // LED ON.
        delay(50);                // delay of 50ms
        digitalWrite(7, LOW);     // LED OFF
        delay(50);                // delay of 50ms
        digitalWrite(7, HIGH);    // LED ON
        delay(50);
        digitalWrite(7, LOW);
        delay(50);
      }
      else if (x == '3') {        // Check if the character received is "3"
        digitalWrite(7, HIGH);    // Blink the LED three times
        delay(50);
        digitalWrite(7, LOW);
        delay(50);
        digitalWrite(7, HIGH);
        delay(50);
        digitalWrite(7, LOW);
        delay(50);
        digitalWrite(7, HIGH);
        delay(50);
        digitalWrite(7, LOW);
        delay(50);
      }
      Serial.println(x);           // the MCU will print the character received to the serial monitor.
    }
  }
  }
With the above programme in the MCU, whenever the MCU serially receives the character "h", it will turn the LED on, and will turn off if the character is "l". Also, if the character received is 1,2 & 3, the LED will blink once, twice and thrice respectively. To test if everything is fine, open the serial monitor in Arduino, and type "h" and press send. The MCU should send back "h" in the serial window with the LED getting powered on. Similar is the case when the other character l, 1, 2 and 3. If its not working, change the baud rate in the serial monitor window and check again. Even though the MCU is programmed for serial communication at a baud rate of 9600, I got it right at a baud rate of 1200! I'm yet to figure out the reason. Once we have figured out the baud rate, we can move onto writing the Python programme for making a GUI. Below is the python code with which the GUI was made.
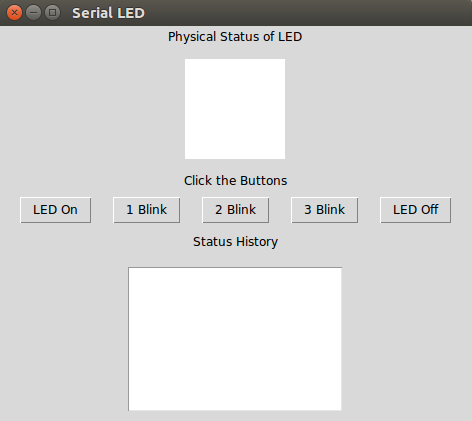
    # This programme in python makes a GUI with 5 buttons, which when clicked, will send
    # different characters over serial communication and also changes the colour of a
    # rectangular area inside the GUI.
    # The changing of colour is synchronous with the status of an LED controlled by an MCU,
    # which receives the serial data and toggle the status of the LED..
    # The GUI also has a text window which will log the button clicks.
    #
    # Akhil Hari 24-06-2018
    # Fab Academy 2018, Fab Lab Trivandrum, India
    # Interface & Application Programming Week
    #
    # This programme is made by modifying and combining the programmes obtained
    # from the website "Robotic Controls". The link to the respective original programmes are the one's given below.
    # http://robotic-controls.com/learn/python-guis/basics-tkinter-gui
    # http://robotic-controls.com/learn/python-guis/tkinter-serial
    # The authors of the original programme are Jennifer Case & Evan Boldt available on the below links.
    # https://plus.google.com/+JenniferCase_Robots
    # https://plus.google.com/+EvanBoldt
    #
    #
    from Tkinter import *               # Imports the Tkinter Library for making the GUI
    import serial                       # Imports the library fo serial communication
    import time                         # Imports the library for making delays work.
    root = Tk()                         # Makes a GUI window called root into which the widgets will be placed.
    root.wm_title("Serial LED")         # Makes the title that will appear in the top left of the GUI window
    root.config(background = "#FFFFFF") #sets background color to white
    #A. Widgets Begin
    #1.Frame and its contents
    Frame1 = Frame(root, width=400, height = 600) #creates a Frame widget named "Frame1" of size 400x600 inside the root window
    Frame1.grid(row=0, column=0, padx=0, pady=0)  #Places the "Frame1" widget on row 0 and column 0 of root grid.

    firstLabel = Label(Frame1, text="Physical Status of LED") #creates a label widget named "firstlabel" inside Frame1
    firstLabel.grid(row=0, column=0, padx=10, pady=2)         #Places the label widget on row 0 and column 0 of Frame1 grid

    #2.Canvas for drawing rectangle which changes colour on button clicks.
    rectCanvas = Canvas(Frame1, width=100, height=100, bg='white') #Creates a canvas widget inside Frame1 with a WHITE background.
    rectCanvas.grid(row=1, column=0, padx=10, pady=10)             #Places the canvas widget on row 1 of Frame1 grid

    #3. Label on top of the Buttons
    secondLabel = Label(Frame1, text="Click the Buttons")       #creates a second label widget inside Frame1
    secondLabel.grid(row=2, column=0, padx=10, pady=2)          #Places the label widget on row 2 of Frame1 grid

    #4. Frame for placing the Buttons
    btnFrame = Frame(Frame1, width=400, height = 300)           #creates another Frame widget inside Frame1
    btnFrame.grid(row=3, column=0, padx=10, pady=2)             #Places the label widget on row 3 of Frame1 grid

    #5. Label on top of the Status History Text widget
    thirdLabel = Label(Frame1, text="Status History")           #creates third label widget inside Frame1
    thirdLabel.grid(row=4, column=0, padx=10, pady=5)           #Places the label widget on row 4 of Frame1 grid

    #6 Text widget for logging the history.
    LEDLog = Text(Frame1, width = 30, height = 10, takefocus=0) #creates Text widget inside Frame1
    LEDLog.grid(row=5, column=0, padx=10, pady=10)              #Places the label widget on row 5 of Frame1 grid
    #Widget Ends

    #B. Functions for Drawing rectangles inside the canvas widget to represent the pysical status of LED.

    def redRectangle():
        rectCanvas.create_rectangle(0, 0, 100, 100, width=0, fill='red')#origin of rectangle is at 0,0(left top) with a size of 100x100
        LEDLog.insert(0.0, "On\n")                     #Insert the text "On" inside the LEDLog text widget and cursor goes to next line

    def redRectangle_1():
        rectCanvas.create_rectangle(0, 0, 100, 100, width=0, fill='red')

    def whiteRectangle():
        rectCanvas.create_rectangle(0, 0, 100, 100, width=0, fill='white')
        LEDLog.insert(0.0, "Off\n")

    def whiteRectangle1():
        rectCanvas.create_rectangle(0, 0, 100, 100, width=0, fill='white')

    def redRectangle2_2():
        rectCanvas.create_rectangle(0, 0, 100, 100, width=0, fill='red')
        root.after(500, whiteRectangle1)                            # redirects to execute the function "whiteRectangle1" after 500ms.

    def redRectangle3_3():
        rectCanvas.create_rectangle(0, 0, 100, 100, width=0, fill='red')
        root.after(500, whiteRectangle1)

    def whiteRectangle3_2():
        rectCanvas.create_rectangle(0, 0, 100, 100, width=0, fill='white')
        root.after(300, redRectangle3_3)                            # delay was changed to get in sync with the physical status of the LED.

    def redRectangle3_2():
        rectCanvas.create_rectangle(0, 0, 100, 100, width=0, fill='red')
        root.after(500, whiteRectangle3_2)

    def whiteRectangle2_1():
        rectCanvas.create_rectangle(0, 0, 100, 100, width=0, fill='white')
        root.after(350, redRectangle2_2)                            # delay was changed to get in sync with the physical status of the LED.

    def whiteRectangle3_1():
        rectCanvas.create_rectangle(0, 0, 100, 100, width=0, fill='white')
        root.after(350, redRectangle3_2)

    def redRectangle1():
        rectCanvas.create_rectangle(0, 0, 100, 100, width=0, fill='red')
        LEDLog.insert(0.0, "1 Blink\n")

    def redRectangle2():
        LEDLog.insert(0.0, "2 Blink\n")
        rectCanvas.create_rectangle(0, 0, 100, 100, width=0, fill='red')
        root.after(500, whiteRectangle2_1)

    def redRectangle3():
        rectCanvas.create_rectangle(0, 0, 100, 100, width=0, fill='red')
        LEDLog.insert(0.0, "3 Blink\n")
        root.after(500, whiteRectangle3_1)

    #Open serial port to the board

    ser = serial.Serial('/dev/ttyUSB0', 1200)   # Initilaising the USB serial port at a baud rate of 1200.
    time.sleep(1)                               # waiting 1 second for initialising the serial port.
    print("Click the buttons on the GUI")       # Prints the message into the terminal window.

    #Function for the buttons
    #Turning LED on
    def LEDOn():
        ser = serial.Serial('/dev/ttyUSB0', 1200) # Initilaising serial communication to USB port.
        ser.write("h")                            # Send the character "h"
        redRectangle()                            # Executes the function redRectangle on line 47

    #Blink once
    def LEDOn1():
        ser = serial.Serial('/dev/ttyUSB0', 1200)
        ser.write("1")
        redRectangle1()
        root.after(500, whiteRectangle1)          # Executes the function whiteRectangle1 on line 58 after 500ms.

    #Blink twice
    def LEDOn2():
        ser = serial.Serial('/dev/ttyUSB0', 1200)
        ser.write("2")
        redRectangle2()
        root.after(500, whiteRectangle1)

    #Blink thrice
    def LEDOn3():
        ser = serial.Serial('/dev/ttyUSB0', 1200)
        ser.write("3")
        redRectangle3()
        root.after(500, whiteRectangle1)

    #Turning LED off
    def LEDOff():
        ser = serial.Serial('/dev/ttyUSB0', 1200)
        ser.write("l")
        whiteRectangle()

    #Buttons

    newButton = Button(btnFrame, text="LED On", command=LEDOn)# creates a button inside the frame "btnFrame" (at 0,0) created earlier which will
    newButton.grid(row=0, column=0, padx=10, pady=2) # execute the function "LEDOn". The button have a text "LED On" over it and padding of 10,2

    newButton = Button(btnFrame, text="1 Blink", command=LEDOn1)
    newButton.grid(row=0, column=1, padx=10, pady=2)

    newButton = Button(btnFrame, text="2 Blink", command=LEDOn2)
    newButton.grid(row=0, column=2, padx=10, pady=2)

    newButton = Button(btnFrame, text="3 Blink", command=LEDOn3)
    newButton.grid(row=0, column=3, padx=10, pady=2)

    newButton = Button(btnFrame, text="LED Off", command=LEDOff)
    newButton.grid(row=0, column=4, padx=10, pady=2)

    ser.close()         #close serial port

    root.mainloop()     #loop to update GUI
The below image shows the GUI created when the programme is executed
The working of the python GUI can be observed from the video below.
Interfacing with the Hall Effect Sensor on the Board made during Input Devices Week.
By modifying the code in this website, attempt was made to plot a live Graph which will plot the value send by the MCU in serial communication. First step was to programme the MCU to send the analog value each second. I uploaded the below sketch with Arduino IDE, which will send the analog value each second. (Using Arduino IDE during the Embedded Programming Week.)
  // This arduino sketch is written to read the analog values obtained at
  // the MCU pin which is connected to the output of a Hall Effect Sensor.
  //
  // Akhil Hari 24-06-2018
  // Fab Academy 2018, Fab Lab Trivandrum, India
  // Input Devices Week
  //
  // MCU - ATTINY45SI
  // Output of Hall effect sensor(A1324) is connnected to PB4 (Arduino Pin No. A2).
  // Since, ATtiny 45 doesnt have a hardware serial pin, we have to declare and initialise the serials pins in the software.
  // PB2(Arduino Pin No. A1) is connected to the RXD pin of FTDI connector.
  // PB1(Arduino Pin No. 1) is connected to MISO of ISP Header.

  #include <SoftwareSerial.h>     // Includes the library for software serial.
  SoftwareSerial serial(1, A1);   // Declares the (RX, TX). RX declared as 1 is a dummy. Change the value to the corresponding Arduino Pin No.
  void setup() {
    serial.begin(9600);           // Begins serial communication at a baud rate of 9600.
  }
  void loop() {
    int x = analogRead(A2);       // Reads the value of pin A2 which is connected to the sensor and stores as an integer x.
    serial.println(x);            // Prints the value of A2, in the next line of the serial monitor.
    delay(1000);                  // Delay of 1s between the readings
  }
The below python code was used to plot the live graph.
# This programme in python plots a graph of the first 50 value's received from an MCU over serial communication.
# The MCU is sending the analog value read at its pin connected to the output of a hall effect sensor.
#
# Akhil Hari 24-06-2018
# Fab Academy 2018, Fab Lab Trivandrum, India
# Interface & Application Programming Week

# This programme is made by modifying the programme obtained
# from a tutorial website. The link to the respective original programme is the one given below.
# http://www.toptechboy.com/tutorial/python-with-arduino-lesson-11-plotting-and-graphing-live-data-from-arduino-with-matplotlib/
#
#
import serial                               # import Serial Library
import numpy                                # Import numpy
import matplotlib.pyplot as plt             # Import matplotlib library
from drawnow import *                       # Imports drawnow

valueV= []                                  # Creates an array for the analog Value received
ser = serial.Serial('/dev/ttyUSB0', 9600)   # Creating our serial object named ser
plt.ion()                                   # Tell matplotlib you want interactive mode to plot live data
cnt=0

def makeFig():                              # Create a function that makes our desired plot
    plt.ylim(0,1000)                        # Set y min and max values
    plt.title('Hall Effect Sensor')         # Plot the title
    plt.grid(True)                          # Turn the grid on
    plt.ylabel('Voltage')                   # Set ylabels
    plt.plot(valueV, 'ro-', label='Voltage')# Plot the Value received
    plt.legend(loc='upper left')            # Plot the legend


while True:                                 # While loop that runs forever
    while (ser.inWaiting()==0):             # Wait until there is data
        pass                                # do nothing
    serString = ser.readline()              # read the line of text from the serial port
    dataArray = serString.split(',')        # Split and store it into an array called dataArray
    value = float( dataArray[0])            # Convert first element to floating number and put in value
    valueV.append(value)                    # Build our valueV array by appending value readings
    drawnow(makeFig)                        # Call drawnow to update our live graph
    plt.pause(.000001)                      # Pause Briefly. Important to keep drawnow from crashing
    cnt=cnt+1
    if(cnt>50):                             # If you have 50 or more points, delete the first one from the array
        valueV.pop(0)                       # This allows us to just see the last 50 data points
Below image shows the graph drawn using the programme.
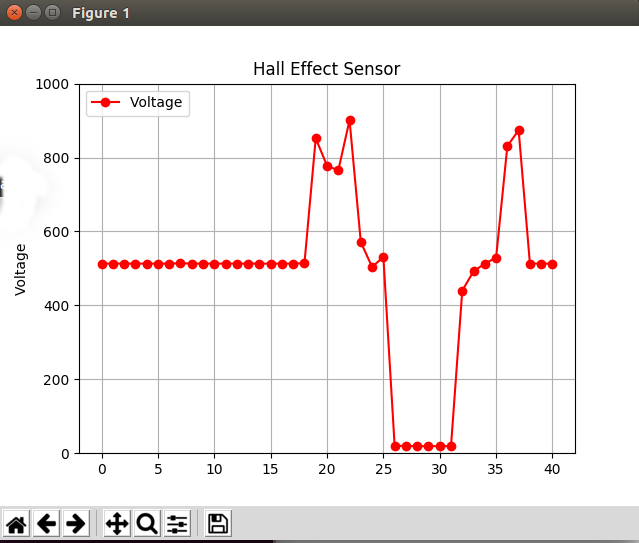
Below video shows the live plot of the graph. The magnet is mounted on the yellow disc which was made for my Final Project.