Week 15
Interface and application programming
Group assignment
- compare as many tool options as possible
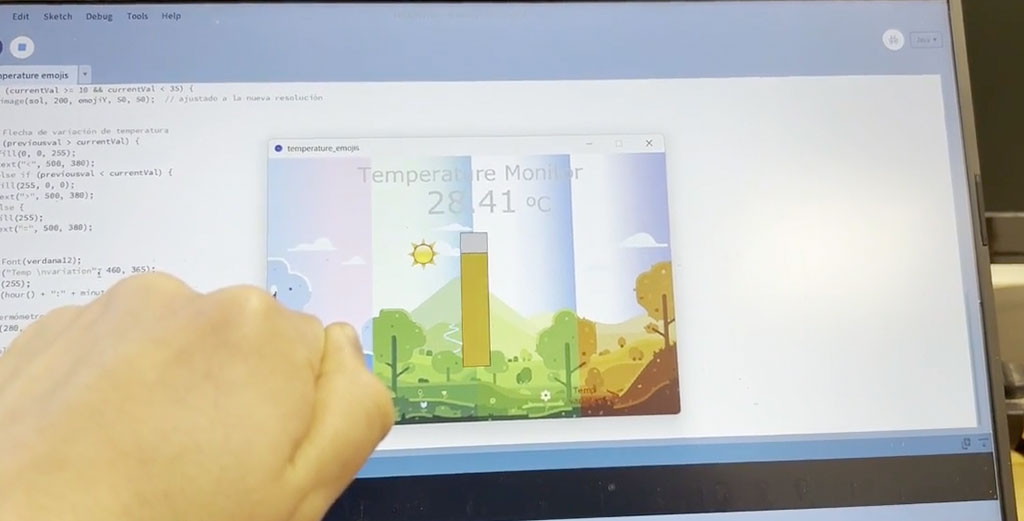
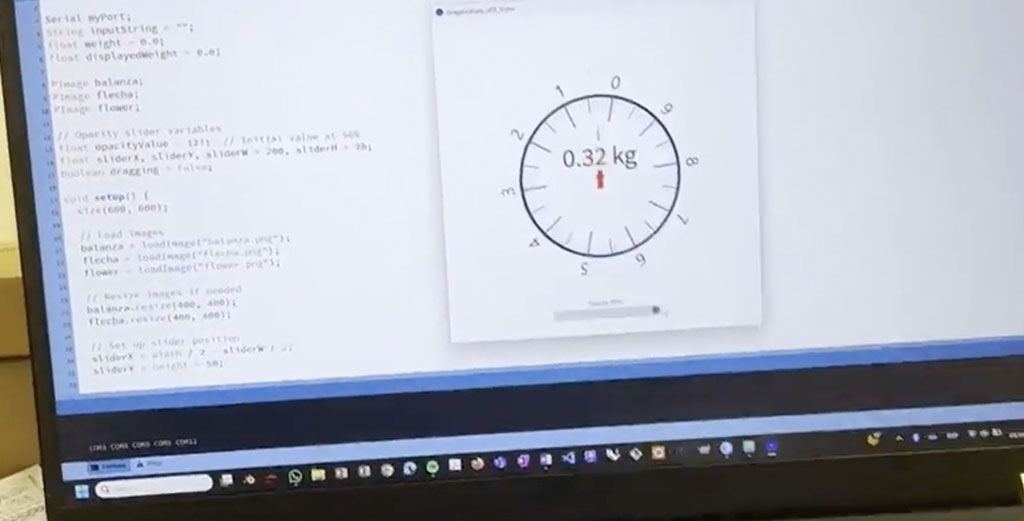
Each of us analyzed and explored Processing individually, developing their own understanding of the environment and its capabilities through hands-on experimentation and personal projects.
Processing is an open-source graphical programming environment designed to teach the fundamentals of computer programming within a visual context. It is especially popular in the fields of art, design, and creative coding due to its simplicity and focus on visual output. Based on Java, Processing allows users to quickly prototype interactive graphics, animations, and visualizations.
Scratch
(https://scratch.mit.edu/projects/editor/?tutorial=getStarted)Overview:
Scratch is a free visual programming language and online community developed by the MIT Media Lab. It allows users, especially children and beginners, to create interactive stories, games, and animations using block-based coding.
Development Environment:
Scratch runs directly in modern web browsers, eliminating the need for installation. It offers a drag-and-drop interface where users snap together colorful blocks to build logic, control flow, and multimedia interactions. Projects can be shared and remixed in the online community.
Strengths:
Scratch is highly accessible and beginner-friendly, making it ideal for introducing coding concepts to young learners. It promotes creativity, collaboration, and logical thinking without requiring any prior programming experience. The built-in library of sprites, sounds, and backgrounds accelerates the learning curve.
Challenges:
While great for learning, Scratch is limited in terms of scalability and functionality for advanced programming. It’s not suitable for building complex applications or professional software.
Opinion & conclusion:
With its visual style and playful interface, We found Scratch to be a great entry point into programming. It simplifies core coding ideas like loops, conditionals, and events in a way that's easy to understand. I created a small game where a sprite collects coins and keeps score—without writing a single line of traditional code. The instant feedback and sharing options also made it feel very interactive and rewarding.
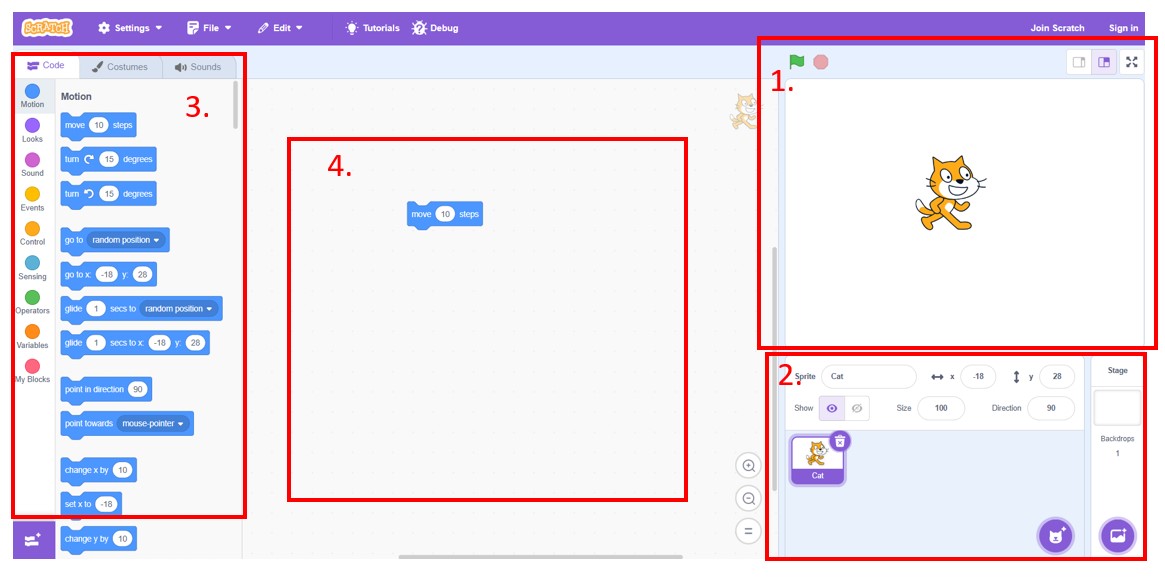
- Stage Area
Location: Top-right of the interface
Purpose: Displays the live preview of your project. Here, you can see your sprites (characters) move and interact based on the code you’ve written. It includes the green flag and red stop buttons to run or stop the project.
Includes: The stage (background), sprite thumbnails, and backdrop options. - Sprite List (Sprite Pane)
Location: Bottom-left, below the stage area
Purpose: Shows all sprites used in the project. You can select a sprite to edit its code, costumes, or sounds.
Includes: Add, duplicate, delete, and select sprites. - Blocks Palette
Location: Left
Purpose: Contains all the code blocks grouped into categories like Motion, Looks, Sound, Events, Control, Sensing, Operators, and Variables. You drag blocks from here to the coding area to create scripts.
Includes: A color-coded list of block categories and a search bar. - Script (Coding) Area
Location: Right side of the interface
Purpose: This is where you build your code by dragging blocks from the palette. Each script you create controls the behavior of the selected sprite or stage.
Includes: A blank canvas where code blocks are assembled in sequences.
FireFly
(https://www.food4rhino.com/en/app/firefly)Overview:
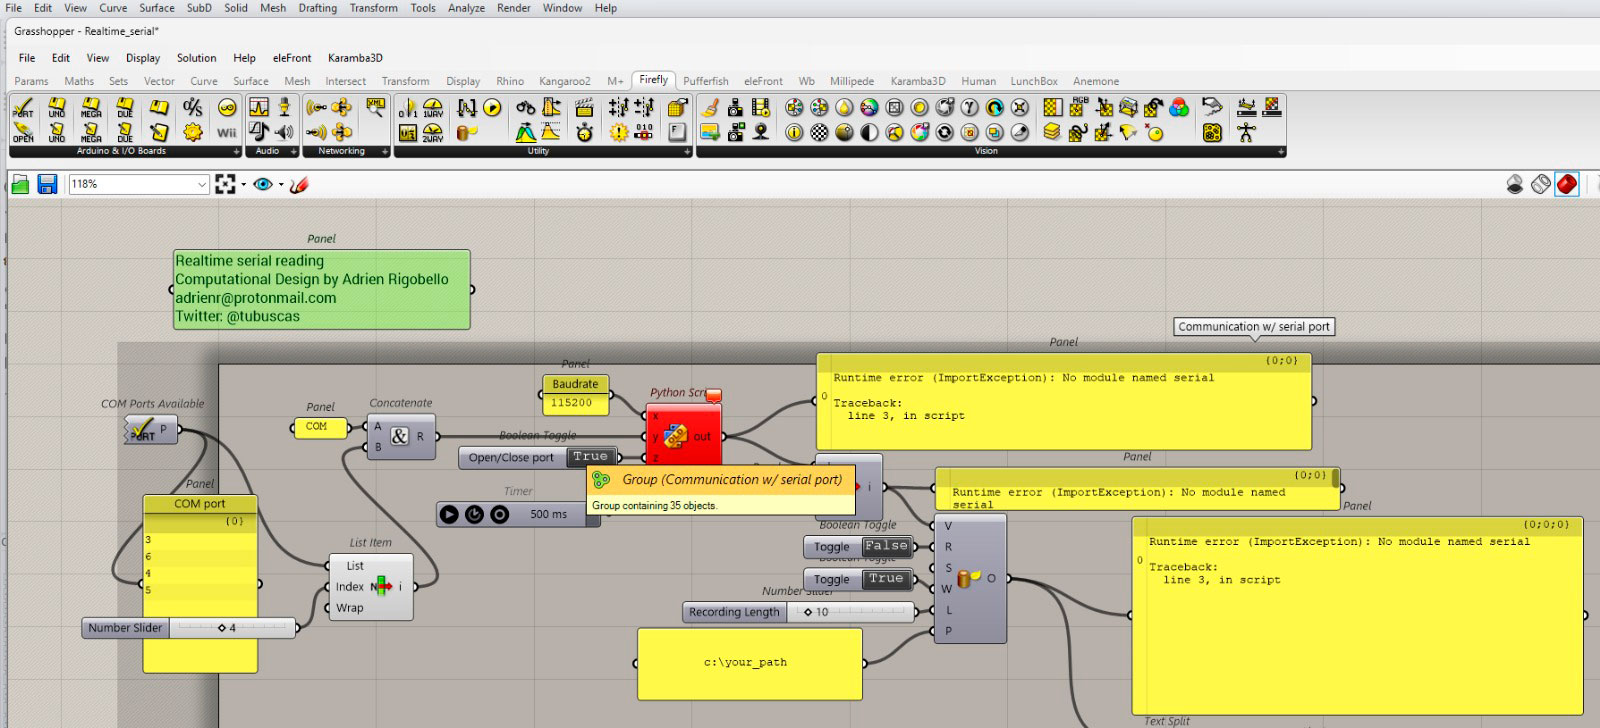
Firefly is a Grasshopper plugin that enables real-time communication between the digital and physical world. It connects devices like Arduino, webcams, Kinect, and other sensors to Grasshopper, allowing users to stream, visualize, and use live data in parametric design workflows.
Development Environment:
Firefly runs within Grasshopper, which itself is a plugin for Rhinoceros 3D. Once installed, it adds a new tab to the Grasshopper interface with components for hardware I/O, computer vision, and data visualization. It bridges physical computing and digital modeling environments seamlessly.
Strengths:
Enables real-time interaction between hardware (e.g., Arduino sensors) and 3D models
Simplifies data acquisition and control tasks without needing deep programming knowledge
Expands the potential of parametric modeling by integrating environmental inputs (light, sound, motion, etc.)
Challenges:
Hardware setup (e.g., correct drivers, baud rates) can be error-prone for beginners
Limited ongoing development and compatibility issues with newer versions of Rhino/Grasshopper
Performance may lag with high-frequency or complex data streams
Opinion & Conclusion:
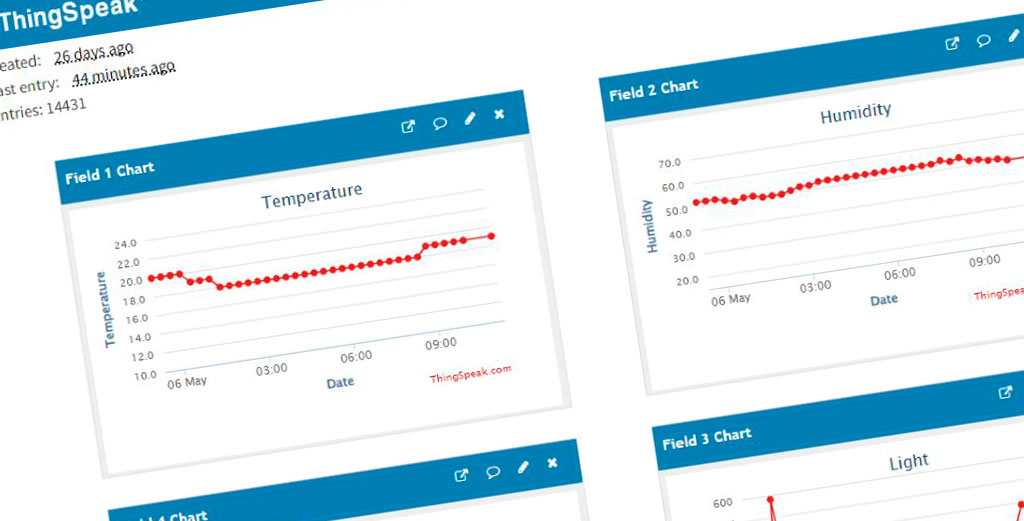
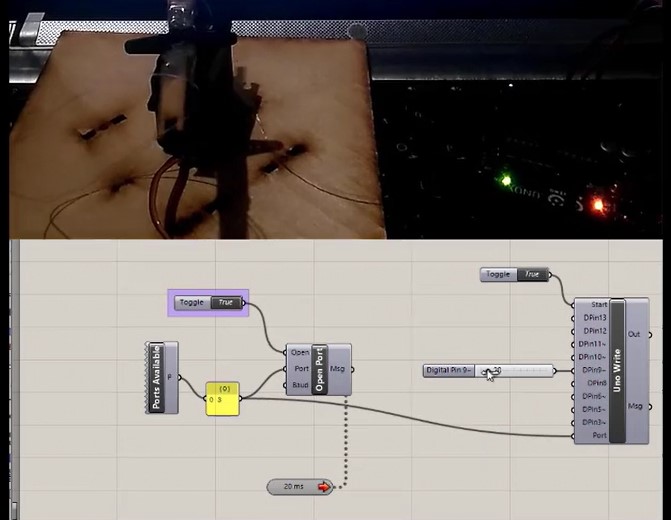
Using Firefly with Arduino inside Grasshopper made prototyping physical-digital systems very accessible. We connected a temperature sensor to an Arduino and streamed the values directly into Grasshopper to control a servo. The setup felt intuitive, and the feedback loop was immediate and visual, which is great for testing interactive electronics concepts or robotics environments.
With versions 7 and 8, the serial port reading procedure has changed, and it is necessary to prepare the environment to achieve proper functionality.
Sample: Firefly with Arduino Board_Control Servo from Nada Gamal on Vimeo.
Matlab
Overview:
MATLAB (Matrix Laboratory) is a high-level programming environment developed by MathWorks, primarily used for numerical computing, data analysis, algorithm development, and visualization. It’s widely adopted in engineering, science, finance, and academia due to its powerful built-in tools for mathematical modeling and simulation.
Development Environment:
MATLAB provides a dedicated IDE (Integrated Development Environment) that includes a script editor, command window, variable workspace, and extensive toolboxes. It supports matrix-based programming, allowing concise representation of complex mathematical operations. It also integrates with Simulink for graphical modeling of dynamic systems.
Strengths:
Excellent for matrix operations, data visualization, and engineering calculations
Thousands of built-in functions and toolboxes (e.g., signal processing, machine learning, control systems)
Highly readable syntax and strong documentation
Widely used in industry and research, making it a standard in many fields
Challenges:
Proprietary software with a high license cost (especially for advanced toolboxes)
Slower than some compiled languages for certain types of computation
Less suited for general-purpose programming compared to Python or C++
Opinion & Conclusion:
MATLAB’s interface and toolset feel very refined for technical computing. I created a script that analyzes accelerometer data from a CSV file and produces real-time plots of vibration patterns. With built-in plotting and matrix tools, the entire process from data import to visualization was seamless. MATLAB feels like a powerhouse for algorithm development and data-centric tasks, especially when working with signal processing or control systems.
*Octave: For those looking for a free and open-source alternative, there is GNU Octave, which is highly compatible with MATLAB. Octave can run most MATLAB scripts and functions with little or no modification, making it an excellent option for students or researchers without access to a commercial license. While its graphical interface is more basic, its core functionality is very similar, especially for numerical computations and data analysis.
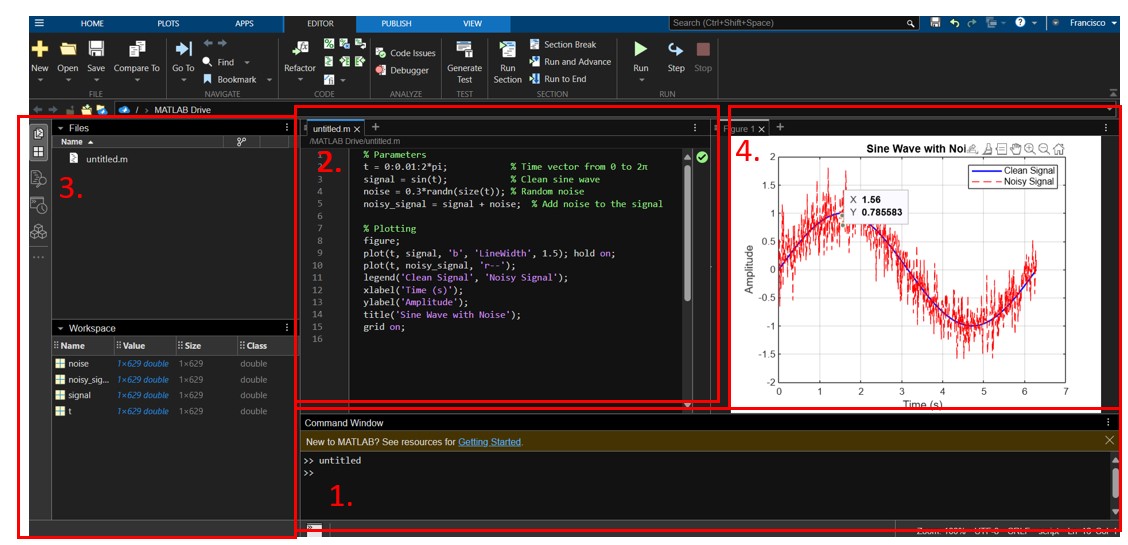
- Command Window
Location: Center or bottom of the interface
Purpose: Execute commands directly, test code, or evaluate functions
Example: You can type plot(x, y) and see the result immediately. - Editor (Script/Function Files)
Location: Top section or in tabs
Purpose: Write, save, and edit .m script files or functions
Example: Here, you can save the sine wave example code and run it using the "Run" button. - Workspace & Variables
Location: Right side of the interface
Purpose: View and manage variables currently in memory and their values
Example: After running the script, you'll see variables like t, signal, or noise displayed here. - Figure Window (Graphing Zone) 🖼️
Location: Opens in a separate window or a new tab within MATLAB
Purpose: Display graphs generated by commands like plot, imshow, surf, etc.
Example: When the script calls figure; plot(...), MATLAB opens a Figure Window where the clean and noisy sine wave is shown. You can move the window, save it as an image, or copy it into a document.