Week 09
Input devices
Group assignment
- Probe an Input Device's Analog Levels and Digital Signals.
For the group assignment, we tested the readings of a load cell. The load cell is connected to an HX711 amplifier, which converts the analog signal into a digital signal. We used an oscilloscope to perform the readings.
HX711 Signal Pattern Overview
The HX711 is a 24-bit analog-to-digital converter (ADC) commonly used for weighing scales and other precision measurement applications. It communicates via a two-wire interface (Clock and Data).
Signal Timing Pattern:
After applying power, the HX711 requires some time to stabilize (~100ms recommended).
And the Data is ready for use (DOUT):
The DOUT pin is initially HIGH.
When data is ready, the DOUT pin goes LOW, signaling the microcontroller to read data.
Data Transfer Sequence
The microcontroller sends 25 to 27 clock pulses to shift out the 24-bit data.
The MSB (most significant bit) is sent first.
The number of pulses (25, 26, or 27) determines the gain settings (Channel A gain 128/64 or Channel B gain 32).
This is an example of a waveform:
When the HX711 has new data available, the DOUT line transitions from HIGH to LOW.
The microcontroller must detect this transition to start reading the data.
DOUT: _________|‾‾‾‾‾‾‾‾‾‾‾‾‾‾‾‾‾‾‾‾‾‾|________
(Data ready)
This is the signal example
CLK: __|‾|__|‾|__|‾|__|‾|__|‾|__|‾|__|‾|__|‾|__|‾|__|‾|__|‾|__|‾|__|‾|__|‾|__
DOUT: X--MSB-------------------------------------LSB--X (24 bits)
MSB (Most Significant Bit) first.
24 clock pulses are required to shift out the 24-bit data.
1 to 3 additional pulses are used to set gain and channel selection:
25 pulses → Channel A, gain 128
26 pulses → Channel B, gain 32
27 pulses → Channel A, gain 64
Reading the Analog Signal from the Load Cell
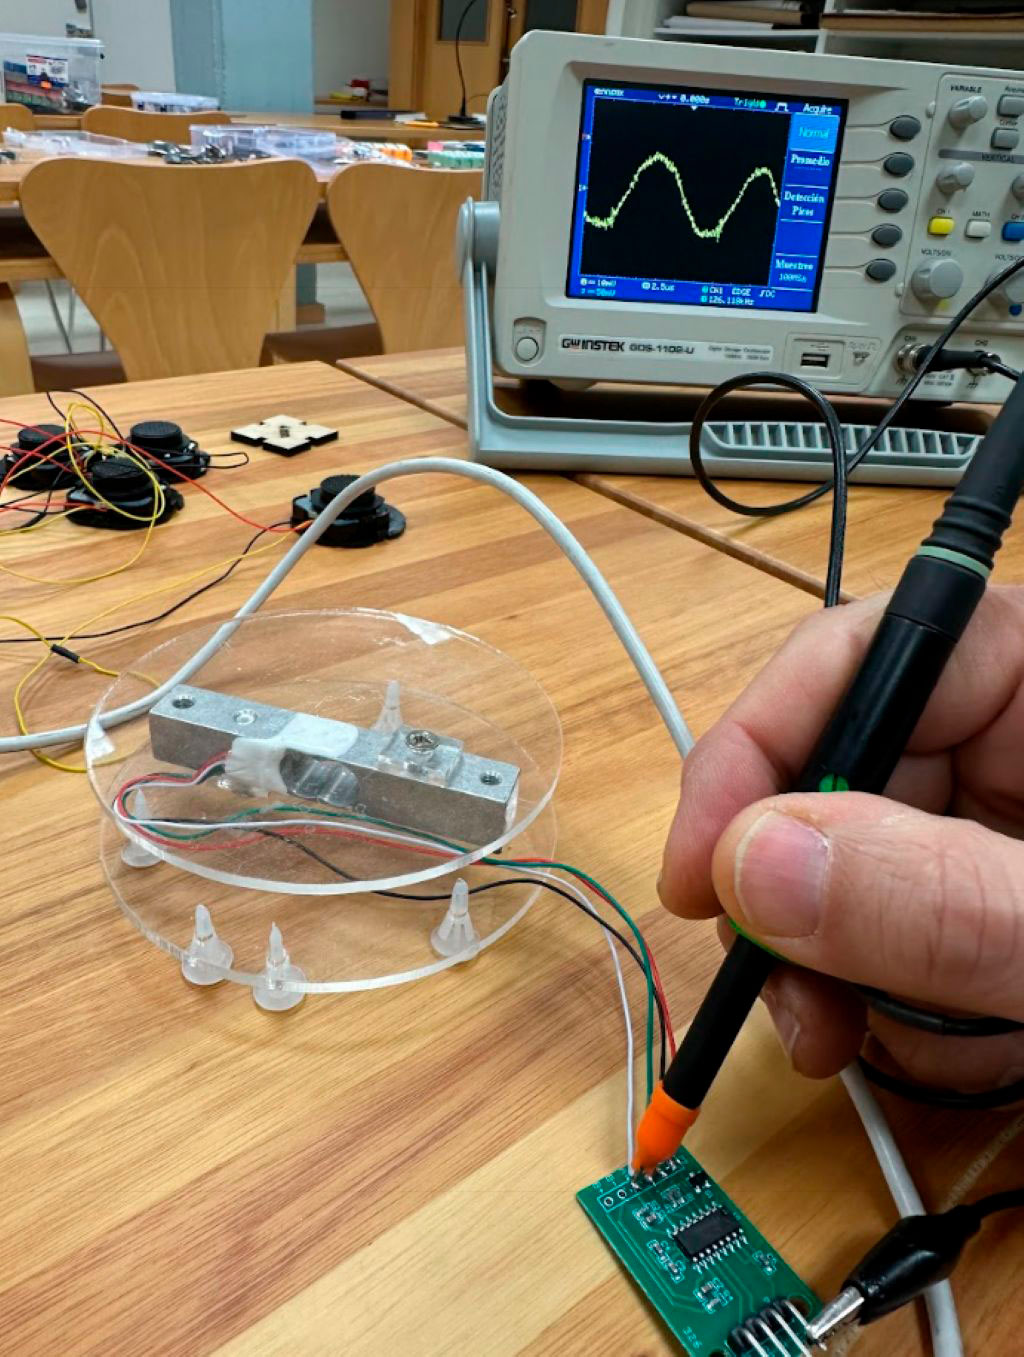
· Connected the oscilloscope probe to A+.
· Connected GND to A-.
· Observed a very low analog signal in millivolts on the oscilloscope that varied with the load.
· Set the initial adjustment scale between 5 mV/div and 50 mV/div.
Initially, we performed the reading with a beam-type load cell, placing the probe on A+ and the oscilloscope's GND to the HX711's GND.
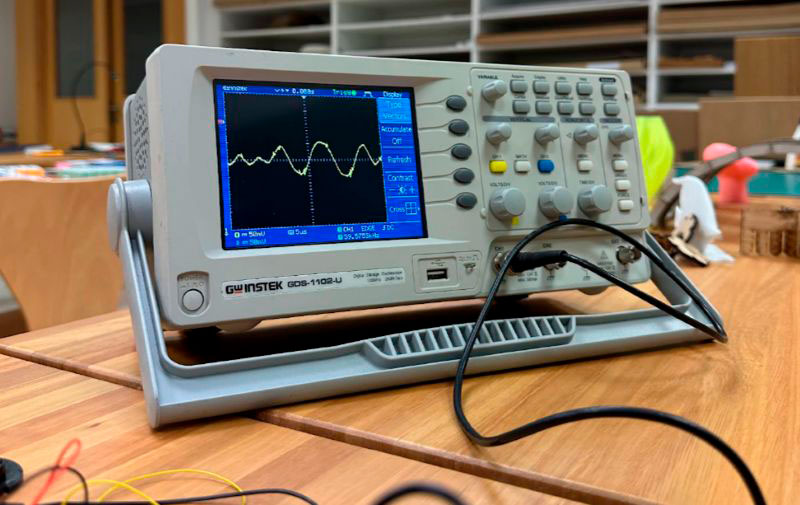
Next, we tested the analog output of the HX711 connected to a platform-type load cell configured with a Wheatstone bridge.
Reading the Digital Signal Sent by the HX711 to the MCU
Currently we only have one probe for the oscilloscope, which limits or ability to compare the CLK and Data signals simultaneously. A new oscilloscope is expected to arrive in the coming weeks.
First, to compare both signals we have to take the a snapshot of this one:
· Connected the oscilloscope probe to the Data pin of the HX711.
· Connected the oscilloscope ground to the GND of the HX711.
Then, we take another snapshot of this signal:
· Connected the oscilloscope probe to the CLK pin of the HX711.
· Connected the oscilloscope ground to the GND of the HX711.
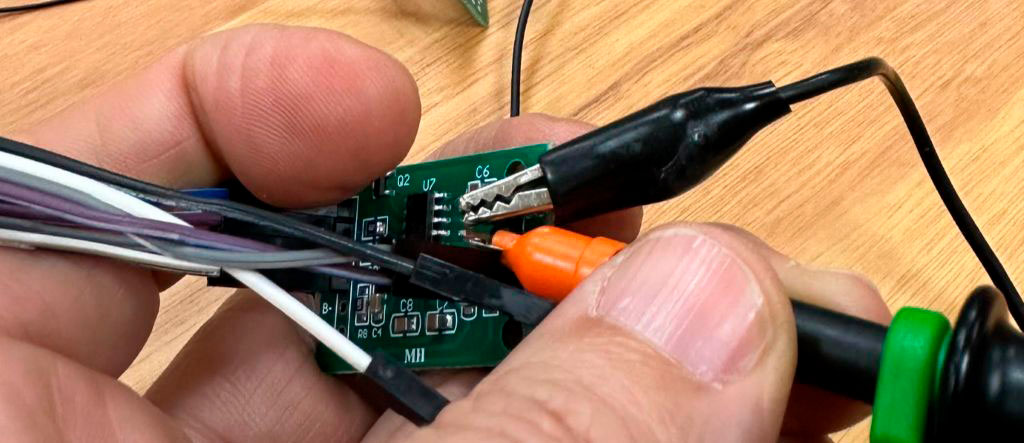
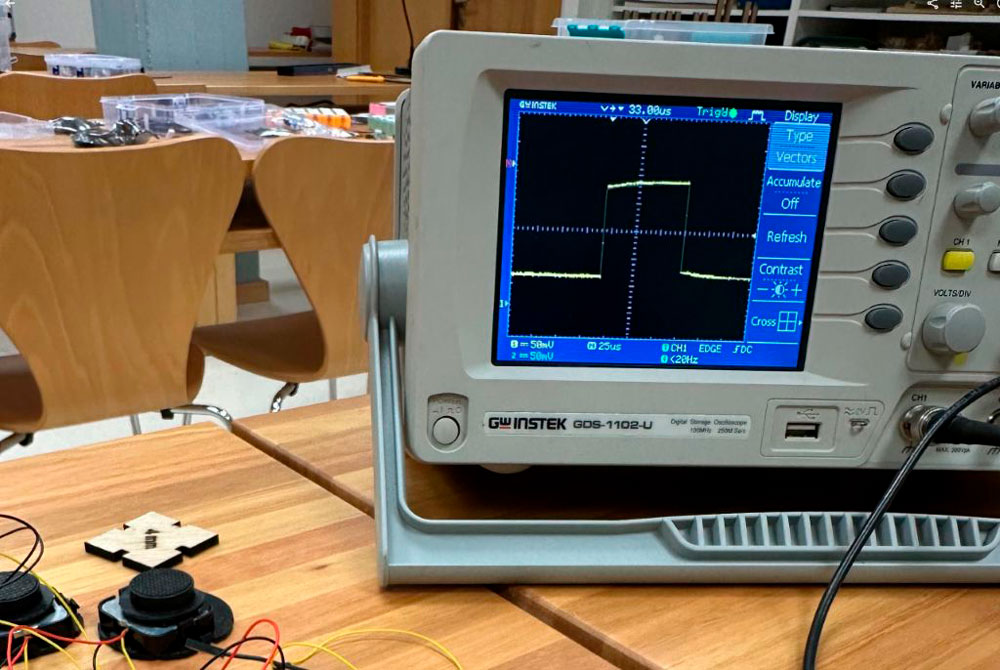
We adjusted the time base to 25μs/div. Subsequently, we fine-tuned the oscilloscope settings to optimize the waveform display on the screen.
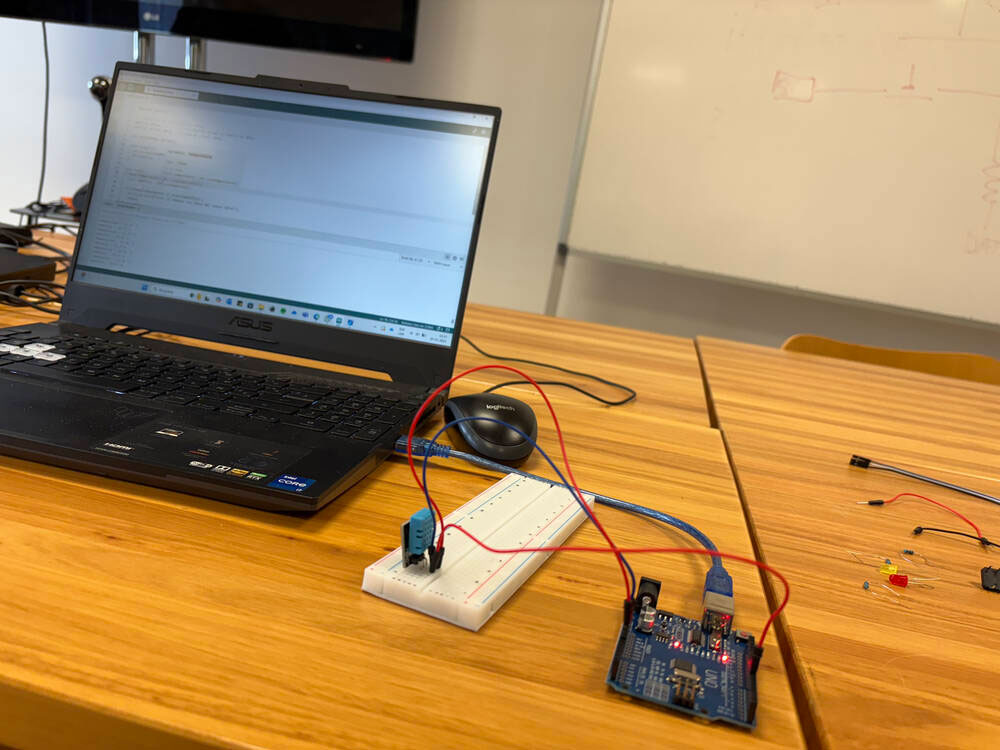
Humidity sensor DHT11
How to see the signal ?
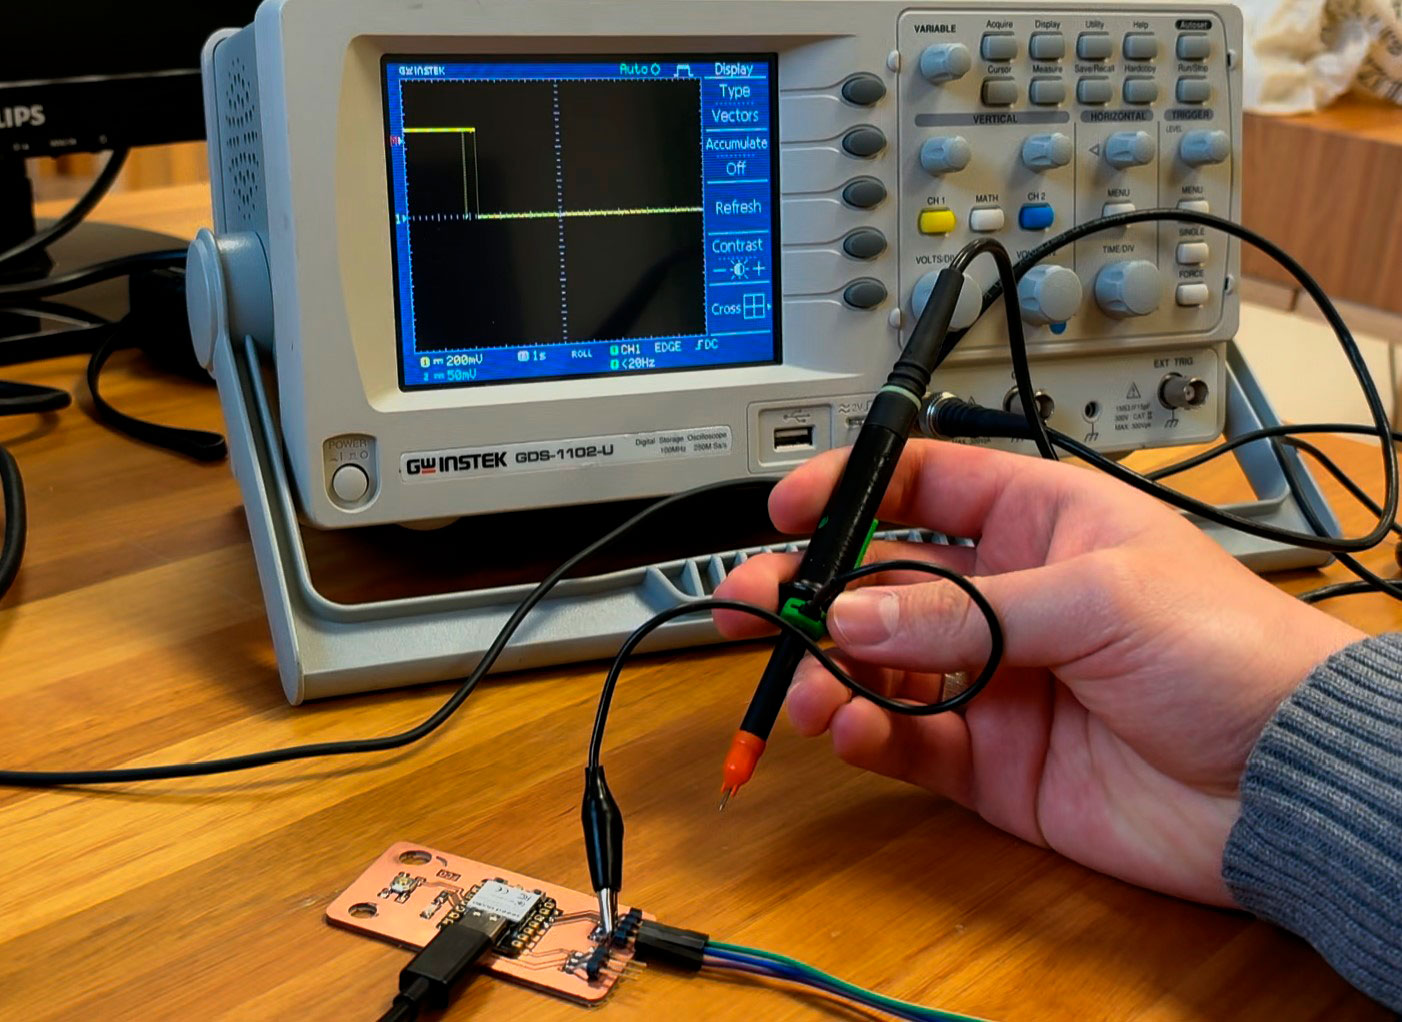
🔌 Oscilloscope Connection
The oscilloscope probe has two key components:
✅ Probe tip → Captures the
signal.
✅ Black cable (ground clip) → Establishes the electrical reference point (GND).
📋 Steps to Connect the Oscilloscope to the System
1. Connect the black cable (ground clip)
· Attach it to the GND pin of the XIAO ESP32C3 (you can use any GND pin on the microcontroller).
· This is crucial for the oscilloscope to have the same voltage reference as the circuit.
2. Connect the probe tip
· Connect it directly to the data pin of the DHT11 (the pin where the sensor sends its digital signal).
· If your probe has a switch to select between x1 and x10, use x10 to minimize circuit loading and improve accuracy.
3. >Oscilloscope Configuration
· Voltage per division: 2V/div (adjust according to the signal amplitude).
· Time per division: Start with 500 µs/div and adjust based on the pulse duration.
· Trigger settings:
o Mode: EDGE
o Source: CH1
o Trigger level: ~2V to capture signal transitions.
4.
Observe the Signal
You should see a series of digital pulses representing the DHT11 communication.
🧪 Tip for Identifying the DHT11 Signal
· The first long pulse (18 ms) is the microcontroller's start signal.
· Afterward, you will observe short pulses (~26 µs for "0") and long pulses (~70 µs for "1").
What does the signal mean?
📊 Interpreting the DHT11
Digital Signal on the GDS-1102-U Oscilloscope
The DHT11 sends data in a specific sequence of digital pulses that you can observe as a series of spikes on the oscilloscope. Here's how to recognize and decode that signal.
🔎 DHT11 Signal Pattern
The signal consists of 5 data blocks organized as follows:
| Start Signal | Humidity Integer | Humidity Decimal | Temp. Integer | Temp. Decimal | Checksum |
🛠️ Step 1: Identifying the
Start Signal
The XIAO ESP32C3 sends a low pulse (~18 ms)
to indicate it is ready to receive data.
The DHT11 responds with:
· Low pulse (~80 µs)
· High pulse (~80 µs)
🖥️ On the oscilloscope: This appears as a long dip followed by a short peak.
🛠️ Step 2: Identifying Data
Bits
The DHT11 uses a pulse-width encoding
protocol:
· Bit "0" → High pulse of 26-28 µs
· Bit "1" → High pulse of 70 µs
✅ Each data block contains 8 bits.
🛠️ Step 3: Decoding the Data
· Observe the first block after the start signal.
· Each sequence of 8 pulses represents one byte.
· Count the long pulses (bits "1") and short pulses (bits "0") to translate each block into binary.
🔢 Step 4: Interpreting the Data
· First block → Humidity integer (e.g., 00110100 = 52%)
· Second block → Humidity decimal (usually 00000000 in the DHT11)
· Third block → Temperature integer (e.g., 00111001 = 57°C)
· Fourth block → Temperature decimal (usually 00000000)
· Fifth block → Checksum (sum of the previous 4 blocks; verifies data integrity).
📋 Expected Visual Example on the Oscilloscope
|______|‾‾‾‾‾‾|_____|‾‾‾‾‾‾|_|‾|_|__|‾‾‾|_|__|‾‾‾|_
Start 0 1 0 1 1 0
0 1 0
In this example:
· Short pulses → 0
· Long pulses → 1
· Result → 01011001 → 89 in decimal
🚨 Tip for Easier Reading on the GDS-1102-U
· Use the pulse width measurement feature to distinguish between bits "0" and "1".
· If your oscilloscope has a zoom function, use it to enlarge the section of the signal displaying the data.
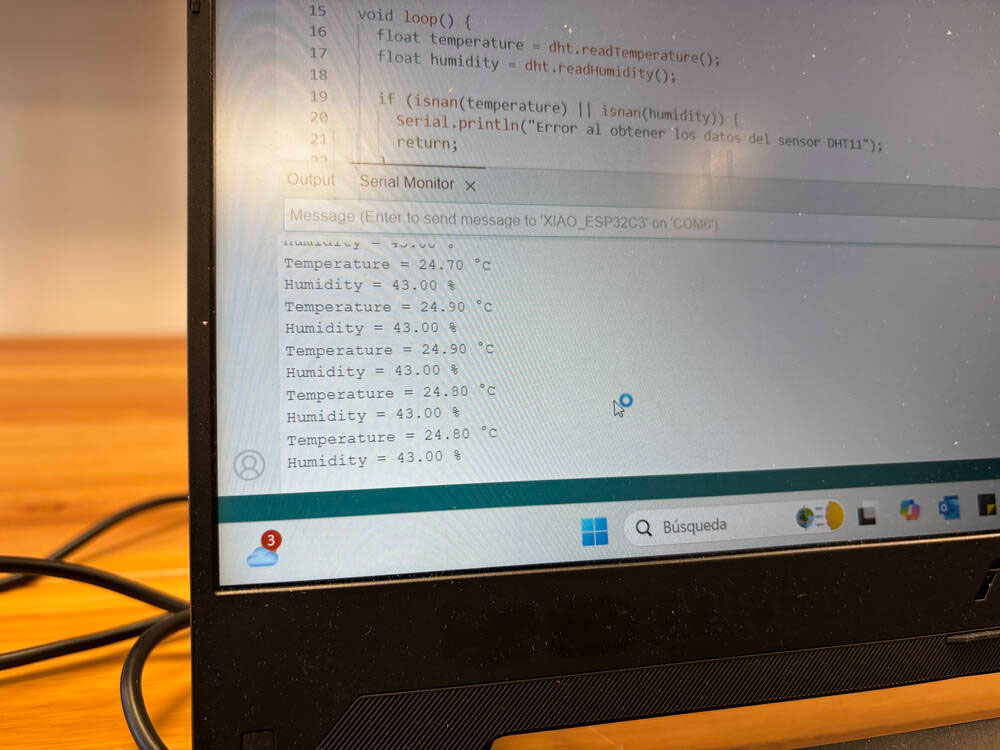
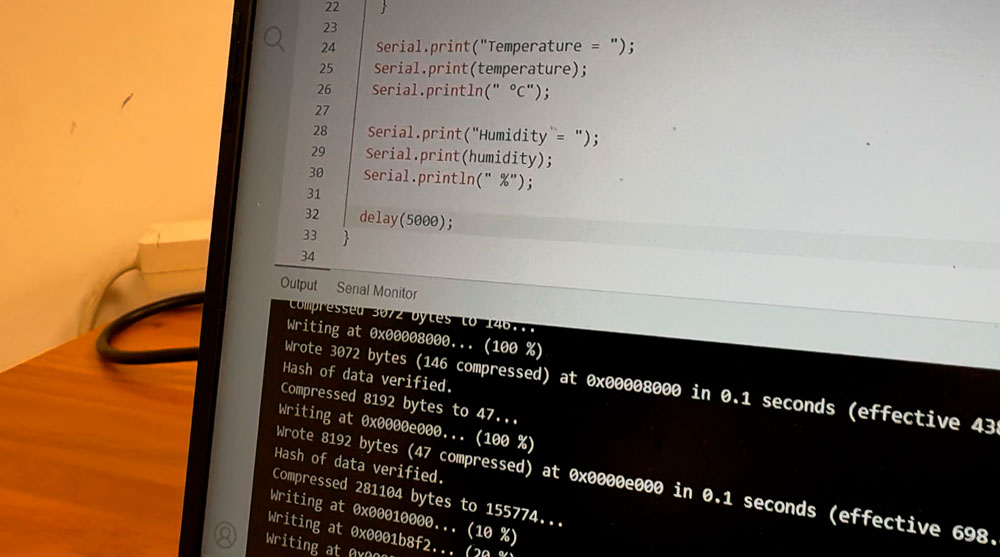
The easiest way for me to test if the oscilloscope was working well, was changing the delay in the code: delay(5000), this means that the pulse will be given between 5000 milliseconds = 5 seconds. The DHT11 to have reliable data they recommend less than 1 second. But for this exercise it worked well.
First with a delay of 100 miliseconds.
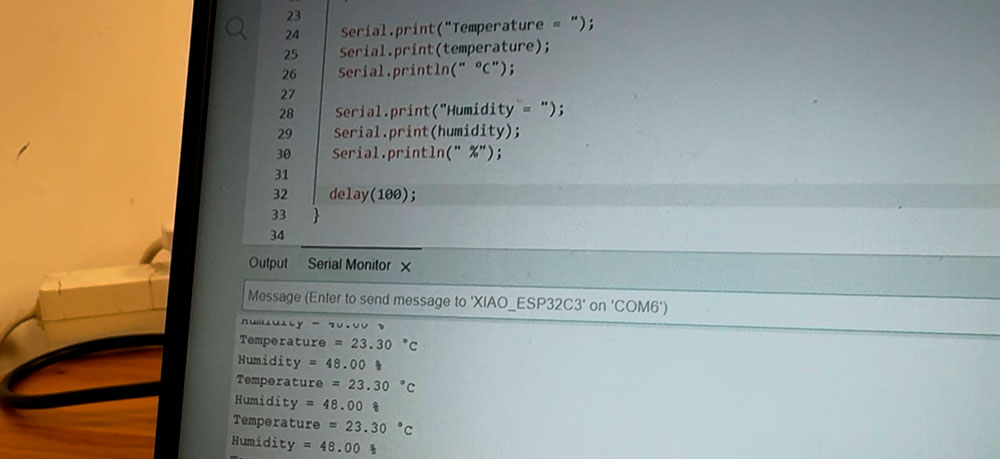
In the oscilloscope we saw the following
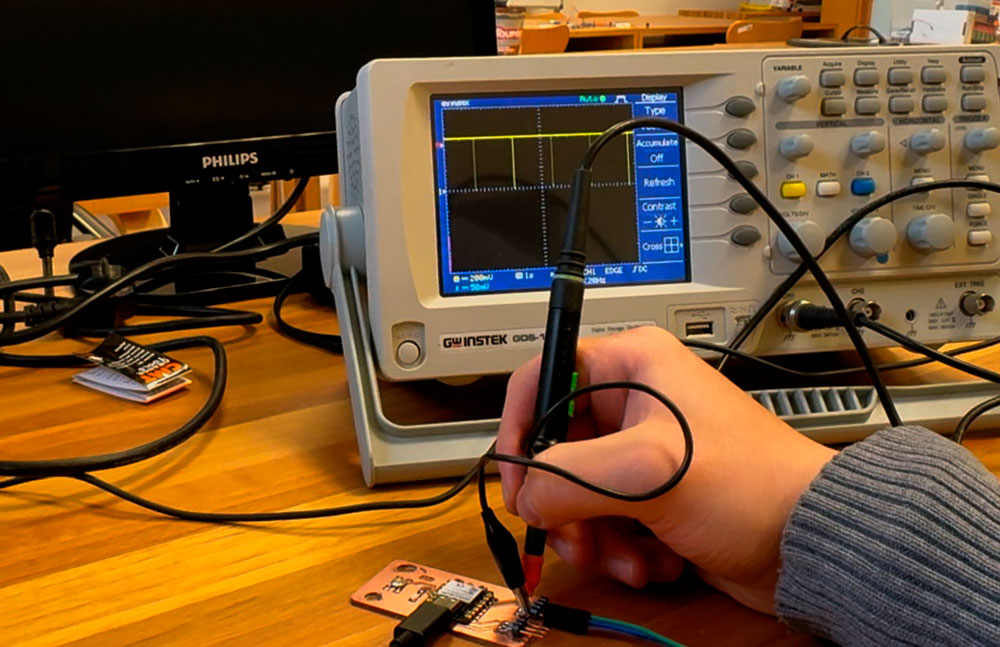
Now if we delay the signal to 5000
And we saw the following in the oscilloscope
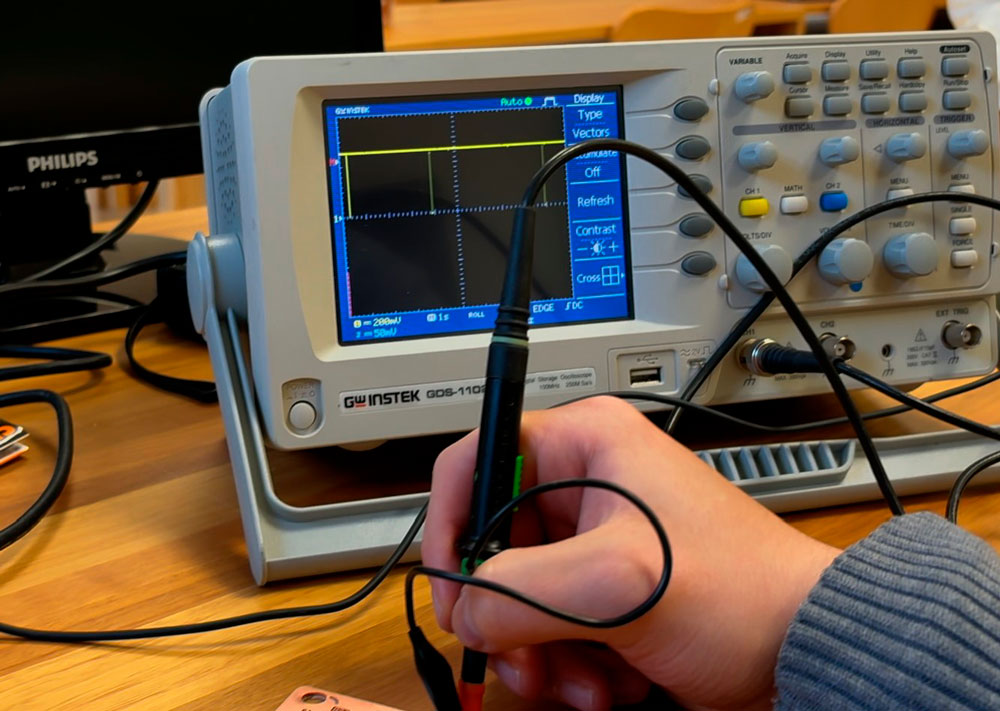
If we zoom one signal we see the following
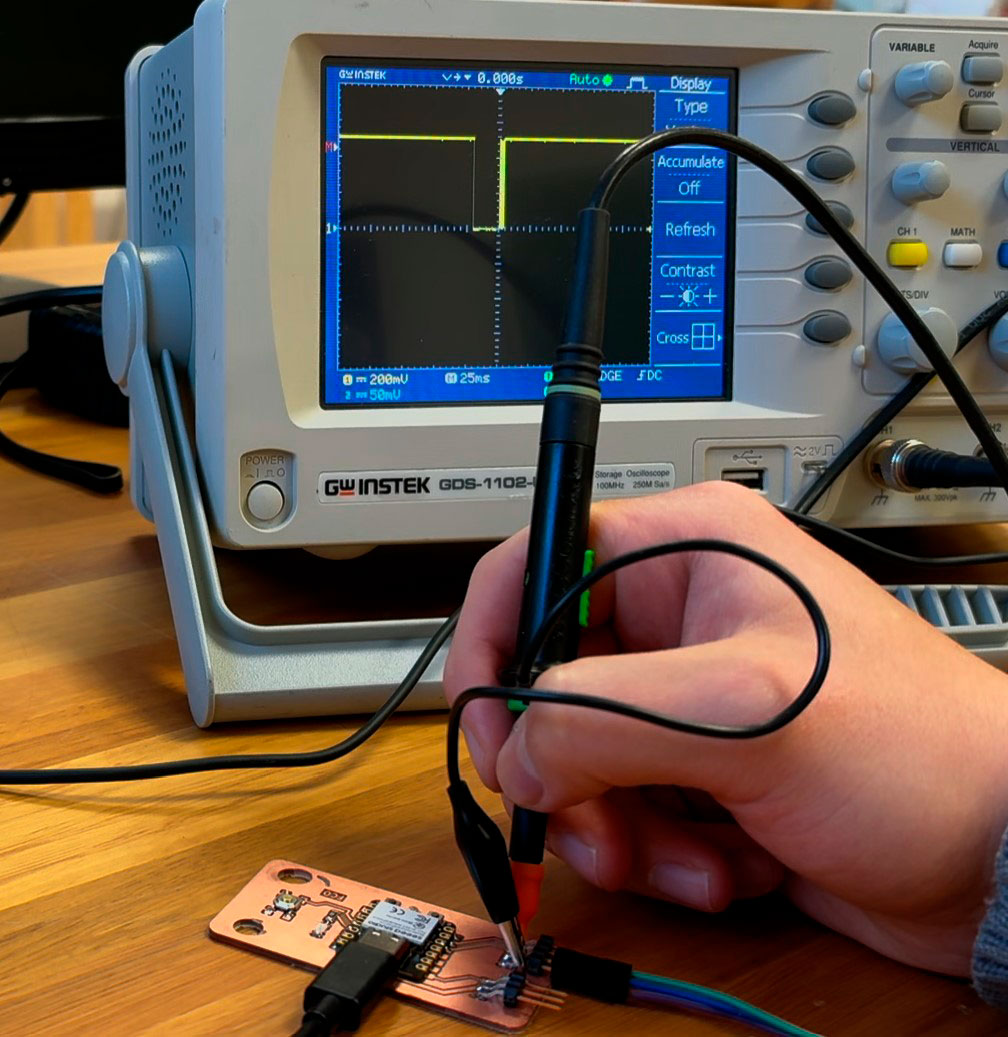
Finally, if we take the probe off the pin we can see a constant line
