Week 06
Electronics Design
Group assignment
- use the test equipment in your lab to observe the operation of a microcontroller circuit board.
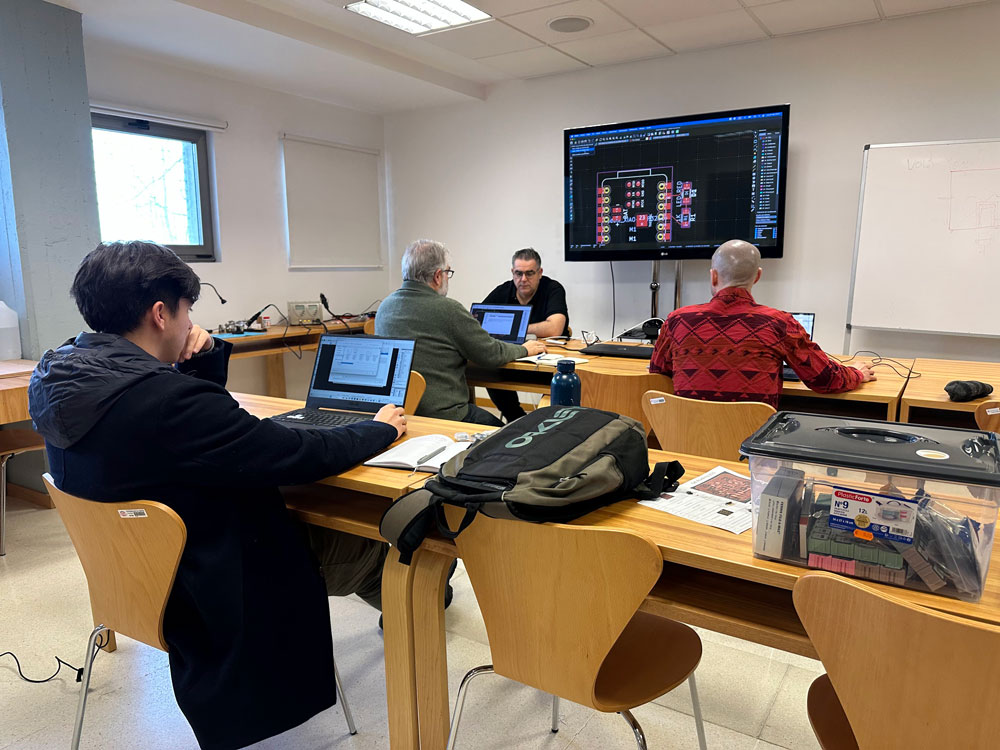
On Thursday 27th, the three of us gathered to understand the operation of the test equipment available in our manufacturing space. Our instructor, Luis, guided us in the morning, and in the afternoon, we performed additional tests.
MULTIMETER TESTING
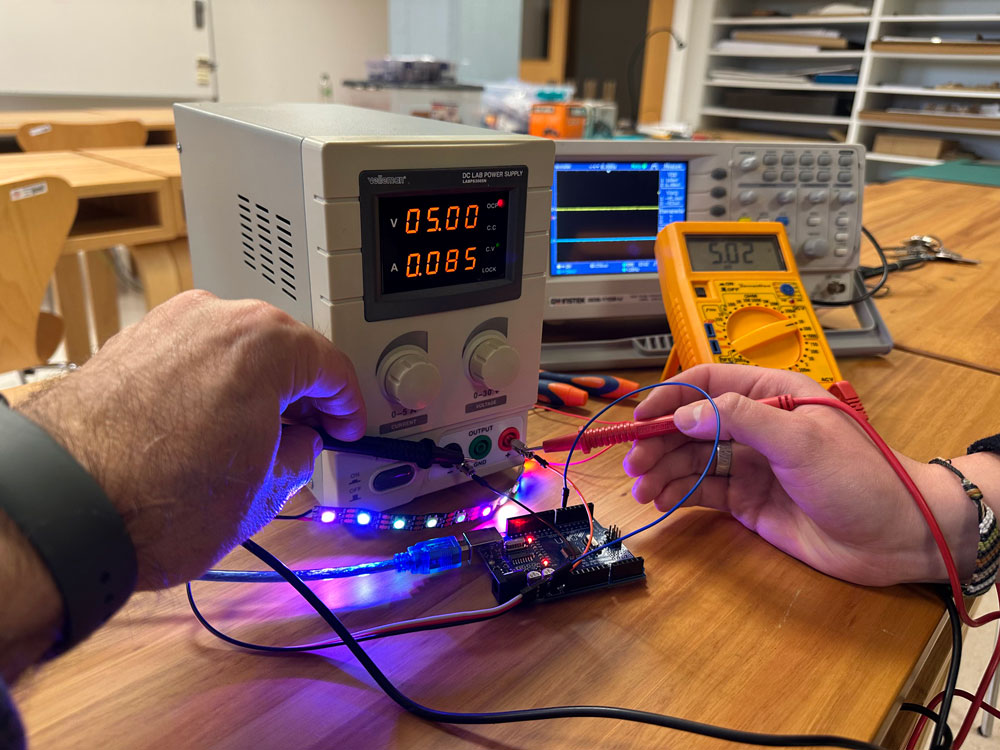
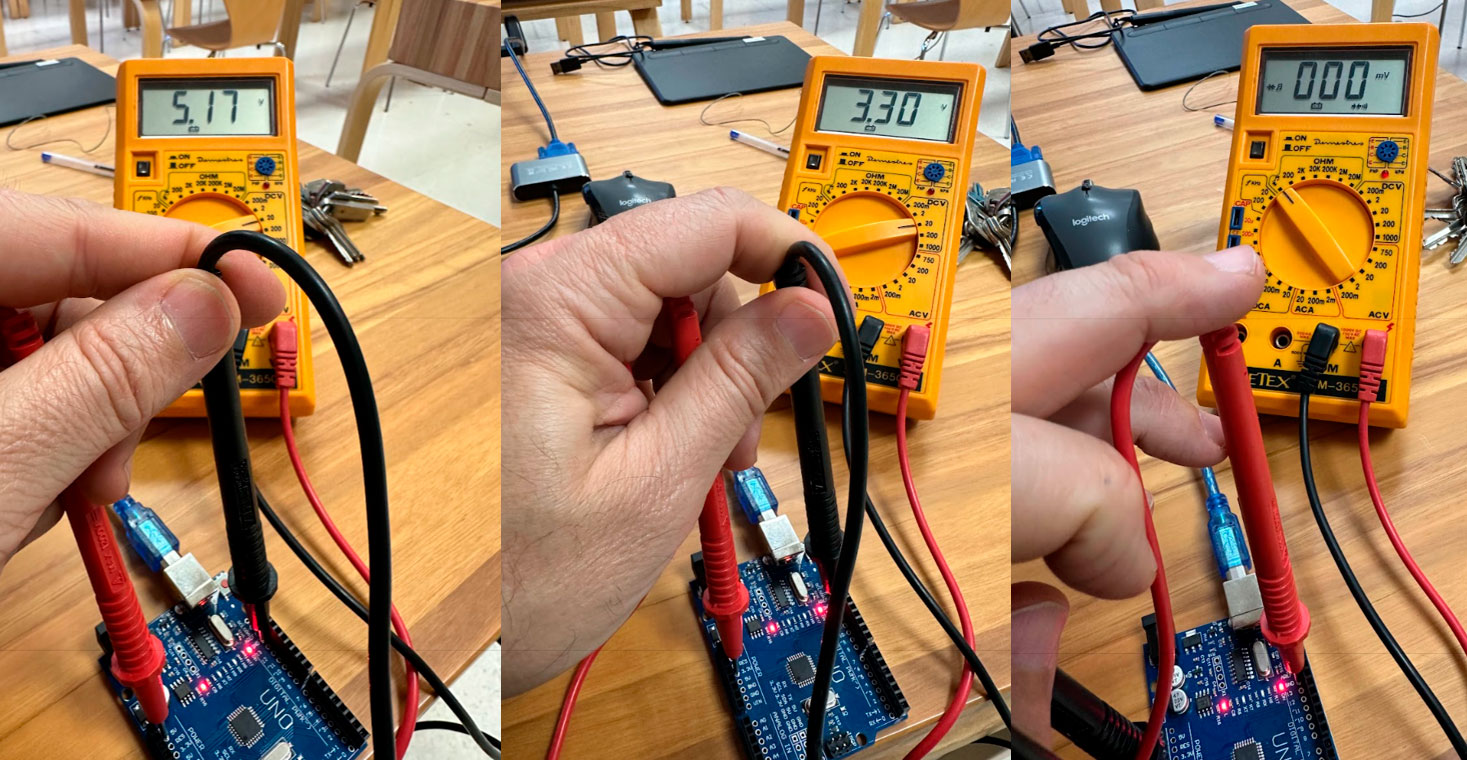
First, we worked with the multimeter, verifying the 5V and 3.3V pins as shown in the pictures. We also activated the mode that allows checking circuit continuity. The buzzer indicator is triggered when the conductance is below approximately 30 Ohms, accompanied by the LED lighting up and the beeper sounding.
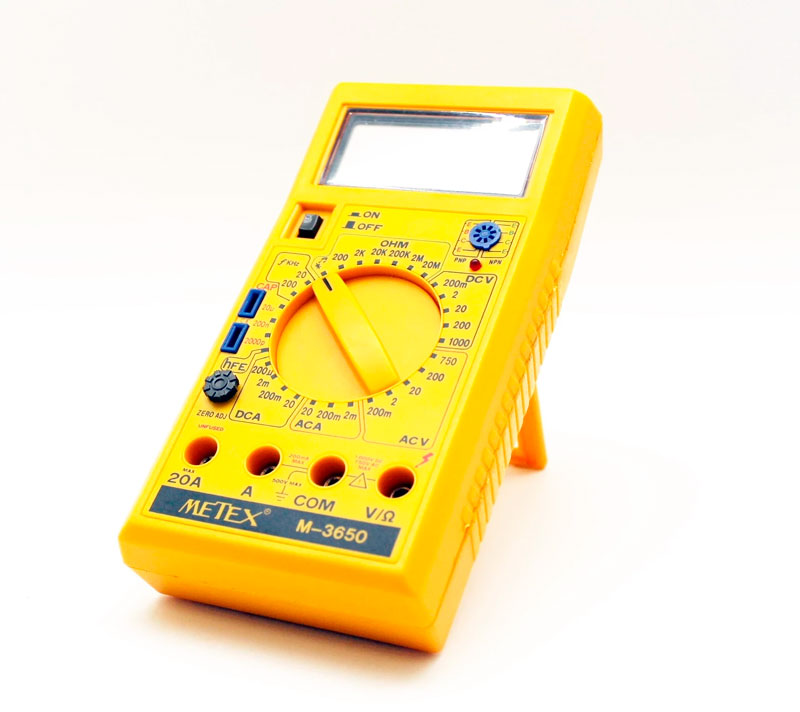
METEX M-3650
Using the Arduino IDE, we sent a blinking signal to pin 0 of our Arduino Uno and verified the changes in the signal from HIGH to LOW. Code:
int ledR = 0; // LED RED |
The multimeter allows us to measure electronic components such as resistors, capacitors, transistors, diodes, LEDs, etc.
We can consult the multimeter manual from this link.
OSCILLOSCOPE TESTING
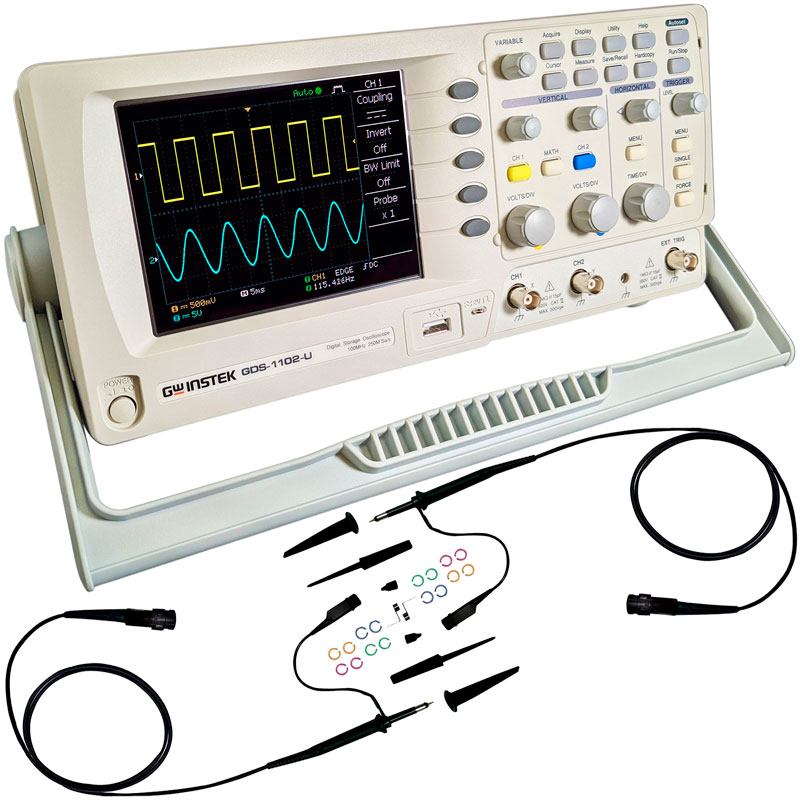
OSCILLOSCOPE GDS-1102-U
Next, we tested the oscilloscope, a device that allows us to visualize what happens in our circuits over a given time range at different points. The oscilloscope detects and displays voltage variations over time on its screen. The signals appear in a graph where the horizontal axis represents time, and the vertical axis represents voltage measurement.
We can adjust the horizontal and vertical position of the waveform, modify the Volts/div scale, and set the Trigger level. The Autoset button always allows us to restore default values for optimal screen visualization.
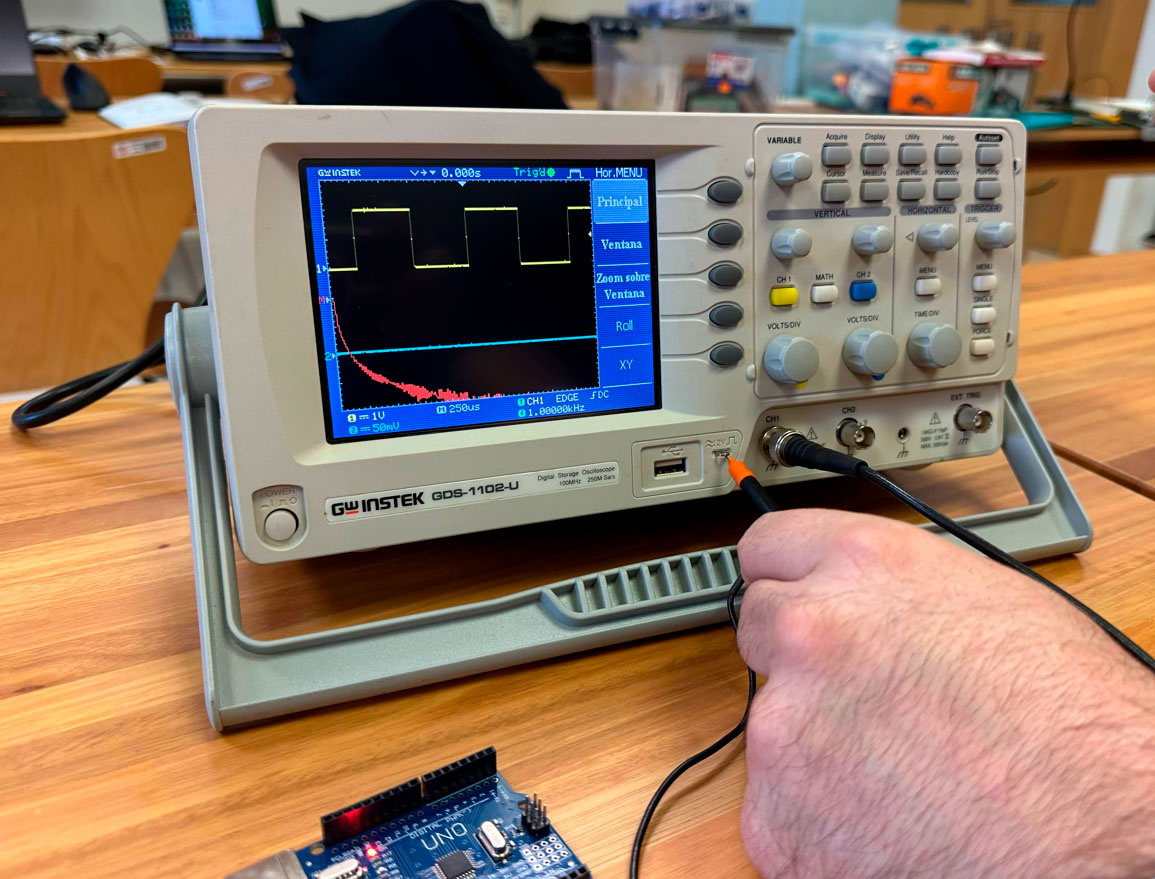
First, we tested how to connect a signal and adjust its scale. To do this, we connected the probe to channel 1 input and the probe compensation output. This output provides a 2Vp-p, 1kHz square wave for default signal compensation. We pressed the Autoset key, and a square aveform appeared at the center of the screen.
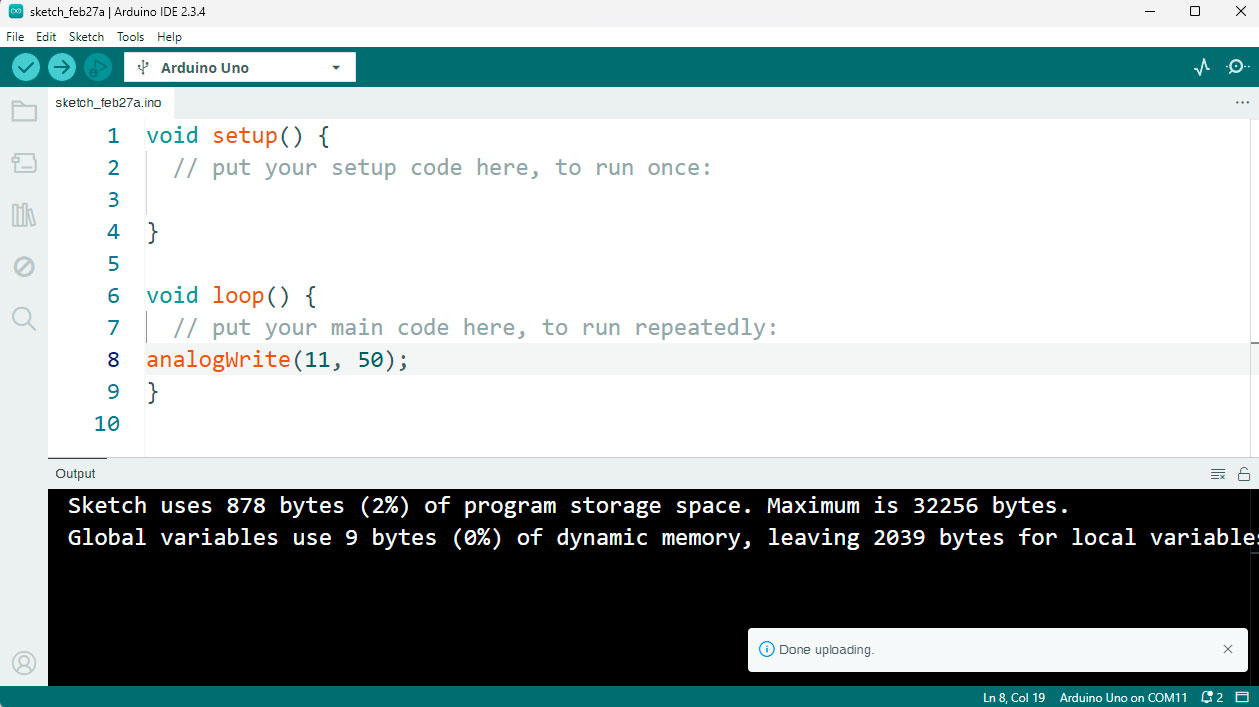
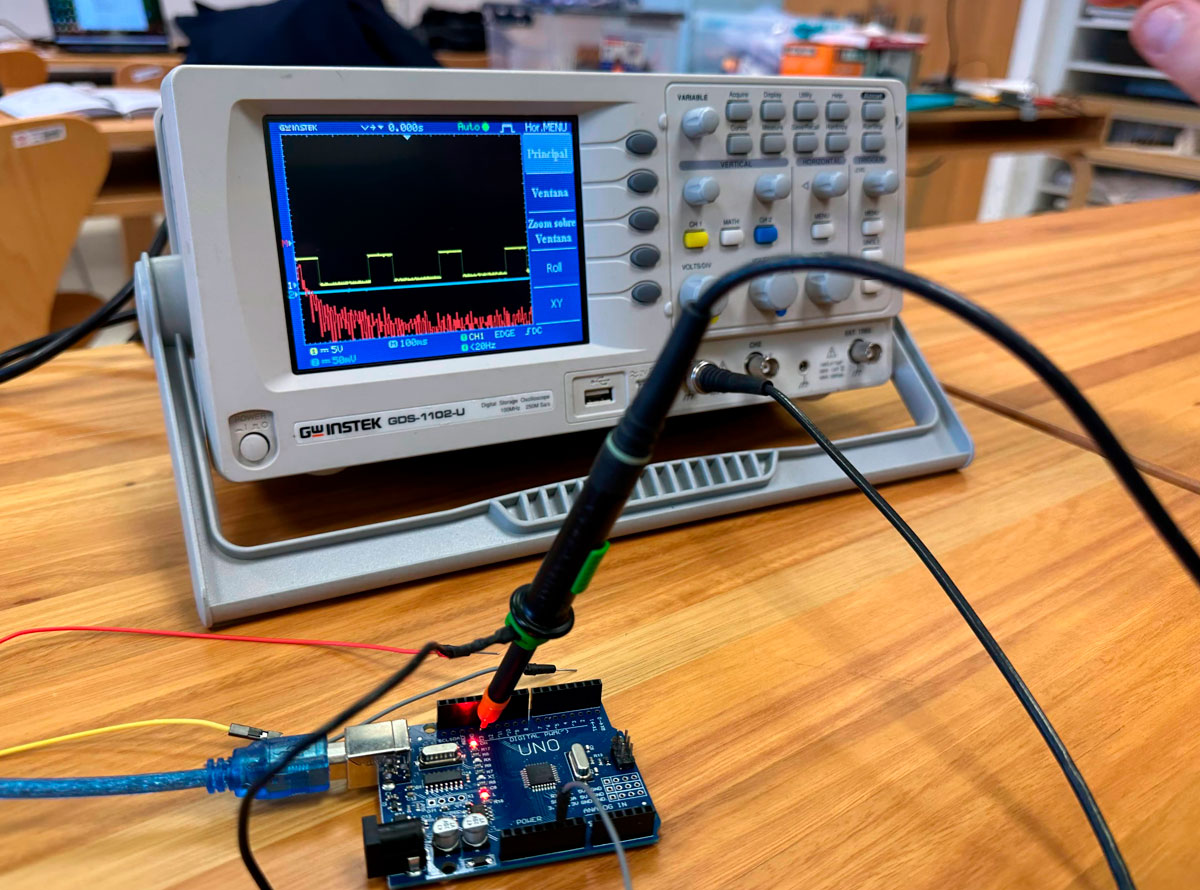
Following Luis’ advice, we uploaded a program to the Arduino Uno that sends a PWM signal to pin 11 using analogWrite(11, 50).
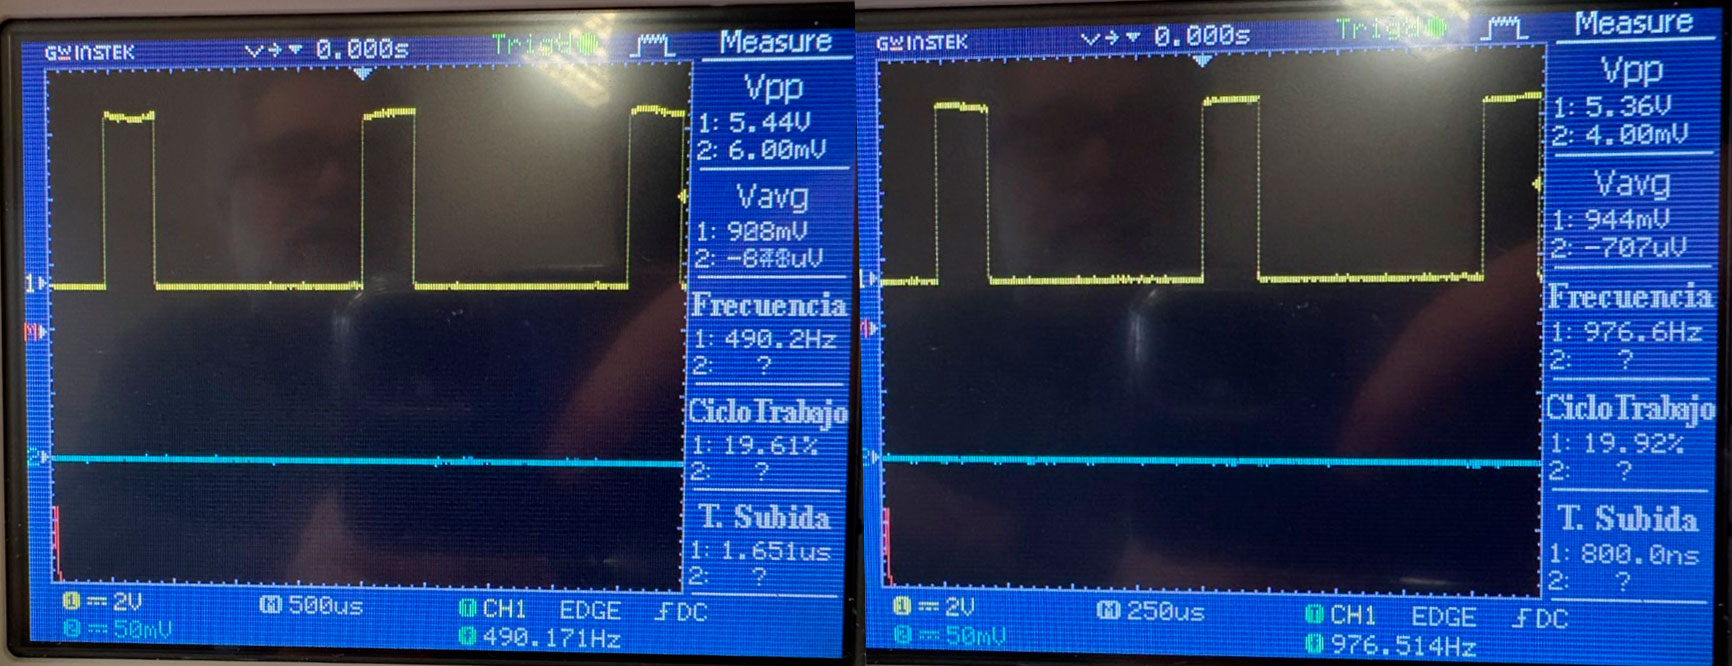
We sent three values (50, 150, and 200) to observe the PWM changes: the voltaje was 5V and frecuency 490,17 Hz in the pin 11 and 976,514 Hz in the pins 5 and 6.
POWER SUPLY DC LAB TESTING
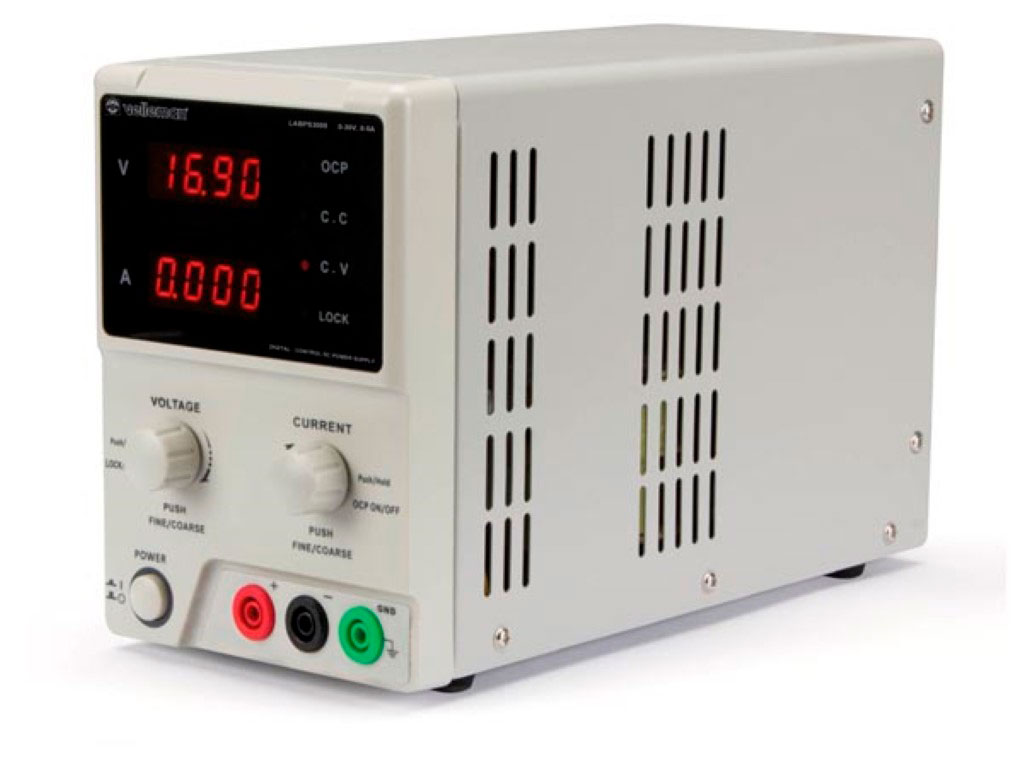
POWER SUPPLY LABPS3005N
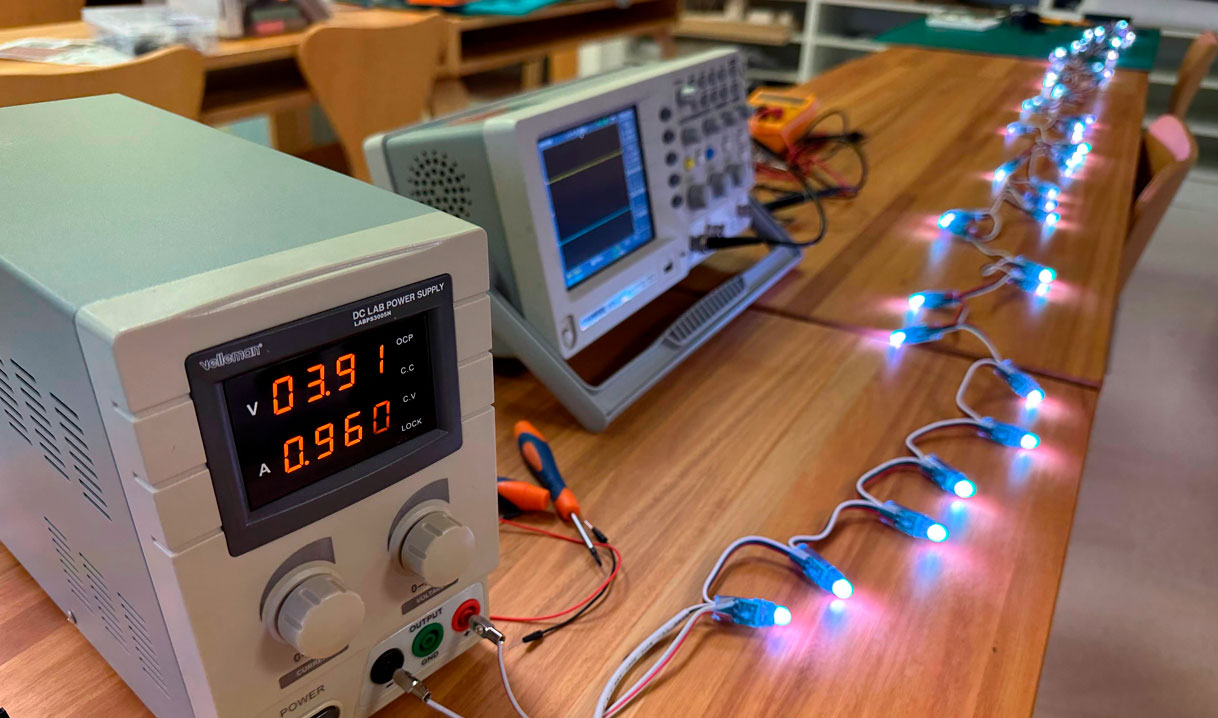
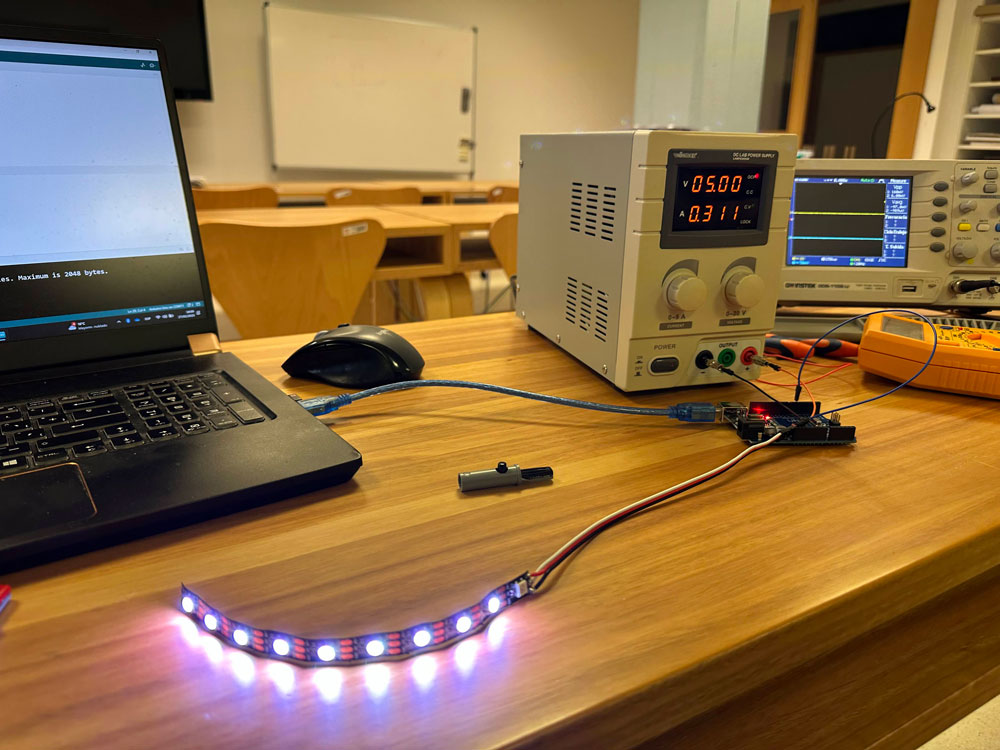
We then tested a power supply by powering a 10-LED strip.
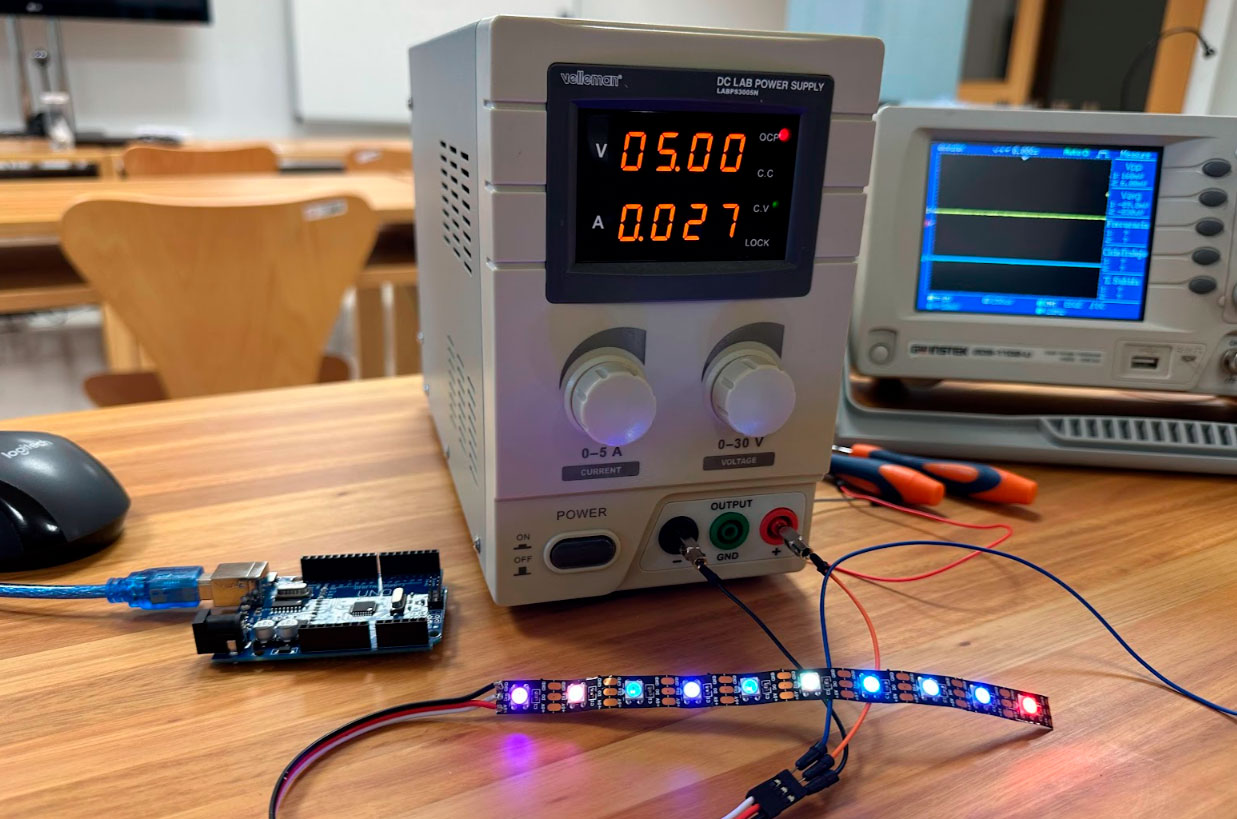
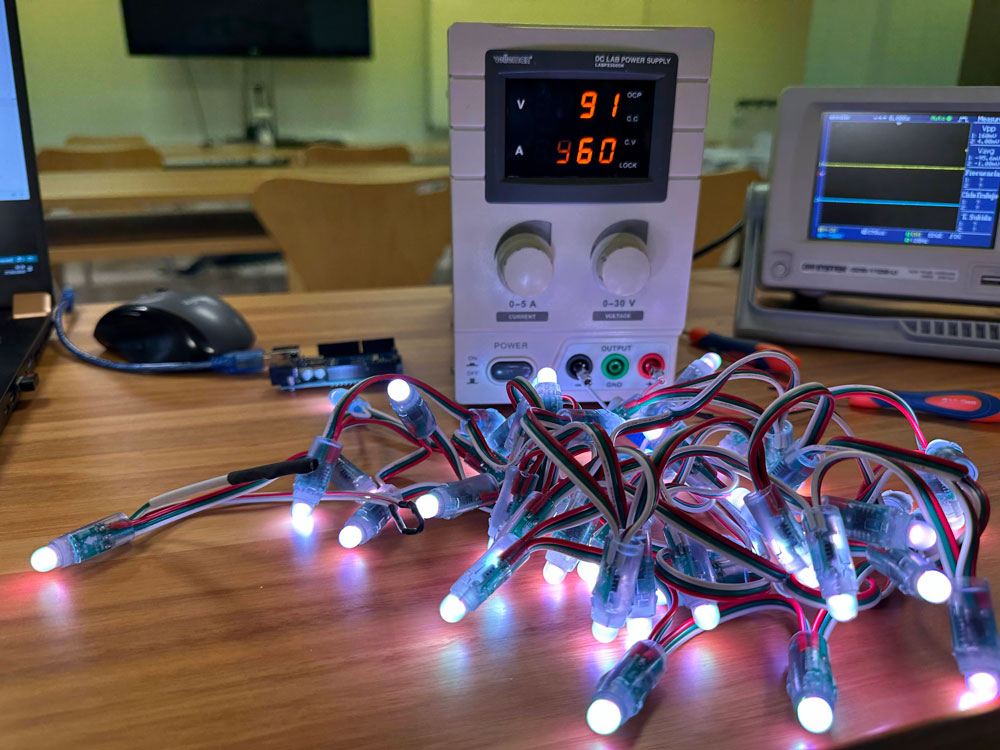
Finally, we connected the LEDs that Pepe will use in his final project to measure their power consumption. The power supply delivered 5V. As shown in the picture, when the LED strip was connected, the voltage dropped to 3.91V and 0.96A.
