15. Interface and application programming
Hero Shot
Assignment Overview
Group Assignment:
- Compare as many tools option as posible.
Here is a group assignment link
The group assignment link has also been embedded to my page below.
Now it’s time for the personal assignment.
Individual Assignment.
- Write an application that interfaces a user with an input &/or output device that you made.
Group Assignment:
For the group Assignment we looked at different user Interface such as;
After going through different tutorials I got interested in processing.
Individual Assignment:
The Individual assignment for this week was to write an application that interfaces a user with an input &/or output device that I made from previous weeks. I decided to create an interface for the moisture reading that I used in the previous week.
Below is the the work flow of the assignment.
Workflow
-
Select the UI you are interested to learn.
-
Program the UI.
-
Test the connected UI.
-
Debug where necessary.
1. Select the UI that you intend to use and learn about it:
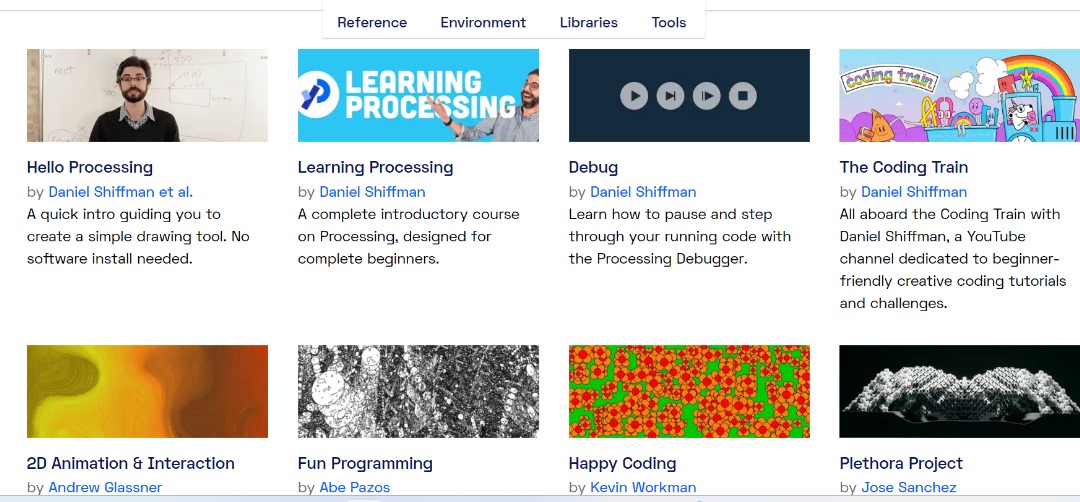
The UI that I selected for this assignment is called Processing.

Processing is an open-source programming language and integrated development environment (IDE) specifically designed for artists, designers, and beginners who want to create interactive graphics, animations, and visualizations.
Processing is an application written in C and that interfaces very well and easily with Arduino IDE. Since Iam very familiar with Arduino that is why I decided to choose Processing.
So, I started by learning how to use processing. To do this I watched a number of Tutorials.
Below are a number of tutorials to watch.
Here is also another good one to watch
You can download processing here
Now after understanding how to use and create an Interface using processing the next step is to understand how to create communiction between Processing IDE and Arduino IDE.
Here is a video to watch
Program the UI:
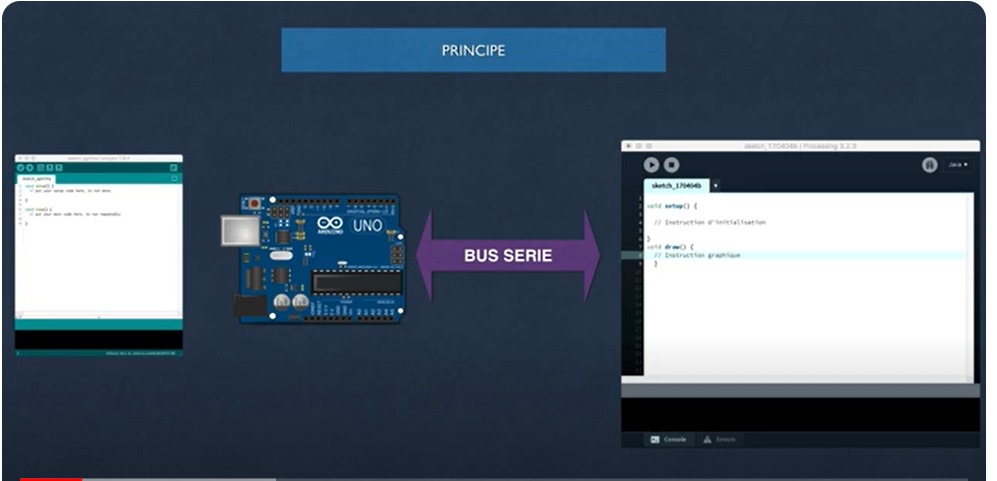
So, as I mentioned earlier, the goal here is to visualize the moisture content in a graphical form.
Here’s basic outline of the steps to follow.
- We need XIAO ESP32 C3 board.
-
We need a moisture sensor.
-
Power source(in my case a USB to connect to the computer).
Software
-
Arduino IDE(for programming the ESP32 C3)
-
Processing IDE (for creating the graphical display)
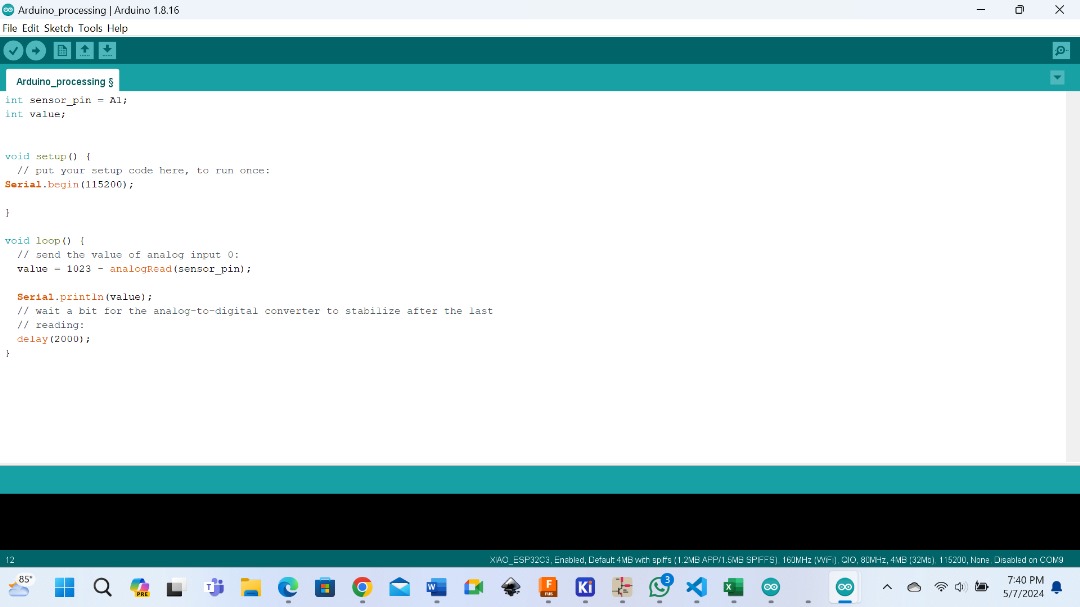
Programming Arduino IDE:
-
Connect the moisture sensor to the Arduino ESP32 C3 board.
-
Write an Arduino Sketch to read the moisture sensor data and send it to the processing IDE via serial communication.
Below is the Arduino code I have used.
int sensor_pin = A1;
int value;


void setup() {
  // put your setup code here, to run once:
Serial.begin(115200);

}

void loop() {
  // send the value of analog input 0:
  value = 1023 - analogRead(sensor_pin);

  Serial.println(value);
  // wait a bit for the analog-to-digital converter to stabilize after the last
  // reading:
  delay(2000);
}
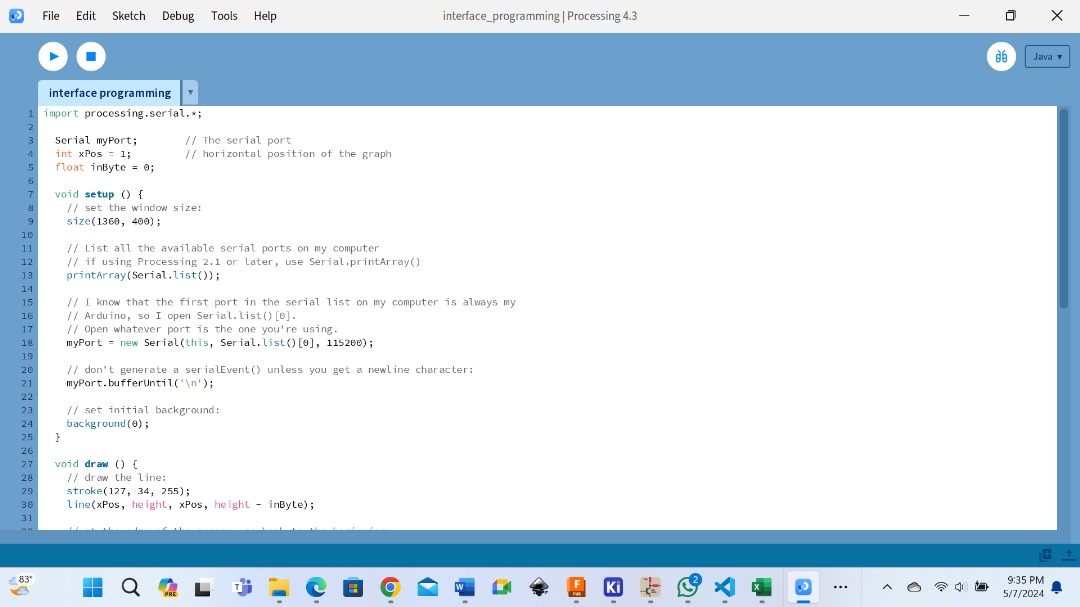
Programming Processing IDE:
This is a Processing sketch that reads data from an Arduino board and displays it as a graph.
Below is the code I used.

import processing.serial.*;

  Serial myPort;        // The serial port
  int xPos = 1;         // horizontal position of the graph
  float inByte = 0;

  void setup () {
    // set the window size:
    size(1360, 400);

    // List all the available serial ports on my computer
    // if using Processing 2.1 or later, use Serial.printArray()
    printArray(Serial.list());

    // I know that the first port in the serial list on my computer is always my
    // Arduino, so I open Serial.list()[0].
    // Open whatever port is the one you're using.
    myPort = new Serial(this, Serial.list()[0], 115200);

    // don't generate a serialEvent() unless you get a newline character:
    myPort.bufferUntil('\n');

    // set initial background:
    background(0);
  }

  void draw () {
    // draw the line:
    stroke(127, 34, 255);
    line(xPos, height, xPos, height - inByte);

    // at the edge of the screen, go back to the beginning:
    if (xPos >= width) {
      xPos = 0;
      background(0);
    } else {
      // increment the horizontal position:
      xPos++;
    }
  }

  void serialEvent (Serial myPort) {
    // get the ASCII string:
    String inString = myPort.readStringUntil('\n');

    if (inString != null) {
      // trim off any whitespace:
      inString = trim(inString);
      // convert to an int and map to the screen height:
      inByte = float(inString);
      println(inByte);
      inByte = -map(inByte, 0, 1023, 0, height);

      if (inByte > 0 && inByte < 1023) {
  // Update the graph
  inByte = map(inByte, 0, 1023, height, 0); // Map the value to the screen height, with 0 at the bottom
} else {
  // Ignore the value
  inByte = 0; // Set the value to 0 to avoid affecting the graph
}

    }
  }
For the code above:
This is a Processing sketch that reads data from an Arduino board and displays it as a graph. Here’s a breakdown of the code:
-
Import the Processing Serial library.
-
Declare a Serial object (myPort) and initialize it in the setup() function.
-
Set the window size and list available serial ports.
-
Open the serial port (in this case, the first one in the list).
-
Set the buffer to wait for a newline character (‘\n’) before triggering the serialEvent() function.
-
Initialize the background color.
-
In the draw() function:
-
Draw a line representing the incoming data.
- Move the horizontal position (xPos) to the right.
-
If the line reaches the edge of the screen, reset the position and clear the background.
-
In the serialEvent() function:
-
Read the incoming string until a newline character.
-
Trim whitespace and convert the string to a float value.
-
Map the value to the screen height (between 0 and the height of the window).
- Print the value to the console.
Note that this code assumes the Arduino board is sending data as an ASCII string, followed by a newline character (‘\n’). The data is then converted to a float value and mapped to the screen height for display.
You can adjust the code as needed to match your specific requirements.
# Test the connected UI:
And we can visualize the result from below.
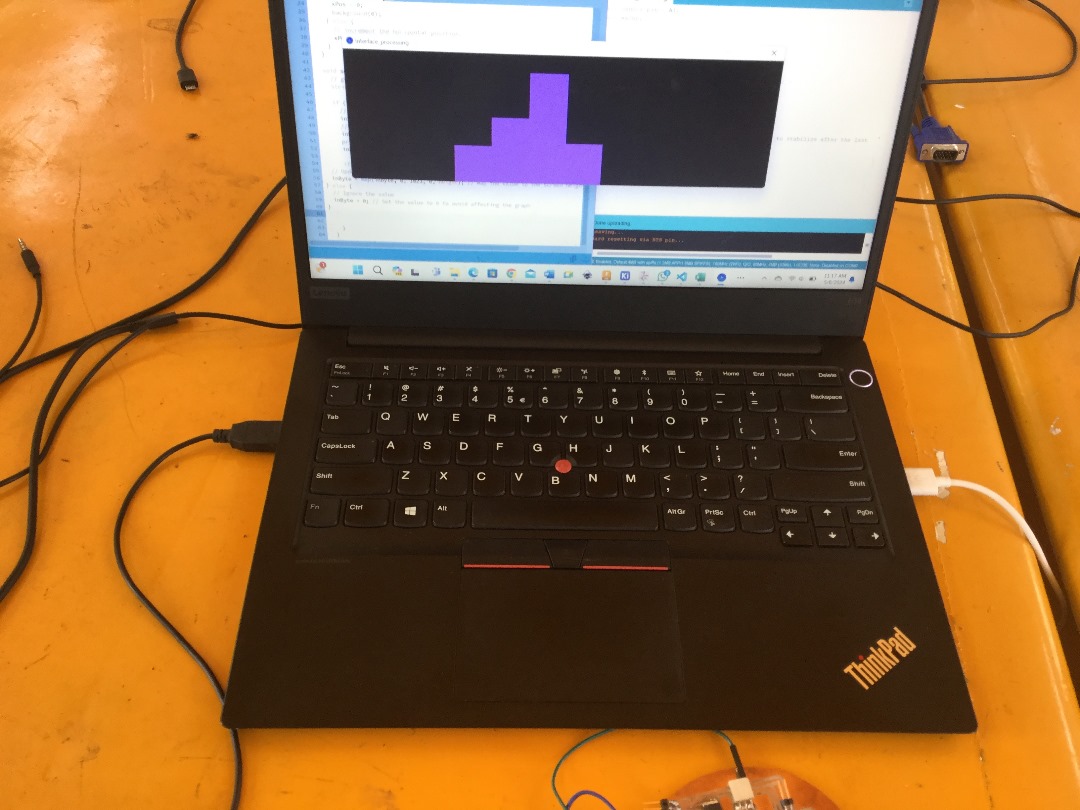
Debug where necessary:
There was nothing much to debug.
Files:
What well well / what went wrong:
Well this was another tremendous week full of fun as we discovered another new Ideas from Interface and Application programming. I have discovered alot from this week’s lesson and I am very greatful. I chose processing for the mean time but I also found some very interesting that I will keep on researching and practicing on.