Interface and application programming
Objectives of the week
- Individual assignment
- Write an application that interfaces with an input and/or output device that you made
- Group assignment
- Compare as many tool options as possible
Fun week coming! My objective here is to develop an interface for my pressure controller, and, if possible, that could be integrated with the motion tracking!
What I did
- Used python and several libraries to make an interface and plot data
- Interfaced my pressure sensors and PWM outputs with an interfaced
What I learned
- A lot! How to make an interface, and to receive and send formatted data
If I had the time to go further...
- As usual now, my final project would be finished!
Files and resources
Step 1: planning what I’ll do
First thing (I am used to it now): planning my week! I planned to develop an interface for my final project anyway, so this week’s project comes with a good timing for me! Basically, I want to plot data, and to control outputs. A plus would be to integrate the image processing part in the same window, so I want my interface to be modular.
Since I fall in love with Python, and that I started the image processing using python, I will use this langage for my interface. I am quite novice, so I will use Tkinter for the interface itself, and Pyserial for the communication with the board. On the other side, I have now all the Arduino resources!
Step 2: discovering Tkinter and Pyserial
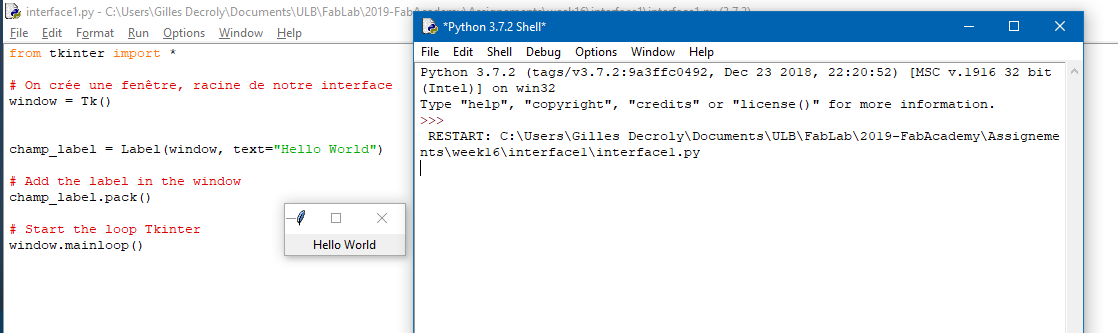
First thing: the Tkinter Hello world. I followed this french tutorial
Concerning Pyserial, I followed this introduction. After several tries, the first tests were (almost) successful:
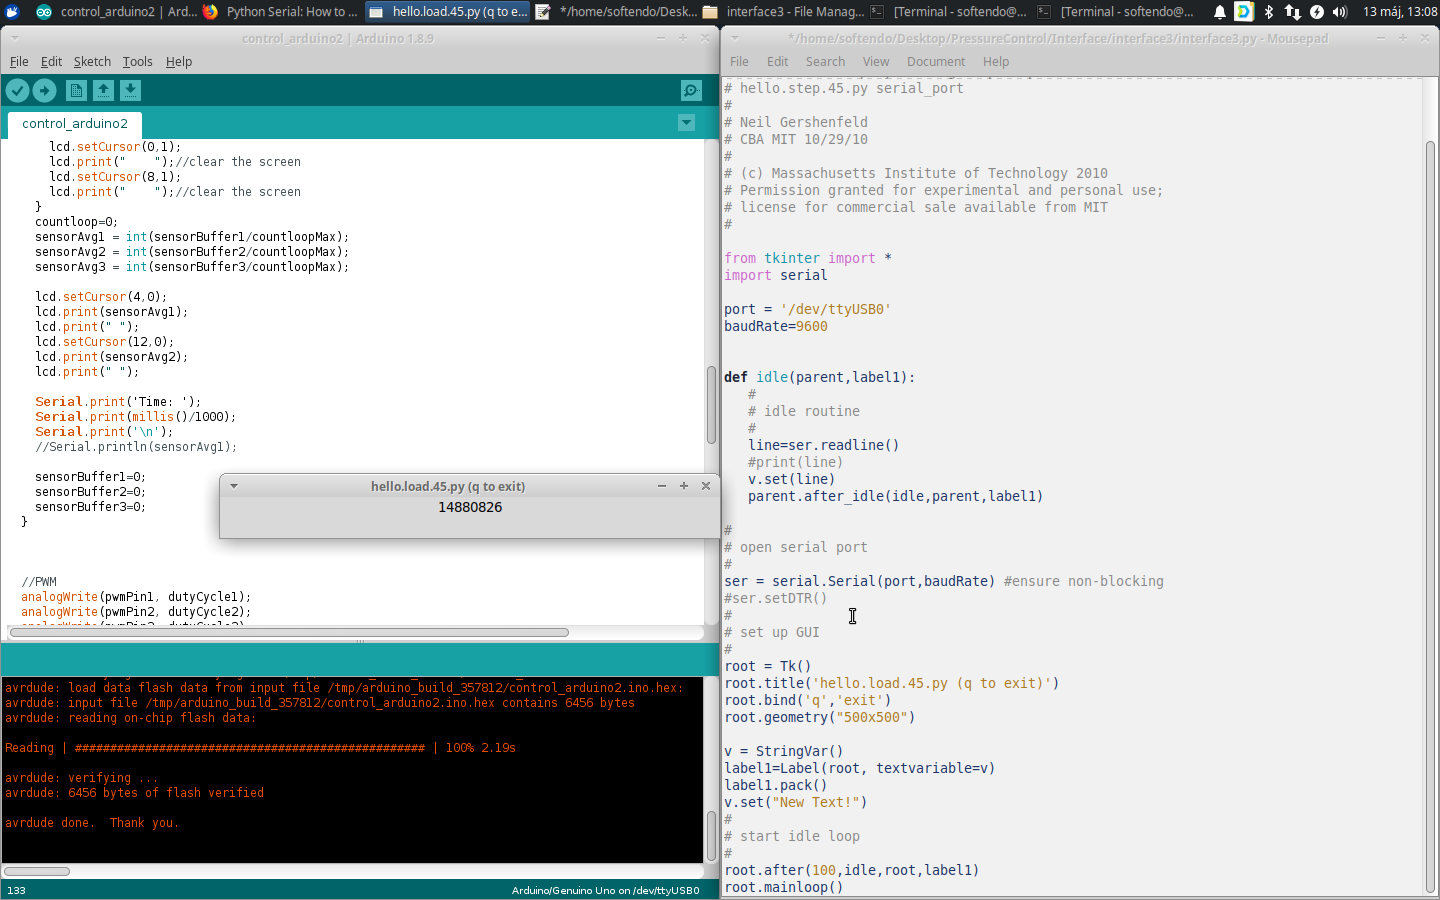
Note that all the source code is given at the top of the page!
Step 3: making a nice (but far from fancy) interface
Difficult to do a good documentation here, I mostly invite you to go check the source code! However, I will develop the key parts of the code below. To do this code, here are the libraries that I used:
- Pyserial for the communication
- Tkinter for the interface
- Matplotlib for the data visualisation
- Numpy because you need Numpy
And the tutorials that I followed:
- Pyserial and Arduino
- matplotlib and real time plotting
- Good practice for Serial communication
- Neil’s example, for the structure of the code
After several developments, here is the working interface:
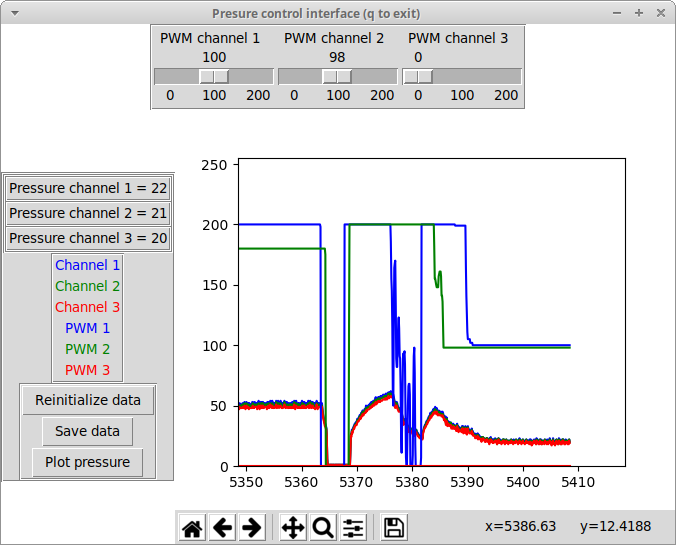
Ok, I agree, it is not very fancy, but it does the job! It plots and saves the data, and allows to communicate with the board! Note that neither the PWM values nor the pressure values are calibrated: they still mean nothing now! More, the pneumatic circuit behind it is not fully connected, so the window showed here is just an example! However, you can see that the pressure reacts to the PWM, that can be adjusted with the sliders: good! I will detail a little bit further the ley parts of the interface below. Note that the final source code can be downloaded from the top of the page.
Tkinter and widgets
To add elements to a tkinter interface, widgets must be defined. Widgets can be label, sliders, buttons, canves, … Here I used Frames, to place and arrange the widgets on the window, Buttons, Labels, and Slider, and a Canvas for the plot. Here is an example of how I used those elements. Variable labels of text can be set by using the StringVar elements: the text will be automatically Updated when the StringVar is changed.
Setting up the interface:
# set up GUI
root = Tk()
root.title('Presure control interface (q to exit)')
root['bg']='white'
root.bind('q','exit')

# inputs
fr_input=Frame(root,borderwidth=2, relief=GROOVE, width=400)
fr_input.pack(side=TOP)

w1 = Scale(fr_input, from_=0, to=200, orient=HORIZONTAL, resolution=1, tickinterval=100, length=120, label='PWM channel 1')
w1.set(PWM1)
w1.pack(side=LEFT)

# labels
fr_legends=Frame(root,borderwidth=2,relief=GROOVE)
fr_legends.pack(side=LEFT)

fr_labels=Frame(fr_legends,borderwidth=2,relief=GROOVE)
fr_labels.pack(side=TOP)

fr_label_p1=Frame(fr_labels,borderwidth=2,relief=GROOVE)
fr_label_p1.pack()
label_p1=Label(fr_label_p1, text="Pressure channel 1 =")
label_p1.pack(side=LEFT)
v_p1 = StringVar()
v_p1.set("0")
label_v_p1=Label(fr_label_p1, textvariable=v_p1 )
label_v_p1.pack(side=LEFT)

fr_legend_graph=Frame(fr_legends,borderwidth=2,relief=GROOVE)
fr_legend_graph.pack()
l=Label(fr_legend_graph, text="Channel 1", fg="blue")
l.pack(side=TOP)
l=Label(fr_legend_graph, text="Channel 2", fg="green")
l.pack(side=TOP)

# buttons
fr_button=Frame(fr_legends,borderwidth=2,relief=GROOVE)
fr_button.pack(side=TOP)

button_reinit=Button(fr_button, text='Reinitialize data')
button_reinit.bind("<Button-1>", reinit_b)
button_reinit.pack(side=TOP)
And in the idle loop:
#Update parameters
PWM1=w1.get() #Reads the value from the slider

#Update the variable labels of the interface (p1 is received from the arduino)
v_p1.set(p1)
Serial communication
This part was the key challenge of this week: how to send and receive data from the arduino. This works sufficiently good to be able to communicate with the bard, but this could still be improved: the connection is still sometimes unstable and can lead to crashing the interface.
Initializing the communication
# open serial port
port = '/dev/ttyUSB0'
baudRate=9600
ser = serial.Serial(port,baudRate)
Defined functions
def decode_int():
    """Reads an int sent by the arduino as a string and terminated by a '\n'"""
    global serial
    try:
        ser_bytes = ser.readline()
        decoded_bytes = (ser_bytes[0:len(ser_bytes)-2].decode("utf-8"))
        test =int(decoded_bytes)/1 # The value is effectively an int
        return(int(decoded_bytes))
    except:
        print("An error occured on the int serial transmission")
        return(-1)

def decode_float():
    """Reads a float sent by the arduino as a string and terminated by a '\n'"""
    global serial
    try:
        ser_bytes = ser.readline()
        decoded_bytes = (ser_bytes[0:len(ser_bytes)-2].decode("utf-8"))
        test =float(decoded_bytes)/1 # The value is effectively an int
        return(float(decoded_bytes))
    except:
        print("An error occured on the float serial transmission")
        return(-1.0)

def decode_string():
    """Reads an string sent by the arduino and terminated by a '\n'"""
    global serial
    try:
        ser_bytes = ser.readline()
        decoded_bytes = (ser_bytes[0:len(ser_bytes)-2].decode("utf-8"))
        return(decoded_bytes)
    except:
        print("An error occured on the String serial transmission")
        return("-1")
In the idle loop
#Detects the framing
start=decode_string()
if(start=="P1"):
        p1=decode_int()
        p2=decode_int()
        p3=decode_int()
        timeInt=decode_int()
        time=float(timeInt/1000)

        # Add the received values to the lists
        if(p1>=0 and p2>=0 and p3>=0 and time>=0): #Ensure that all the data were cotrrectly received
            pressure1.append(p1)
            pressure2.append(p2)
            pressure3.append(p3)
            PWM1_L.append(PWM1)
            PWM2_L.append(PWM2)
            PWM3_L.append(PWM3)
            timeL.append(time)
            save_csv()#Save at each step the values in a csv file
        else:
            print("Data missed")

#Format data to be sent to the arduino using the serail communication
str_PWM1 = str(PWM1)+'\n'
str_PWM2 = str(PWM2)+'\n'
str_PWM3 = str(PWM3)+'\n'

#Send data to the arduino
ser.write(b'PWM\n')
ser.write(str_PWM1.encode("utf-8"))
ser.write(str_PWM2.encode("utf-8"))
ser.write(str_PWM3.encode("utf-8"))
And in the Arduino loop, every 100 loops
//Serial communication with the python interface: sending data
Serial.println("P1");
Serial.println(sensorAvg1);
Serial.println(sensorAvg2);
Serial.println(sensorAvg3);
Serial.println(millis());
}

//Serial communication with the python interface: receiving data
if(Serial.available()) {
  String incomingString = Serial.readStringUntil('\n');
  if(incomingString=="PWM"){
    String pwm1=Serial.readStringUntil('\n');
    String pwm2=Serial.readStringUntil('\n');
    String pwm3=Serial.readStringUntil('\n');

    dutyCycle1=pwm1.toInt();
    dutyCycle2=pwm2.toInt();
    dutyCycle3=pwm3.toInt();
  }
Plot
This was the other key part of the interface! The challenge here was to be able to update the plot without having a full replot. In the first time, this took too much time, so it interfered with the serial communication, and lead to 2 problems: the program crashed often, and it induced a shift between the PWM values (not received) and the pressure values (received). Below is the final code:
Initializing the plot
# canvas and figures
plt.ion() #Enable interactive plot
fig = Figure(figsize=(5, 4), dpi=100)
a =fig.add_subplot(111)
a.set_ylim(0, 255)
a.set_xlabel('Time (s)')
a.set_ylabel('Pressure')
#a.grid()
l_p1, =a.plot(0,0, 'b')
l_p2, =a.plot(0,0, 'g')
l_p3, =a.plot(0,0, 'r')
l_pwm1, =a.plot(0,0, 'b')
l_pwm2, =a.plot(0,0, 'g')
l_pwm3, =a.plot(0,0, 'r')

canvas = FigureCanvasTkAgg(fig, master=root)  # A tk.DrawingArea.
canvas.draw()
canvas.get_tk_widget().pack(side=TOP, fill=BOTH, expand=1)

toolbar = NavigationToolbar2Tk(canvas, root)
toolbar.update()
canvas.get_tk_widget().pack(side=TOP, fill=BOTH, expand=1)
Defined plot functions
def update_graphs(a,l):
    """ Update the graph real time """
    global pressure1, pressure2, pressure3, timeL, p1, time

    update_single_graph(timeL, pressure1, l_p1)
    update_single_graph(timeL, pressure2, l_p2)
    update_single_graph(timeL, pressure3, l_p3)
    update_single_graph(timeL, PWM1_L, l_pwm1)
    update_single_graph(timeL, PWM2_L, l_pwm2)
    update_single_graph(timeL, PWM3_L, l_pwm3)
    a.set_xlim(timeL[-1]-60, timeL[-1]+10) #number of seconds before and after the last element of the time list

    canvas.draw()


def update_single_graph(x,y,l):
    """x, y: python lists of the same size"""
    X=np.array(x)
    Y=np.array(y)
    l.set_data(X, Y)
And in the idle loop
if(plot_pressure==True):
  try:
    update_graphs(a,l)
  except:
    print("Reinitialisation of the data required")
Saving the data
Finally, I implemented 2 ways of saving the data: saving them as Numpy lists as the action of a button, and saving them automatically in a csv file, at each idle loop.
Saving data as numpy lists:
def save_b(event):
    """Saves the numpy lists (action of the  button)"""
    global timeL, pressure1, pressure2, pressure3
    try:
        os.mkdir('results')
    except OSError:
        pass
    now=datetime.now()
    folder_name=now.strftime("%Y-%m-%d_%H-%M")
    path='results/'+str(folder_name)
    try:
        os.mkdir(path)
    except OSError as e:
        print(e.errno, e.strerror, e.filename)
    np.save(path+'/timeL', timeL)
    np.save(path+'/pressure1', pressure1)
    np.save(path+'/pressure2', pressure2)
    np.save(path+'/pressure3', pressure3)
    print('Results saved in folder', path)
Saving data in csv file:
- Initializing the file:
# open csv file
now=datetime.now()
folder_name=now.strftime("%Y-%m-%d_%H-%M")
path='results/'+str(folder_name)
f_csv=open(path+"test_data.csv","a")- Function called in the loop:
def save_csv():
    """Save the data in the csv file f_csv"""
    global f_csv, p1, p2, p3, PWM1, PWM2, PWM3, time
    writer = csv.writer(f_csv,delimiter=",")
    writer.writerow([time,PWM1,PWM2,PWM3,p1, p2, p3])
Update week 18: making my own board for the final project.
After some prototyping steps using my satshakit, I made my own board, including among other the outputs and inputs chains. This board is fully documented in the final project’s page. Now, the interface is effectively for a board that I designed and made!
Step 4: group assignment
In the group, we tested mainly 2 options:
- The easy way (as I did): using Python with Tkinter and Pyserial.
- And the hard way (as Axel), who worked on an Inkscape plugin using Python, to interface our machine.
Comparing the results, we can highlight several points:
- Tkinter and Pyserial are simple libraries that allow a quick learning curve, and a basic use can be enough to collect or send simple data.
- However, they are limited. As example, Tkinter become quiclky havy and complex if you want more fancy interfaces. For example, here is the interface that I obtained: not fancy at all but functional.
- More, if you want more complex interfaces, for example to control a machine, you’ll need other tools, that become more complicated to use, but allow more possibilities, as Axel did and documented.