Assignment 9 - Interface & Application Programming
The Group Assignment for this week is to compare as many tool options as possible.
The group assignment is done by Ting Kok Eng, Noel Kristian, Yeo Gau Siong and Lucas Lim.
Due to the closure of SP Gablab due to Covid-19, this group assignment is actually done by individual member at home and compiled together here. The task requires the team to explore as many tool options as possible. After our discussion with our coaches, we collectively defined our scope as "exploring the graphical user interface (GUI) toolkits with different programming languages.. We decided to study the followings:
- Graphical user interface (GUI) toolkit used with Python
- Graphical user interface (GUI) toolkit used with Javascript
- Graphical user interface (GUI) toolkit used with Processing
Graphical user interface (GUI) toolkit used with Python
A graphical user interface (GUI) is a desktop application that has buttons, tabs and such that allows the user to interact with the application and enriches the experience of giving a command (command-line input) to the code. There are many graphical user interface (GUI) toolkits or libraries that can be used with the Python programming language. The more popular ones are Tkinter, wxPython, and PyQt which can all work with Windows, macOS, and Linux. Others include Jypton, PyGUI and Kivy.
For this group assignment, the group tried Tkinter.
Tkinter commonly comes bundled with Python, using Tk and is Python's standard GUI framework. It is famous for its simplicity and graphical user interface. It is open-source and available under the Python License. The process of creating a GUI using Tkinter is explained in the below flowchart below from DataCamp.com
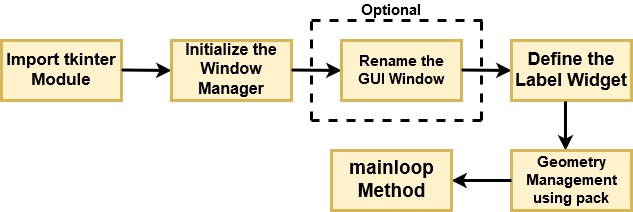
Since Tkinter is an inbuilt Python module, there is no need to worry about the installation of the Tkinter module. To use the tkinter module, it simply needs to be imported into the program code. Following that, the main window is created and the required widgets are added and finally closed witn an event loop which basically tells the code to run in an infinte loop in the back-end and keep displaying the window until it is manually closed.
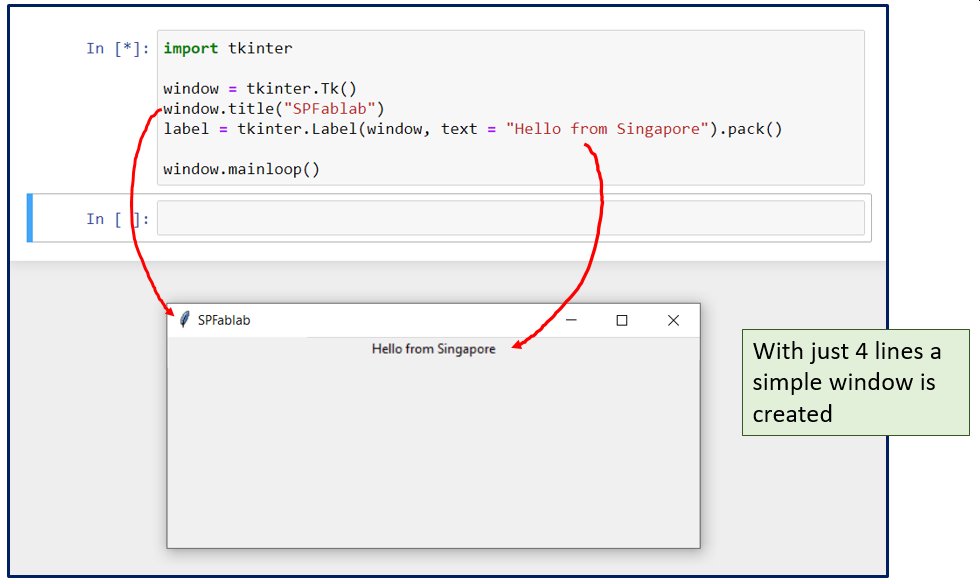
Using tkinter, a simple window can be created with only four lines of code, as below:
After creating the window, the next step is to put in the required widgets which gives the application an improved look and feel. They are like elements in HTMl such as frames, labels, buttons and checkbuttons. One reason why tkinter is so popular is the availability and ease of using these widgets. Some of the more commonly used ones are as follows:
- Canvas - allows drawing of shapes in the GUI.
- Button - places a button in the Tkinter.
- Checkbutton - creates a check buttons in the application.
- Entry - creates an input field in the GUI.
- Frame - used as containers in the Tkinter.
- Label - creates a single line widgets like text, images etc.
- Menu - creates menus in the GUI.
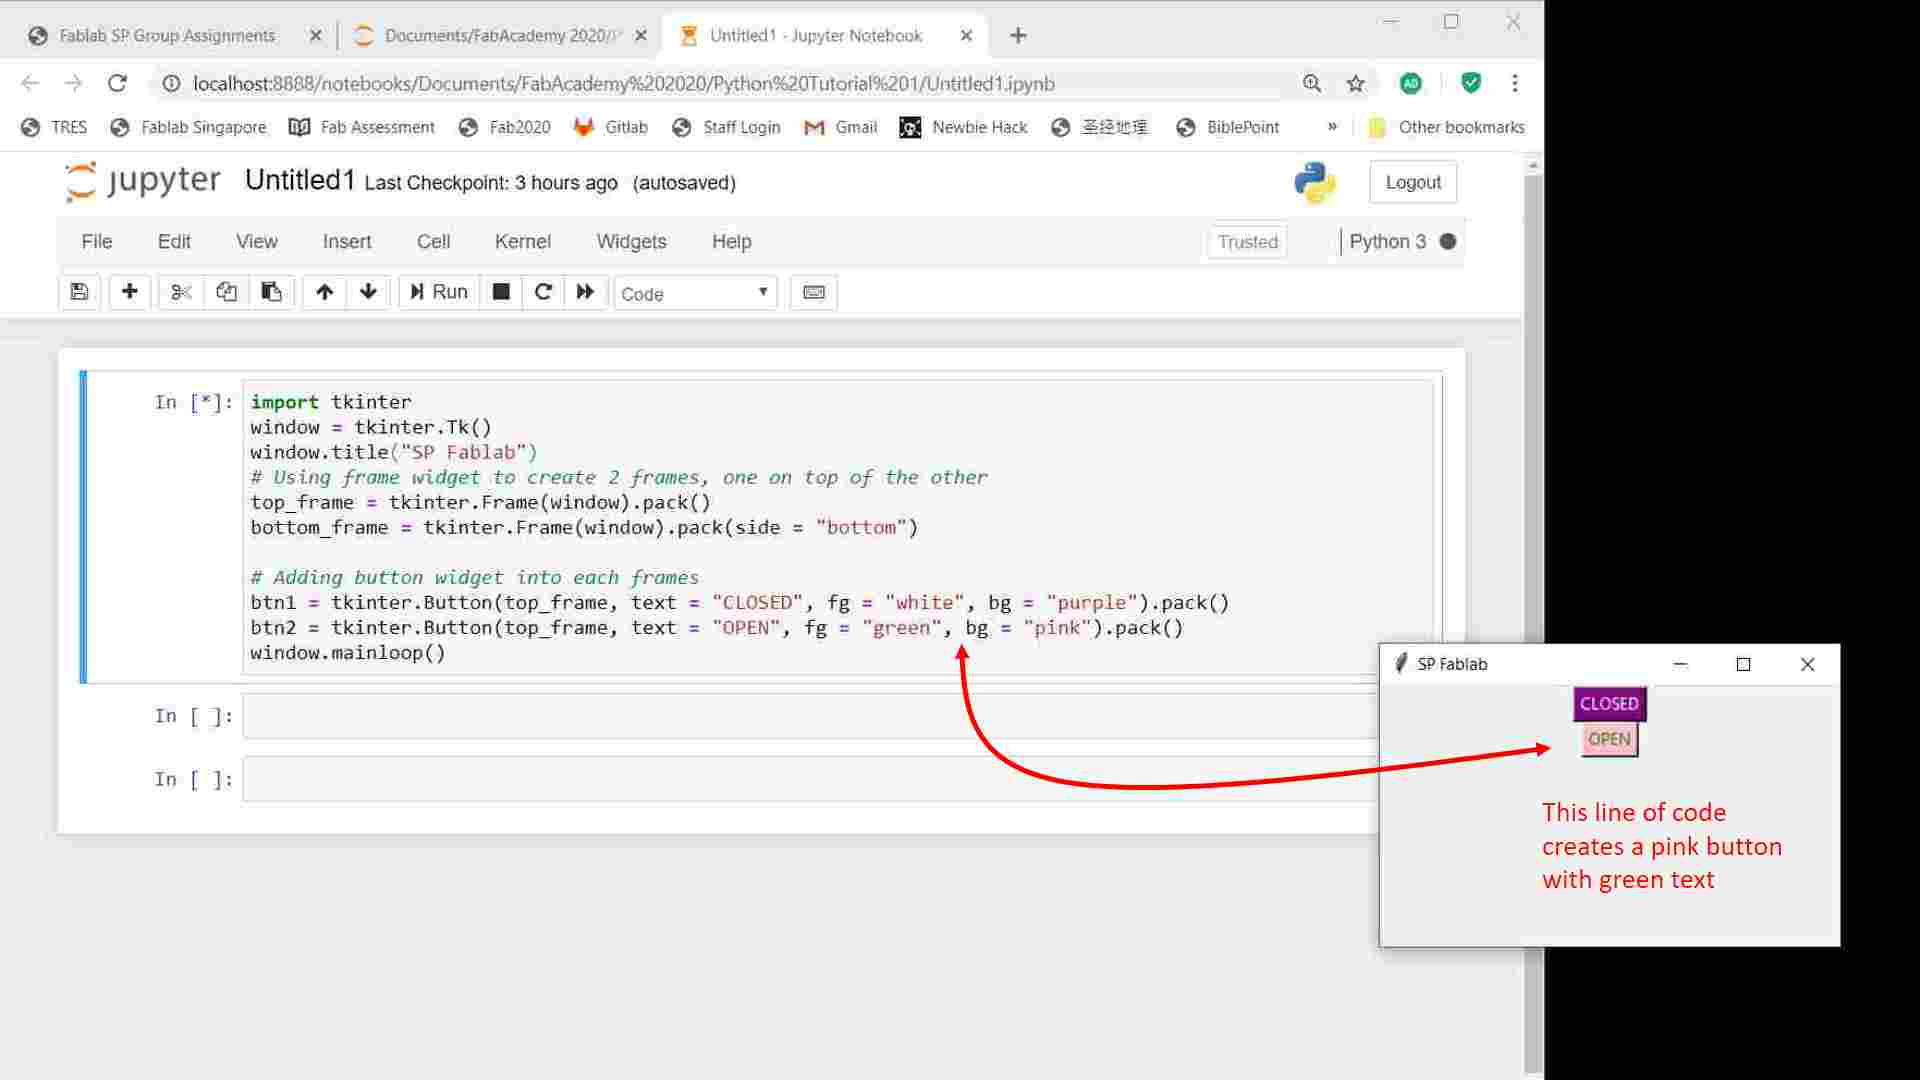
Adding widgets in tkinter is very direct and straight forward. In the example below, a simple window with 2 different colour buttons are created with less than 10 lines of code. More example of how to add widgets are available from many online training videos and tutorials. One good source that the team referred to is the blog by Anirudh Rao from Edureka.co
to download the python file.
After adding a widget, the next thing is to associate a fuction to the widget, that's what happens when the user interacts with the widget. For the case of the button, it is the command that will be executed when the button is click. In the example below, everytime the button is pressed, a greetingmessage will be generated
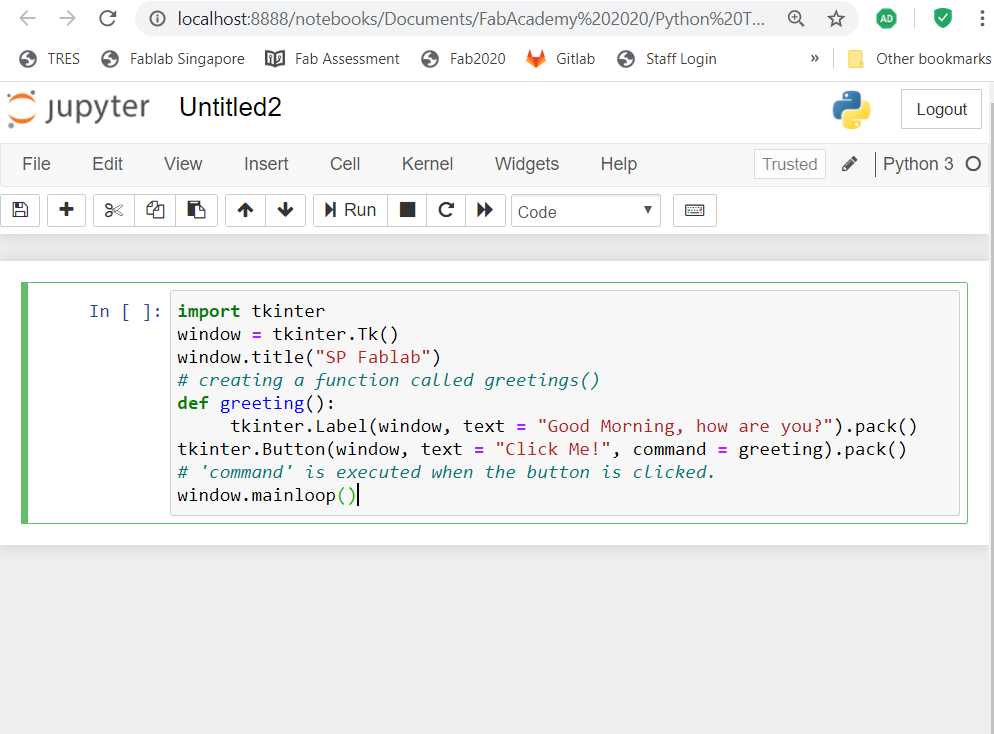
In this video, everytime the button is clicked, a greeting "Good Morning, how are you?" will be generated
to download the python file.
Web Application Development using JavaScript
Internet has becomes mainstream and many people are online, therefore our group decided to try out Javascript programming to create a web based GUI application.
JavaScript is a cross-platform, object-oriented scripting programming langauage and it is supported by most major web browsers today. Javascript have matured over the years and adoption has expanded. Node.js is one of the advanced server side versions of JavaScript which has it's own Runtime Environment (running .js code with node.exe) and comes with its own JavaScript Libraries which are very fast in code execution. Node.js files uses the extension ".js".
For this assignment, Visual Studio Code is used. Visual Studio Code is a lightweight but powerful source code editor which comes with built-in support for JavaScript, Node.js and has a rich ecosystem of extensions for other languages (such as C++, C#, Java, Python, PHP, Go).
Steps
- Install Visual Studio Code and an extension called "live preview" that will run the web server and allow live preview of the html page.
- Install node.js.
- Install the serialport as well as the ws (websocket) npm package by typing the command :
npm install serialport
npm install ws - Refer to serialport 8.x.x readline online documentation to learn how to receive data from the serialport.
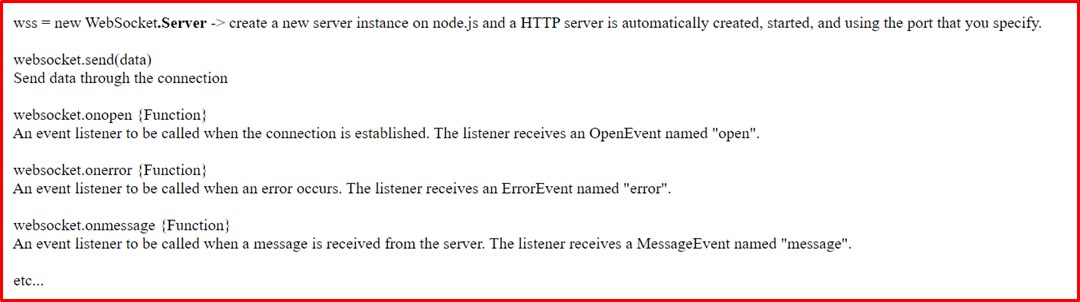
Setting up Websocket
The node.js server established the communication link directly with the hardware I/O via the serialport and able to receive the measurement data from the ultrasonic sensor. Then the measurement data is passed on to the client browser and displayed to the user. The client browser displays a html web page in which the user can interact, like clicking to start viewing the measurement data, pause and exit the web page.
The html web page communicate with the node.js server at the back end, this is possible with the implementation of 'Websocket'. Websocket establises a stable and persistent connection which allow the server and client to communication with each other in real time. The online documentation from ws (websocket) is a good source to learn how to send and receive data via websocket.
- Code using Visual Studio Code and drawing the bar chart using SVG (Scalable Vector Graphics) in drawing vector based graphic element like line, rectangular, etc. The team referred to the SVG tutorial online as the guide.
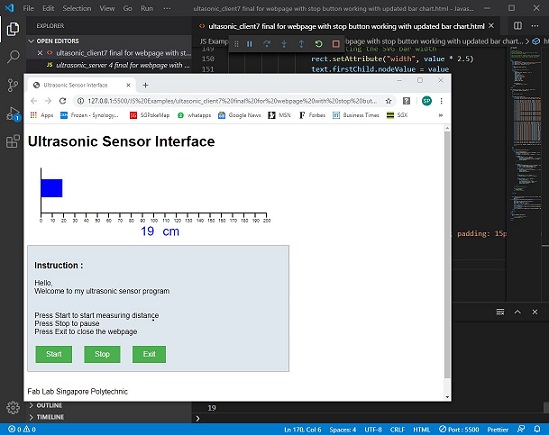
Video on JavaScript GUI
to download the javascript HTML file.
Reflection on Javascript
Overall the web based GUI application runs smoothly on the client browser. It is also possible for multiple users to be connected to the node.js server and view the measurement reading.
The programming is still structure scripting and not object-orientated programming. We are using SVG to draw the animated bar chart which is very basic and simple coding. We believe we can serach online for other 'data visualisation' tool to be integrated into the web development which could provide better graphic or more features.
As compared to Python, Javascript is more like C programming while python3 is more user-friendly. Both serving different scenario. Python would be used to develop stand-alone application while Javascript caters mainly to web browser. Python has extensive range of extensions (or packages) and online resources to learn. Although Node.js also has it's own range of extensions, the number are much smaller. The ws package for node.js is very simple and basic.
There are a few interesting websocket packages out there that the team hopes to explore in future, for example socket.on seems like for online chatting.
Graphical User Interface (GUI) toolkit used with Processing
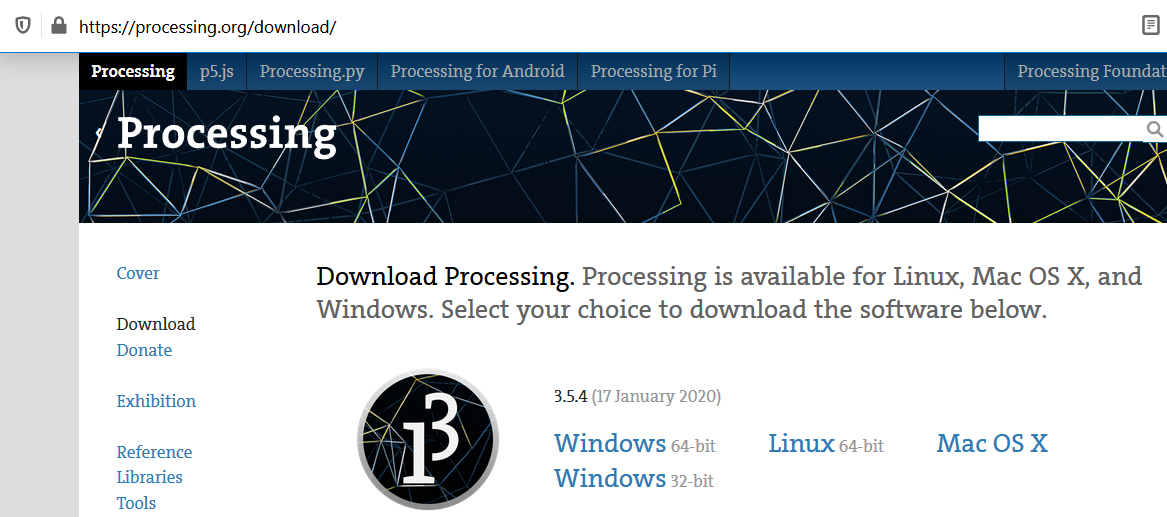
Processing is a flexible software sketchbook and a language for learning how to code within the context of the visual arts. Arduino IDE that the group has been using all while was built based on Processing hence it resemble to each other. The processing package can be downloaded from HERE.
After downloading and installing, we can refer to this REFERENCE that contain many very useful documentation to learn the structure of processing language aka "Cheat-Sheet".
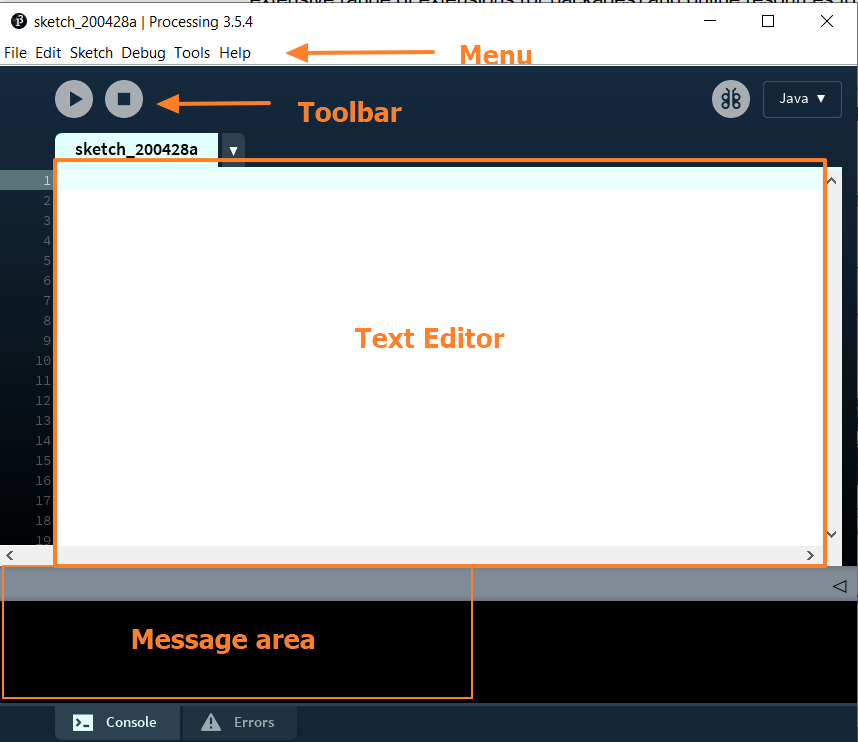
The Processing Development Environment is pretty similar to Arduino IDE as shown below.
Some of the feature that makes processing easy to use and very appropriate for beginners in programming are:
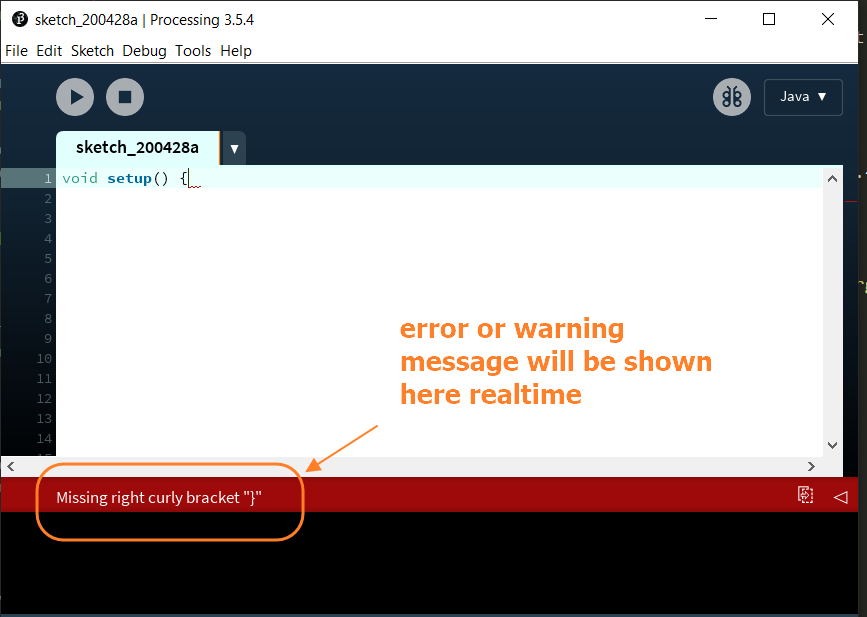
1. While typing the code (instructions), processing will detect any erros or any warnings of potential issues real-time.
2. Processing could propose ways to solve the errors.
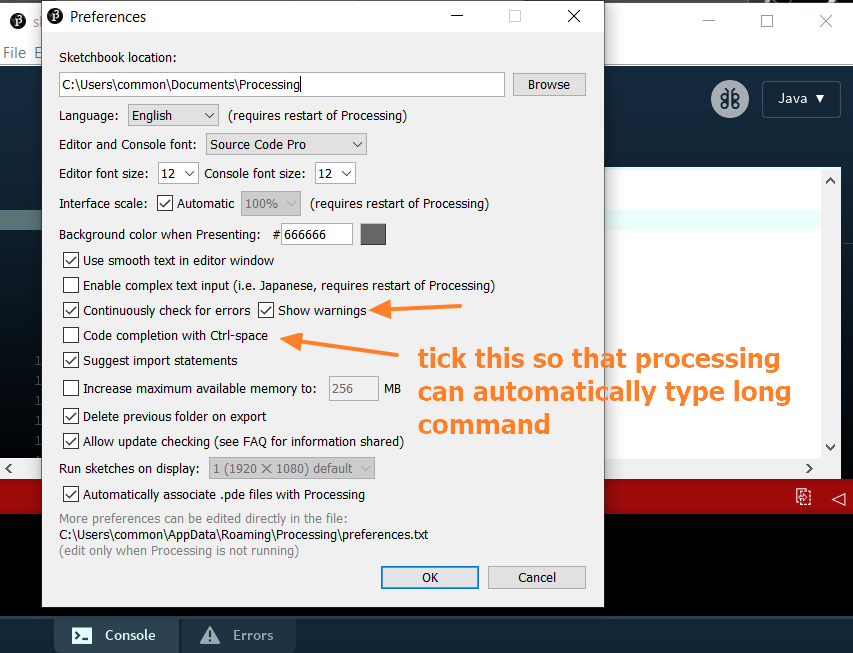
3. Auto completion will be suggested for long commands.
There are many similarities between Arduino IDE and Processing Development Environment (DE) command line, for example:
Like Arduino, Processing has a setup loop that is established by using:
void setup (){ code }
In Arduino IDE we use void loop where a certain function/command will continuously running. Since Processing is more towards visual art, drawing shapes is often used and Processing has a continuous loop where drawing is continuously performed that is established by using:
void draw () { code }
Similar to serial monitor in Arduino IDE, processing DE has canvas where the executed command will appear (example drawing of shapes) and user can determine the canvas size in pixels by using the below command:
size(width, height);
To draw shapes within canvas, Processing use the below command:
shape (X location, Y location, width, height);
There are many tutorials available in using processing. Let's learn to create simple user interface using processing by refering to this video TUTORIALs.
In this example, there are few basic functions, for example:
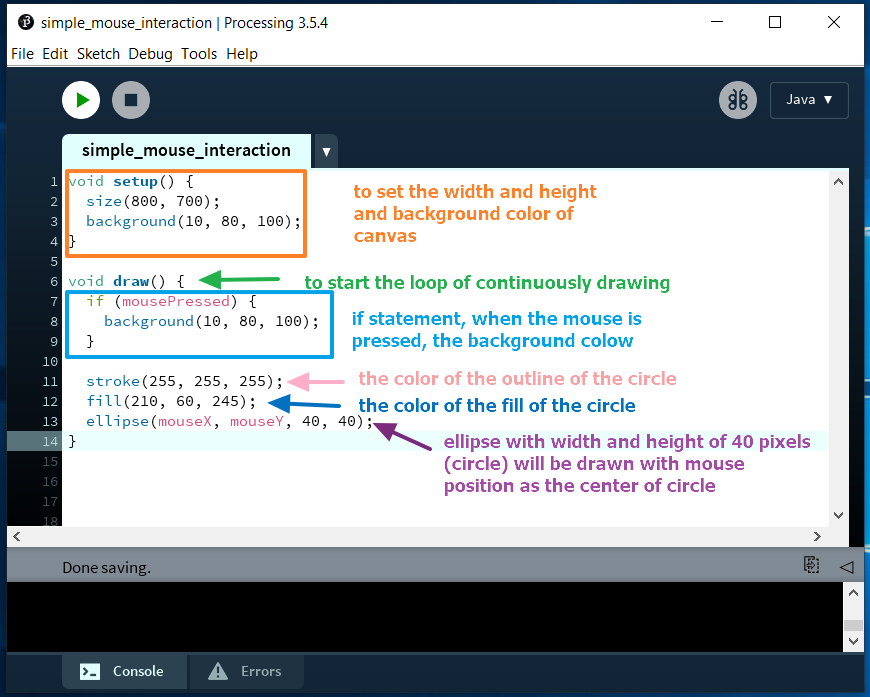
1. the if command, where when the mouse is pressed, the bacground will refresh to its origianal background as such the previously drawn circles (ellipse as typed in the processing DE).
2. the void draw command is a command to continuously draw (loop) a certain shape. In this example a circle (an ellipse with same width and height)
Below is the final code with some explanations of the code
Video on Processing GUI using the code above
In this video, once the mouse moves over the canvas, new circles (magenta color) will be drawn on the canvas. When the mouse is pressed, the background will refresh hence the previously drawn circles will be deleted.
to download the Processing .pde code file.
In this example an application is coded with Processing to display a radar map and a warning message. The script will also create an ellipse to follow the movement of the mouse on the screen similar to the example above but with some difference. A radar background that prints the message Warning!!! Enemy Detected" when the mouse gets near. The trace created by the ellipse in this example will also leave a trail that fades off gradually unlike in the example above, the trail remains solid and disappears completely when the mouse button is released.
to download the the Processing .pde code file.