Assignment 7 - Input Devices
There are 2 tasks for this week:
- Individual Assignment: Part 1: Measure something: Add a sensor to a microcontroller board that you have designed and read it
- Group Assignment: Part 2: We are to probe an input device(s)'s analog and digital signals.
The group assignment is done by Ting Kok Eng; Noel Kristian and Yeo Gau Siong. We decided to probe the below input devices and measure their signals:
- Ultrasonic sensor HC-SR04 that produces digital signal
- Temperature/humidity sensor DHT11 that produces digital signal
- Light Dependant Resistor (LDR) that produces analog signal.
To simplify the workflow without making new board, ARDUINO UNO board is used for each of the sensor and the programming is done in Arduino IDE.
1. Ultrasonic sensor HC-SR04
The details of the workflow in using ARDUINO UNO with Ultrasonic sensor HC-SRO4 can be seen in Noel Kristian's individual page.
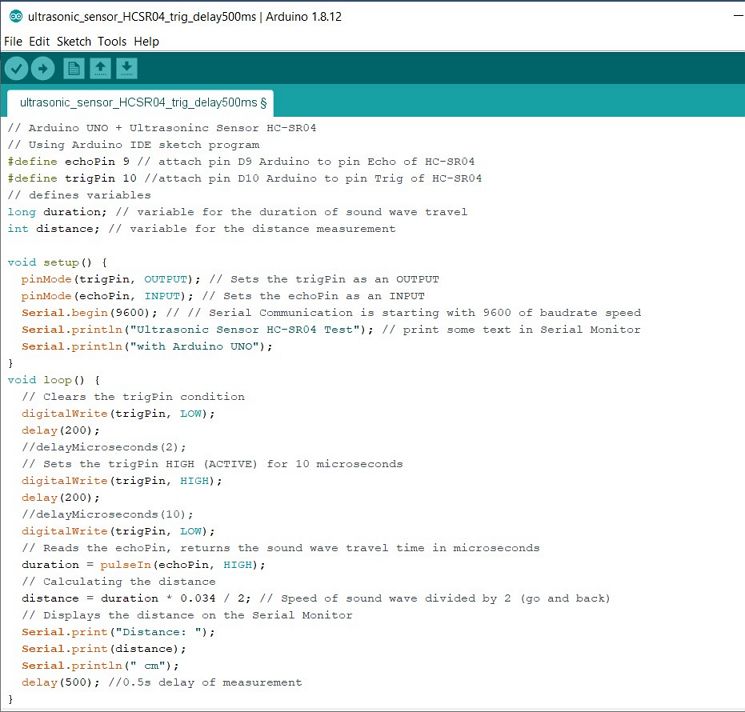
HC-SR04 sends trigger signal and receive echo signal. In the Arduino sketch below, the trigger signal is set HIGH (high voltage) for 200 ms and set LOW (low voltage) for 200 ms.
At the end of the trigger signal high, echo signal will be received in the form of high voltage, followed with a delay for 200 ms and then followed with 500ms delay where all the signals be at low voltage. Hence the total cycle is 900ms according to code that we have made.
To measure the 2 signals (trigger and echo), we used the 2 probes and 2 channels on the oscilloscope. On the oscilloscope screen, Channel 1 (yellow line) is for Trigger and Channel 2 (magenta line) is for Echo.
Below is the video of the measurement using oscilloscope. It can be seen the square wave signals of the trigger and step signal of the echo.
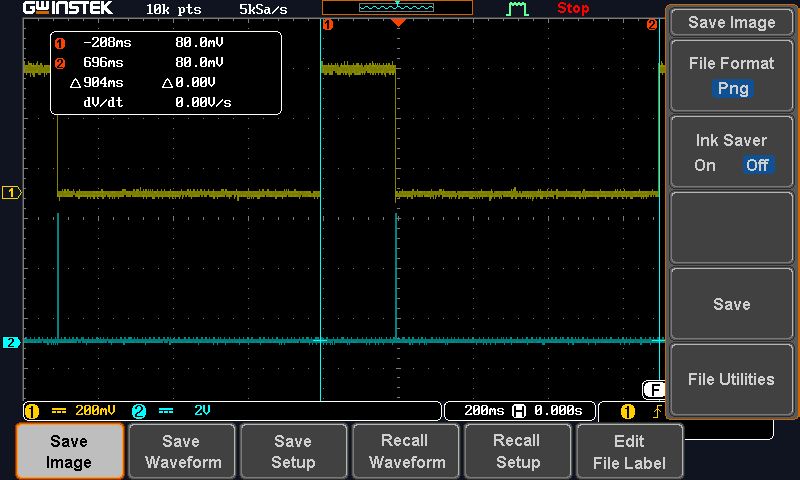
Below are the screen captures of the oscilloscope during the measurement.
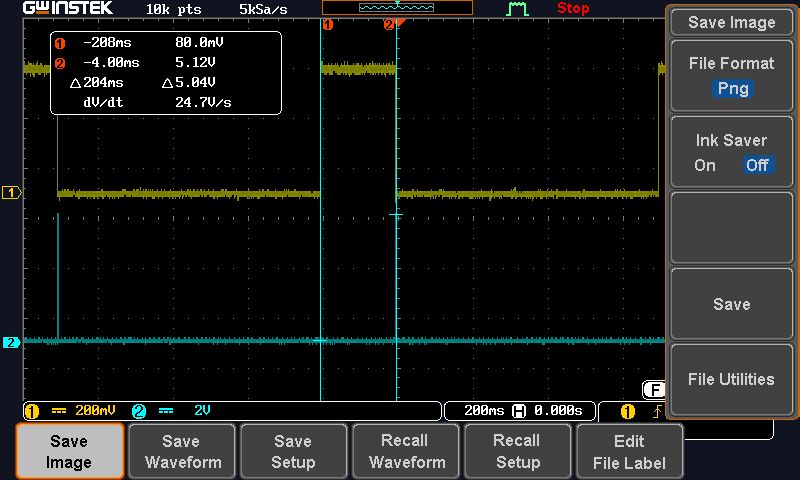
It can be seen that the difference between the HIGH and LOW trigger signal is 5 V and the duration of the HIGH trigger signal is 200 ms. These are the same as the code that we have made.
The echo HIGH signal is within a very short time interval and happened as soon as the trigger signal drop from HIGH to LOW.
The ECHO signal is 5 V. The entire cycle is 900ms. These are the same as the Arduino sketch code.
Now we can really see the relation between the code and what happened when the code is executed into the MCU.
Click Here to download ardunio code for this HCSR04
2. Humidity/Temperature sensor DHT11
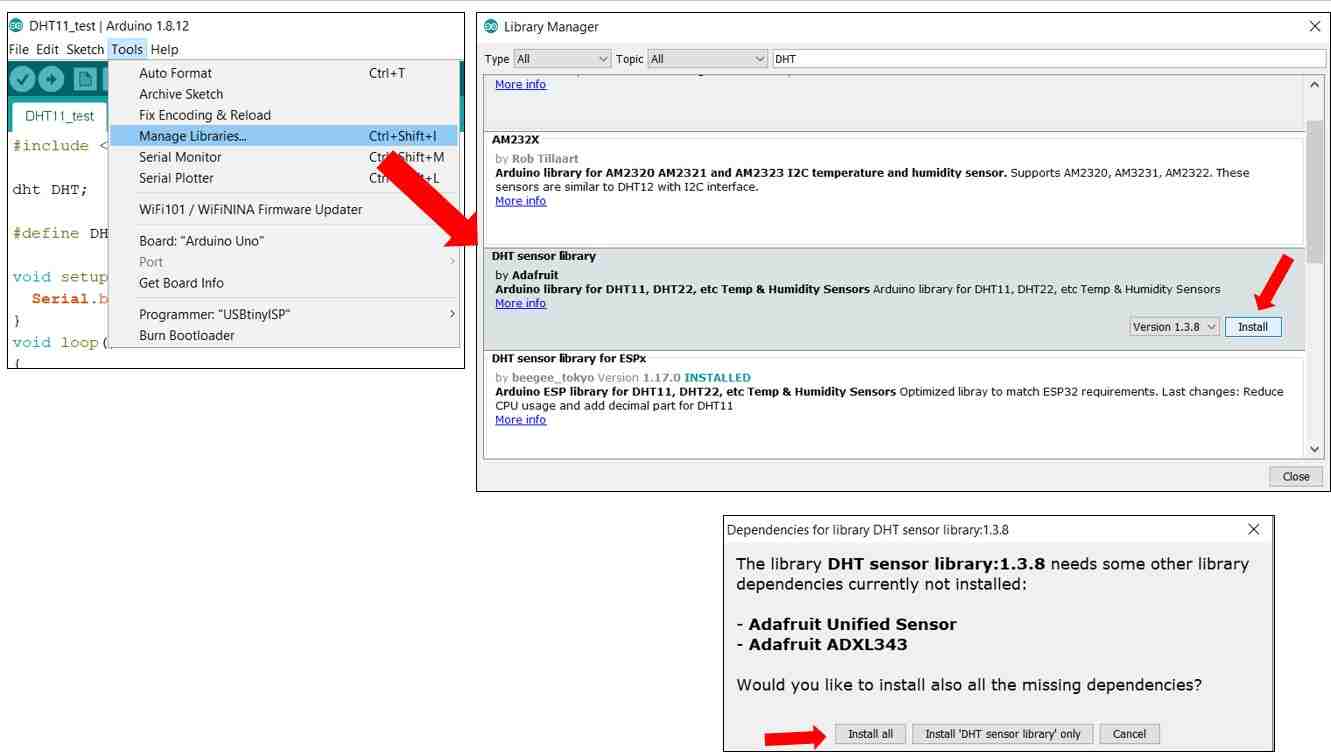
To use DHT11 in Ardinuo IDE, the library must be updated from "Tools" > "Manage libraries"
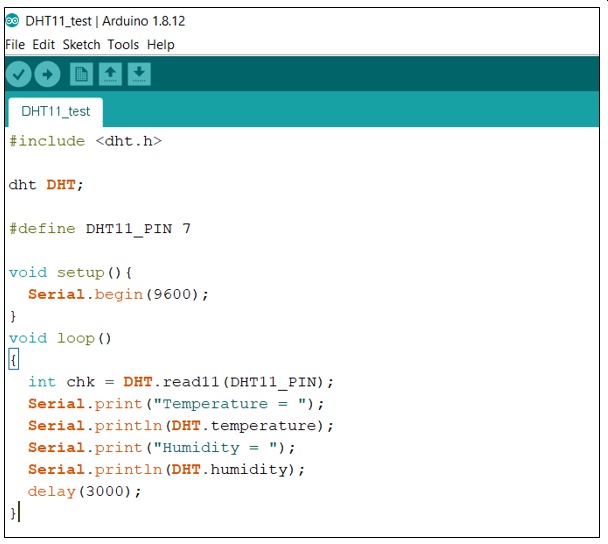
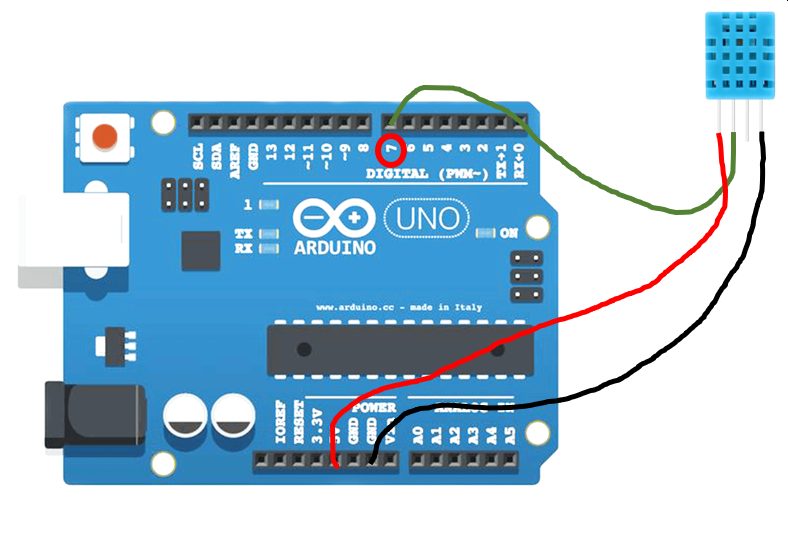
After adding the library, a simple program is written and compiled using Sketch. For connection, since the output from the sensor is digital, pins 2 to 13 can be used. Pin 7 is selected as it is at the end and easily located. Also as the sampling rate should be slower than 1 Hz, hence a delay of 3 seconds was used. However, when probing using an oscilloscope, the was changed to 200ms.
Using the "Serial Monitor" under "Tools", the humidity and temperature readings is being captured every 3 seconds. This showed that the sensor is working properly and the connection and the program correct. For the oscilloscope sampling, the delay timing is changed to 200ms for easy capturing.
Click Here to download ardunio code
Below are the screen captures of the oscilloscope during the measurement.
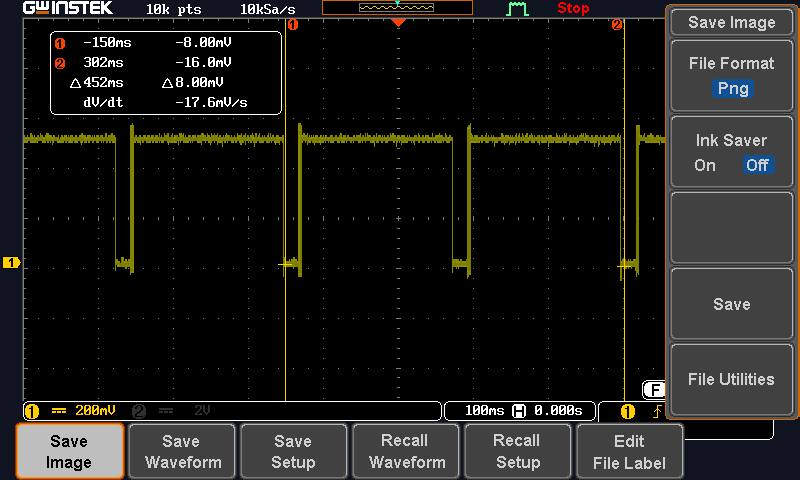
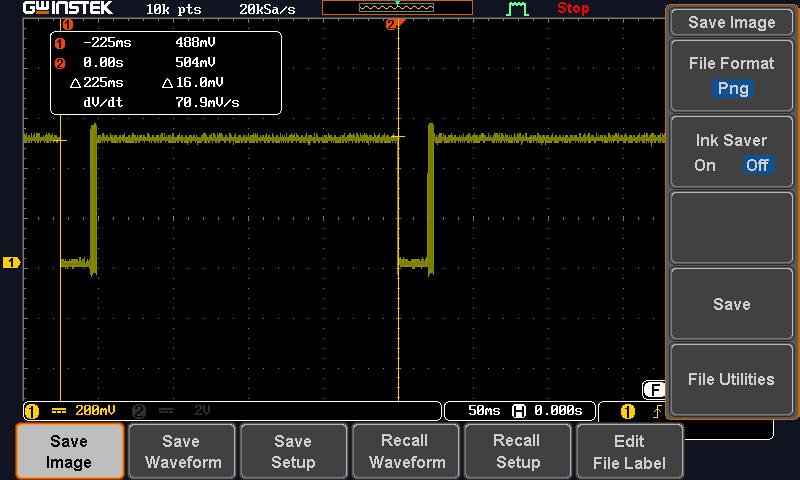
The duration of each cycle is 225 ms, eventhough the delay set in the arduino code is 200ms. This indicates that the measurement (transmiting and receiving) takes place within 25ms.
The HIGH signal is around 500mV and the LOW signal is around 10mV.
When we take a closer look at that 25ms interval at the beginning, after the LOW signal for 20 ms there's a burst of HIGH-LOW-HIGH signals within 5ms. On what these signals means, further reading of the data sheet of DHT11 should be done.
3. Testing the LDR Circuit (Analog signal)
To probe an analog signal, a LDR and a 4.7 kohm resistor is connected in series. The LDR is connected to VCC (5V) while the 4.7 kohm resistor is connected to ground. The signal at the junction is tapped and analysed using the ardunio IDE and with an oscilloscope. Since the signal is analog, A0 pin on the Ardunio UNO board is used.
Below is the setup and video of the measurement using oscilloscope. It can be seen how the signals gradually changed when the LDR is not covered (exposed to light) and covered, hence ANALOG signal.
Below are the screen captures of the oscilloscope during the measurement. LDR not covered. Shows high signals around 400 mv
The x10 switch on the oscilloscope probe is accidentally switched on, which explains why the values are 10 times smaller than what is registered on the serial monitor.
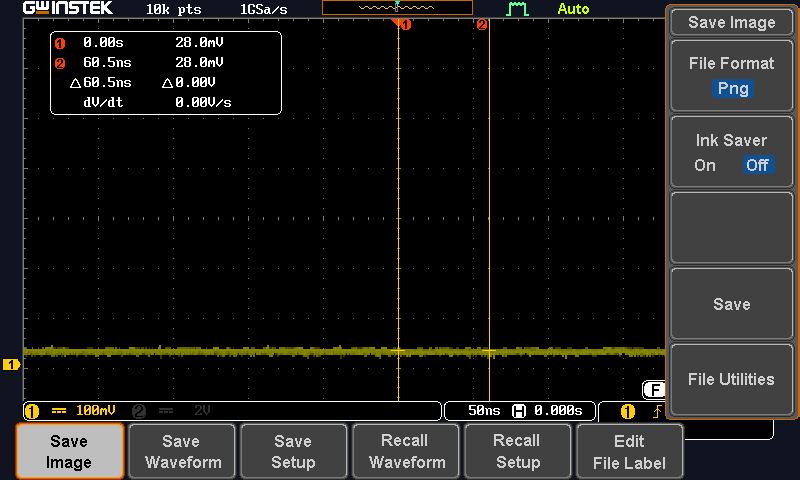
LDR Covered
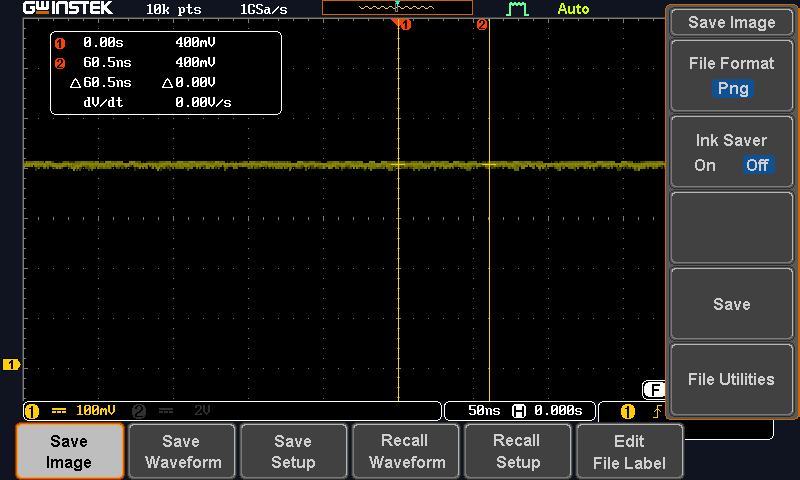
LDR Exposed to light
Click Here to download ardunio code