Week 14 | Interface and application programming
Overview
This week focused on Interface and Application Programming. The main goal was to develop user-friendly applications that allow embedded systems to communicate with users effectively, especially through web interfaces.
I explored how to create real-time web dashboards that receive data from sensors and present it in an interactive, visually way. This week bridged hardware (sensor reading on ESP32) with modern web technologies.
It was particularly exciting to see data from the physical world instantly visualized on a mobile phone.
Group Assignment
In the group assignment, we explored different ways to connect embedded systems to user interfaces, focusing on communication and real-time visualization. This helped build a clear understanding of how data can move from hardware to a browser interface. The group documentation is available here.
Individual assignment
For the individual assignment, I developed real-time web applications using ESP32-S3.
I started to make a user interface with a temperature sensor to see my office temperature on my mobile phone.
1. Temperature and humidity monitor (DHT22)
The goal was to move beyond raw numerical data and build visual, understandable interfaces.
Objectives
- Read sensor data using ESP32-S3
- Send data to browser in real time
- Design a clear and usable UI
- Add user interaction (start/stop control)
Hardware
- PCB board that I made in Electronic production week
- ESP32-S3
- USB C cable
- Wires
- Temperature and humidity sensor (DHT22)
Workflow
I followed this tutorial webpage, and used it for my needs.
Sensor → ESP32-S3 → WebSocket → Browser
The system worked as a simple data flow from the sensor to the user interface.
First, the temperature sensor (DHT22) captures data from the environment. Data was read and processed by the ESP32-S3.
Then, the ESP32 sends the data using WebSocket, which allows real-time communication without refreshing the page.
Finally, the browser receives the data and updates the interface instantly (every 2 second), showing the values to the user.
Some of my experiences were really helpful from the Input and Output Devices weeks.
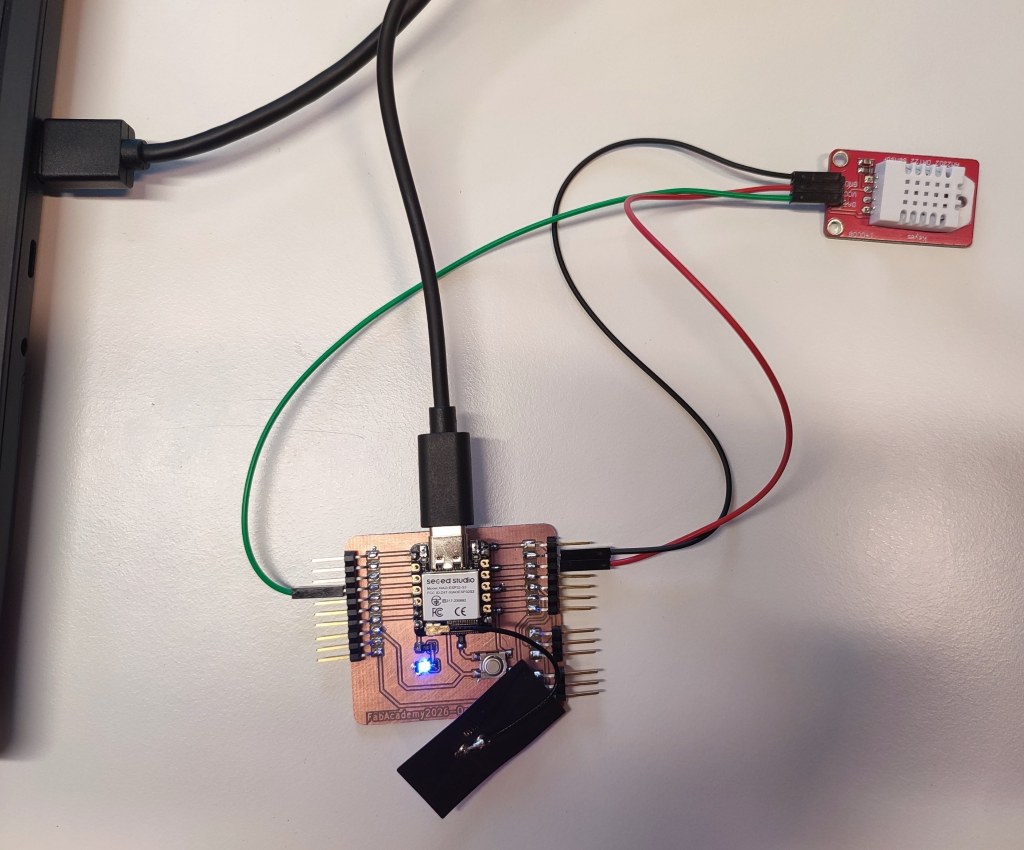
Wiring
| ESP32-S3 | DHT22 |
|---|---|
| 3.3 V | Vcc |
| GND | GND |
| GPIO 4 | Data |
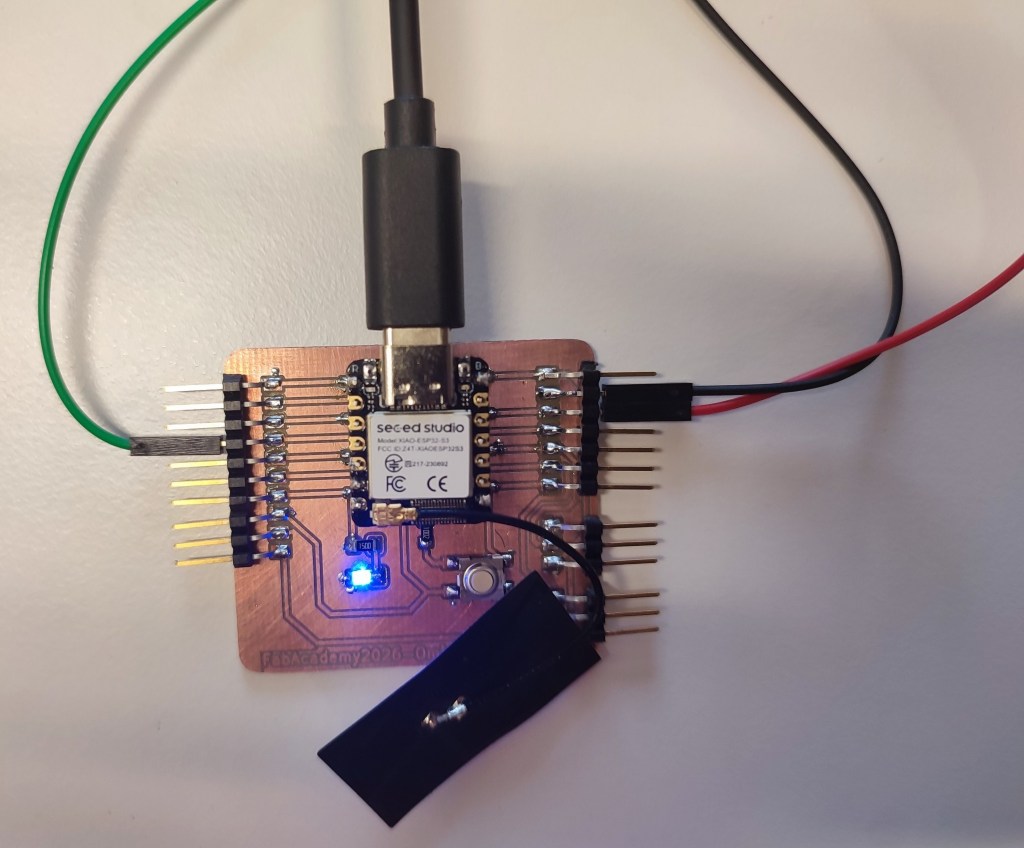
The setup I prepared.
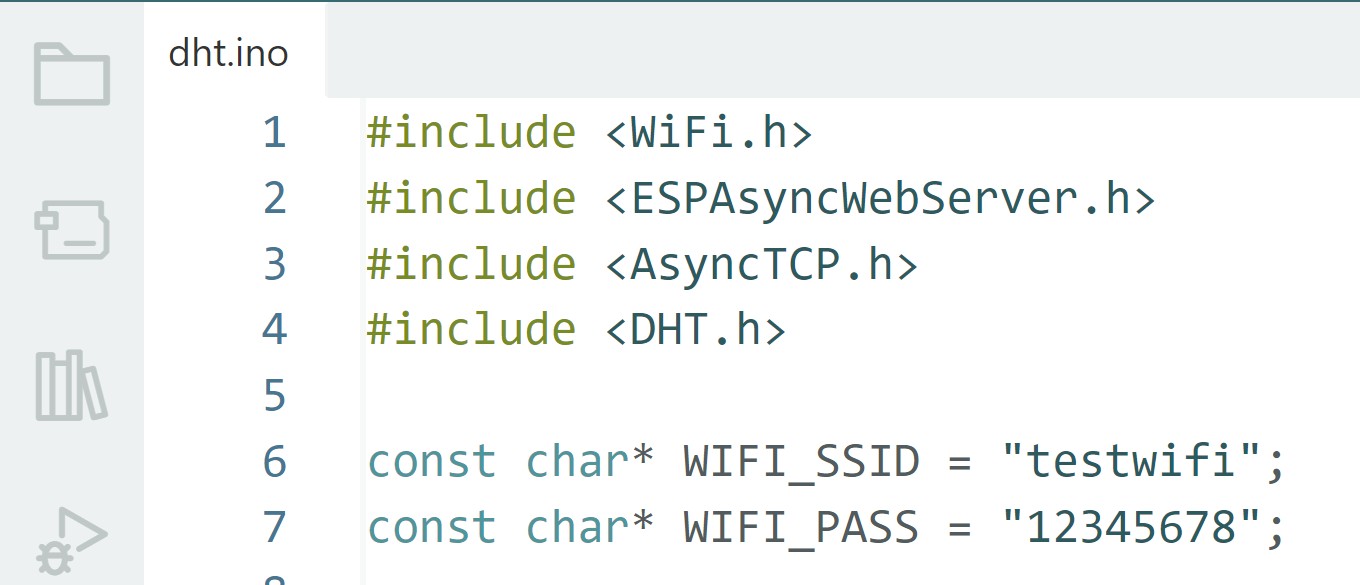
Programming - Arduino
In Arduino, I started with installed the libraries for DHT22 and defined the wifi to ESP32-S3:
Some explanation of the UI code:
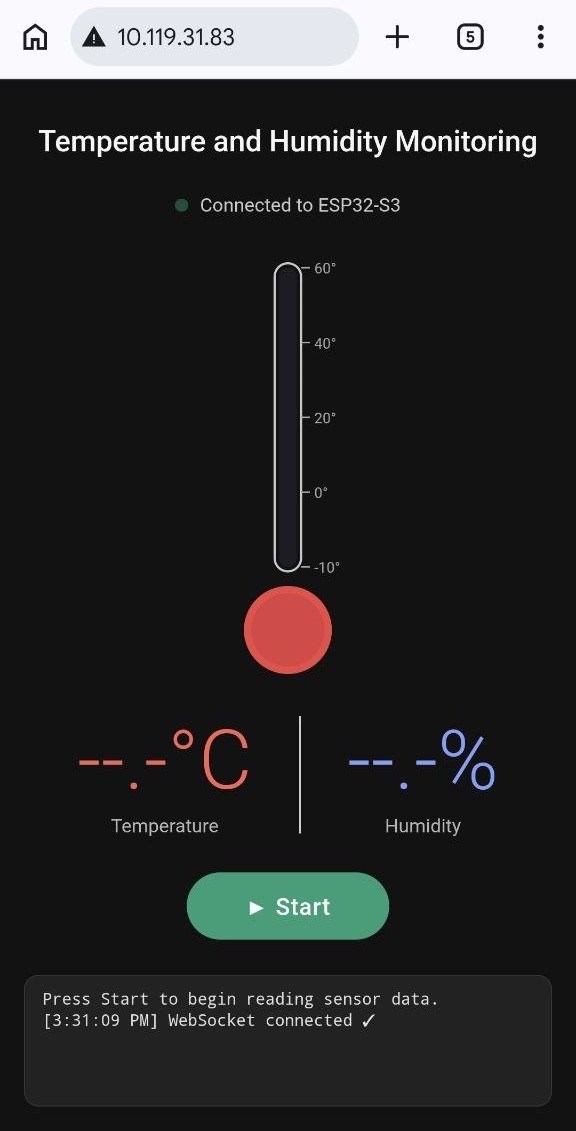
In the following sections, I explained the key parts of the web-based user interface for the ESP32 + DHT22 temperature and humidity monitoring.
The system serves a single HTML page from the ESP32 that contains:
- An interactive, responsive UI
- Real-time data visualization (custom SVG thermometer)
- WebSocket-based live updates
- Start/Stop control
- Live log
The entire UI is embedded in the C++ code as a PROGMEM string (HTML_PAGE).
1. HTML Structure
<body>
  <h1>Temperature and Humidity Monitoring</h1>

  <!-- Connection status -->
  <div class="status">...</div>

  <!-- SVG Thermometer -->
  <svg>...</svg>

  <!-- Digital readings -->
  <div class="readings">...</div>

  <!-- Start/Stop button -->
  <button id="ctrl-btn" onclick="toggleStream()">▶ Start</button>

  <!-- Live log -->
  <div class="log" id="log">...</div>
</body>
2. Key Visual Components
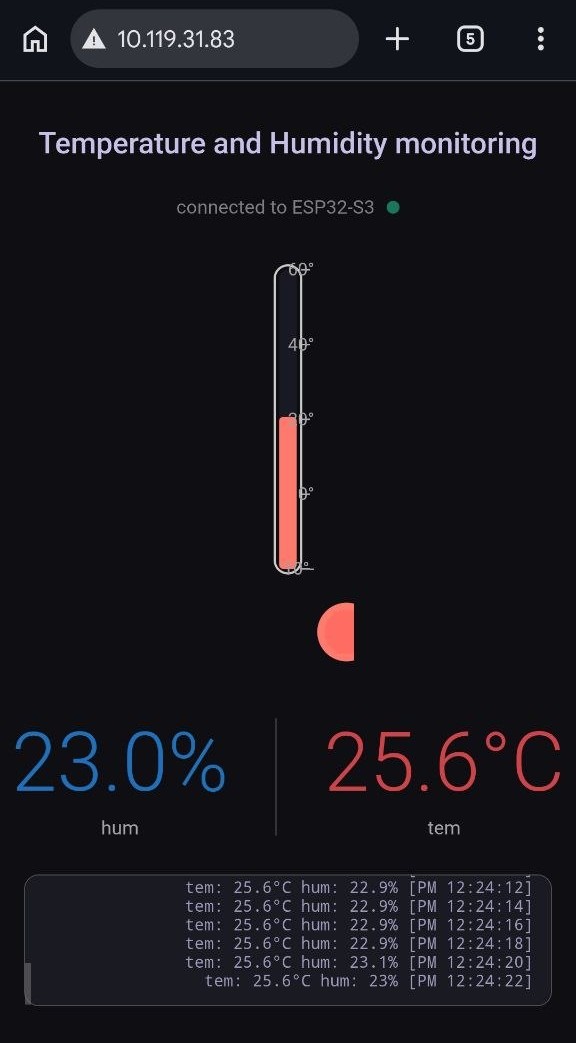
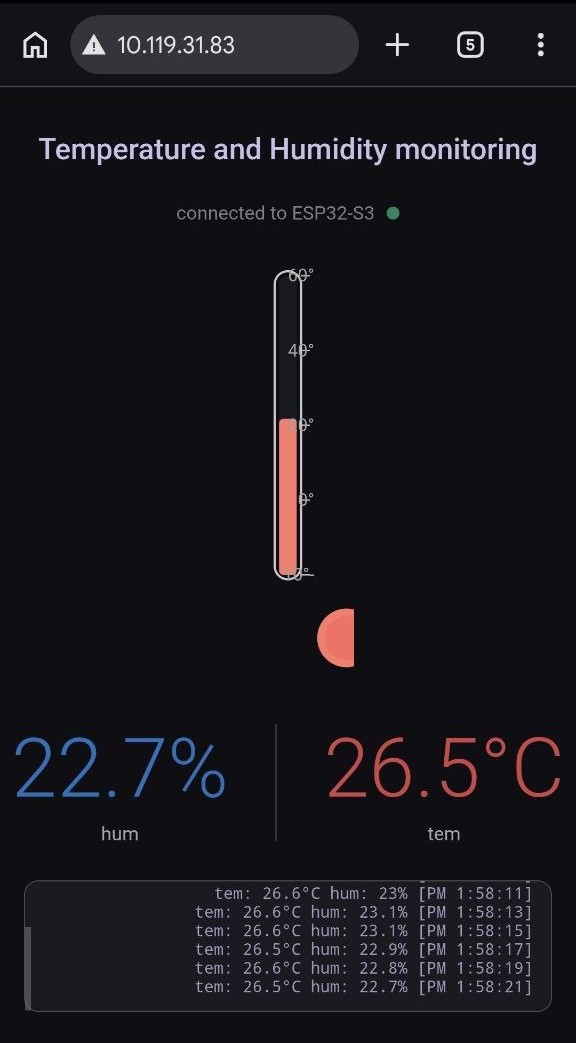
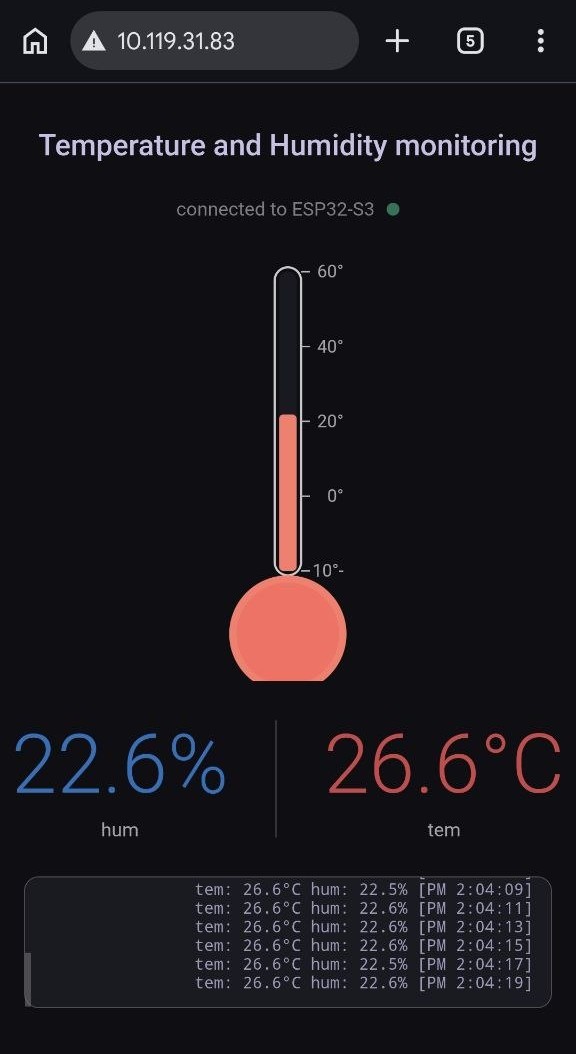
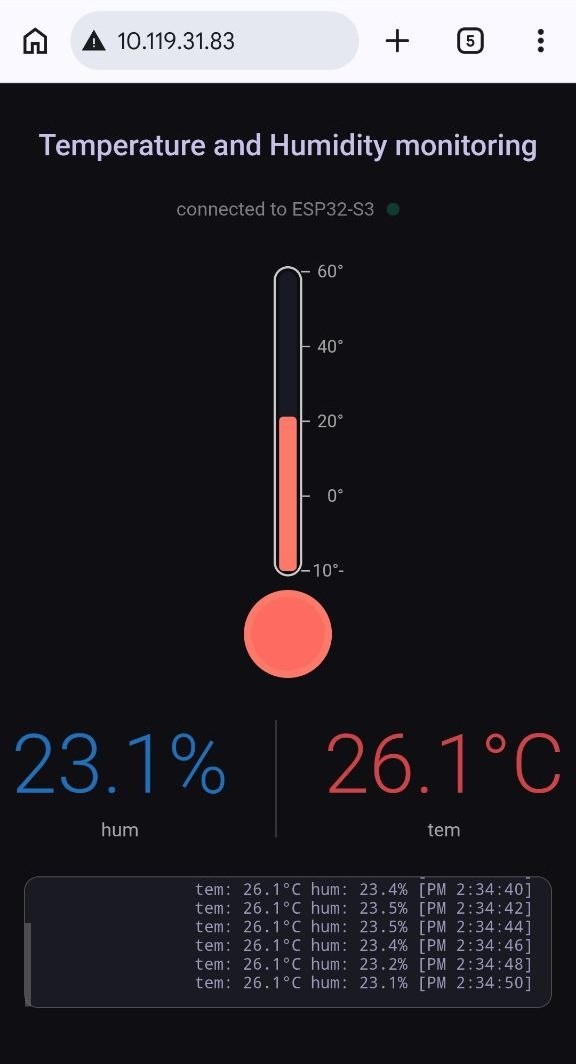
The most distinctive part of the UI is a custom SVG thermometer that visually represents temperature:
Tube height and color change dynamically according to temperature. Color shifts from blue (cold) to red (hot). Scale from -10°C to 60°C.
JavaScript logic:
const TUBE_TOP = 11, TUBE_H = 204, T_MIN = -10, T_MAX = 60;

function applyReading(t, h) {
  const ratio = Math.max(0, Math.min(1, (t - T_MIN) / (T_MAX - T_MIN)));
  const fh = Math.max(4, ratio * TUBE_H);           // fill height
  const by = TUBE_TOP + TUBE_H - fh;                // bar Y position

  // Dynamic color
  const rv = Math.round(100 + 155 * ratio);
  const gv = Math.round(80 - 70 * ratio);
  const col = `rgb(${rv},${gv},${gv})`;

  // Update SVG elements
  document.getElementById('bar').setAttribute('y', by);
  document.getElementById('bar').setAttribute('height', fh);
  document.getElementById('bar').setAttribute('fill', col);
  // ... bulb color too
}
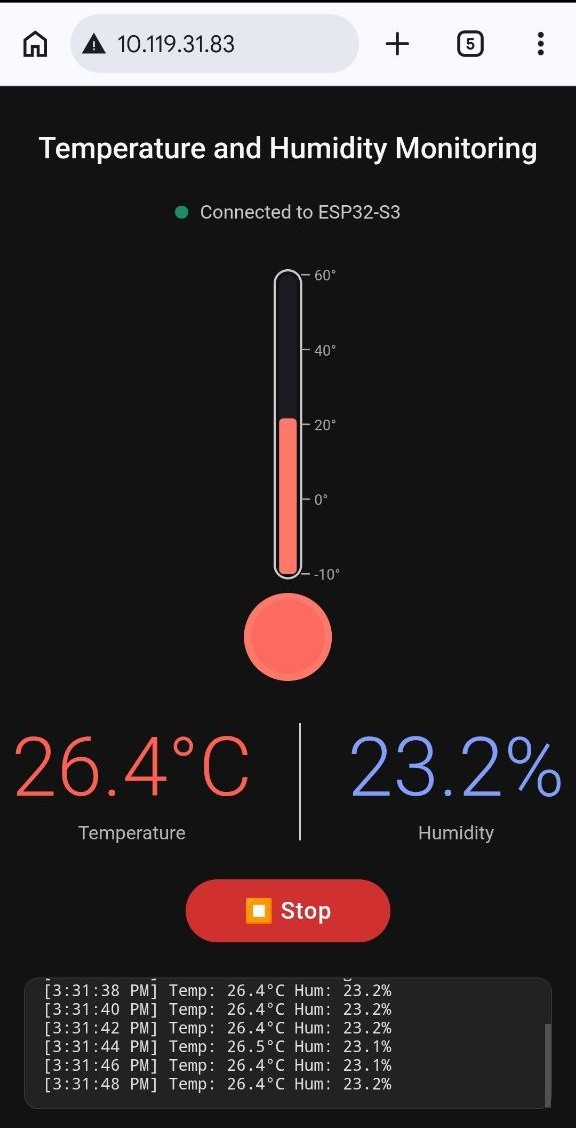
Digital Readings
-
Two large, clean value boxes:
-
Temperature (red) with 1 decimal place
- Humidity (blue) with 1 decimal place
3. WebSocket Communication
Real-time data is sent via WebSocket (/ws).
Client-side (JavaScript)
const socket = new WebSocket(`ws://${location.hostname}/ws`);

socket.onmessage = (e) => {
  if (!active) return;                    // respect Stop button
  const d = JSON.parse(e.data);
  applyReading(d.temp, d.hum);
  addLog(`Temp: ${d.temp}°C  Hum: ${d.hum}%`);
};
Server-side (C++)
// When client sends {cmd: "start"} or "stop"
if (msg.indexOf("start") > 0) {
streaming = true;
}
// In loop()
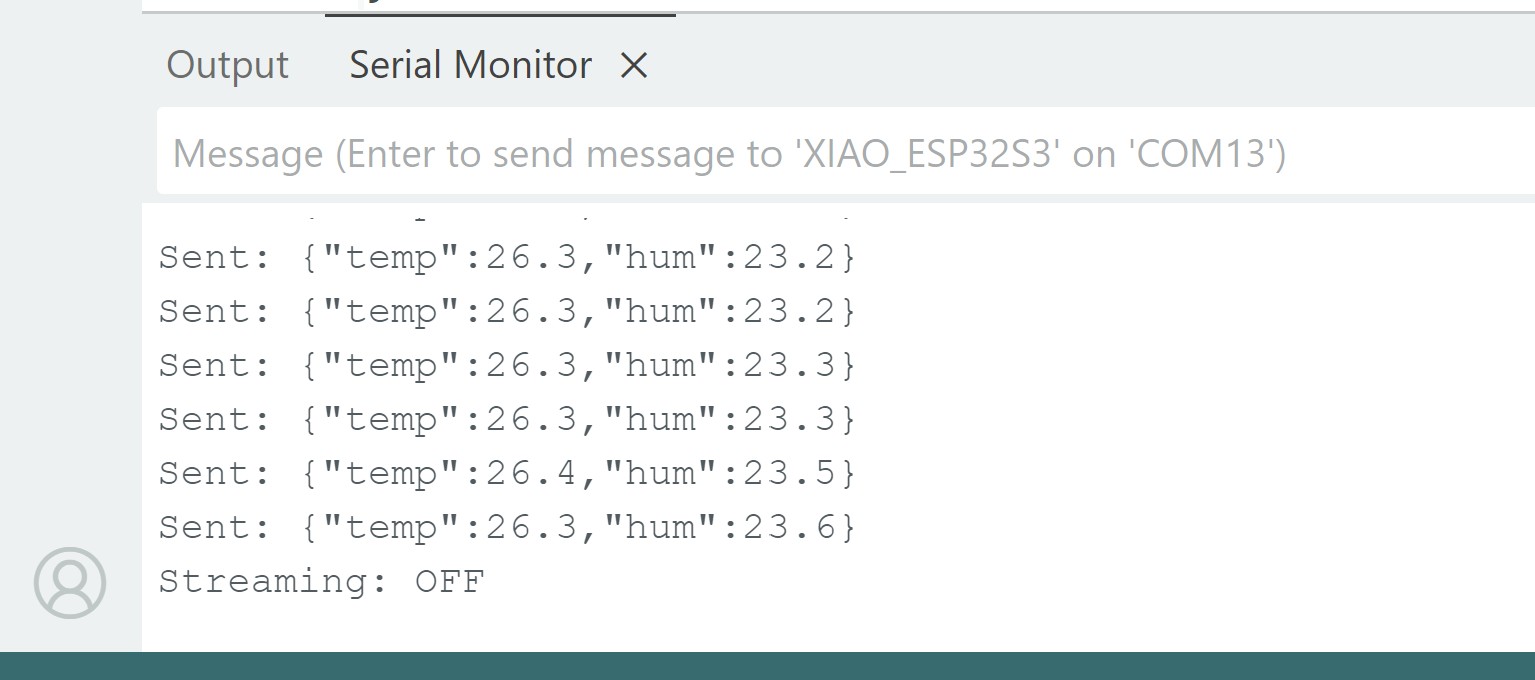
if (streaming && millis() - lastSend >= 2000) {
float t = dht.readTemperature();
float h = dht.readHumidity();
String json = "{\"temp\":" + String(t,1) + ",\"hum\":" + String(h,1) + "}";
ws.textAll(json); // broadcast to all connected clients
}
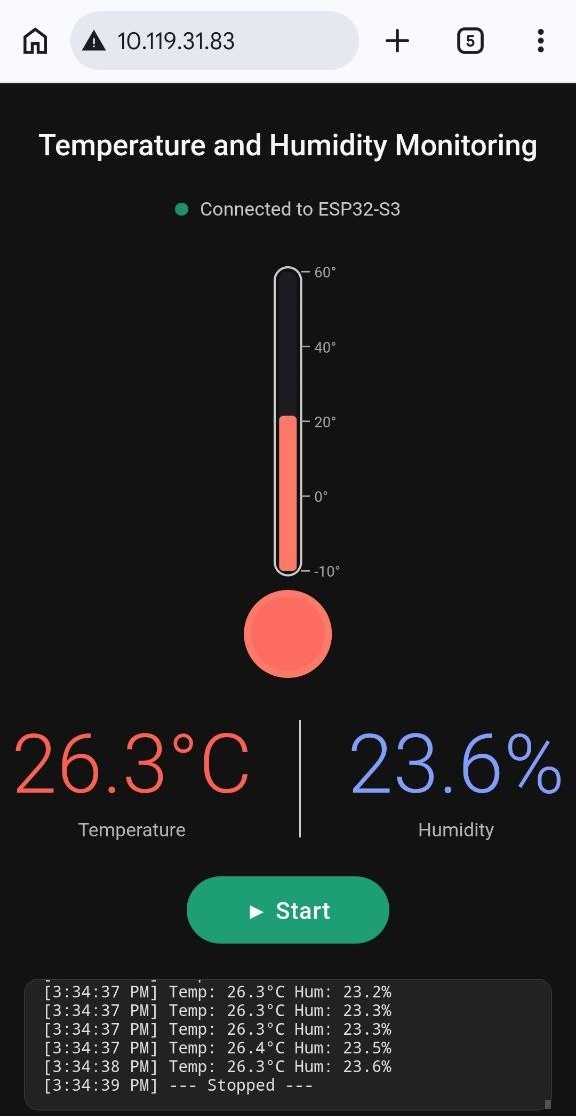
4. Start / Stop Control
The button toggles streaming on the client and tell the ESP32 to start or stop sending sensor data.
let active = false;

function toggleStream() {
  active = !active;
  const btn = document.getElementById('ctrl-btn');

  if (active) {
    btn.textContent = '⏹ Stop';
    btn.className = 'ctrl-btn stop';
    socket.send(JSON.stringify({cmd: 'start'}));
  } else {
    btn.textContent = '▶ Start';
    btn.className = 'ctrl-btn start';
    socket.send(JSON.stringify({cmd: 'stop'}));
  }
}
I included the full code in the File I created to download.
The sensor was sensitive enough to show the changes.
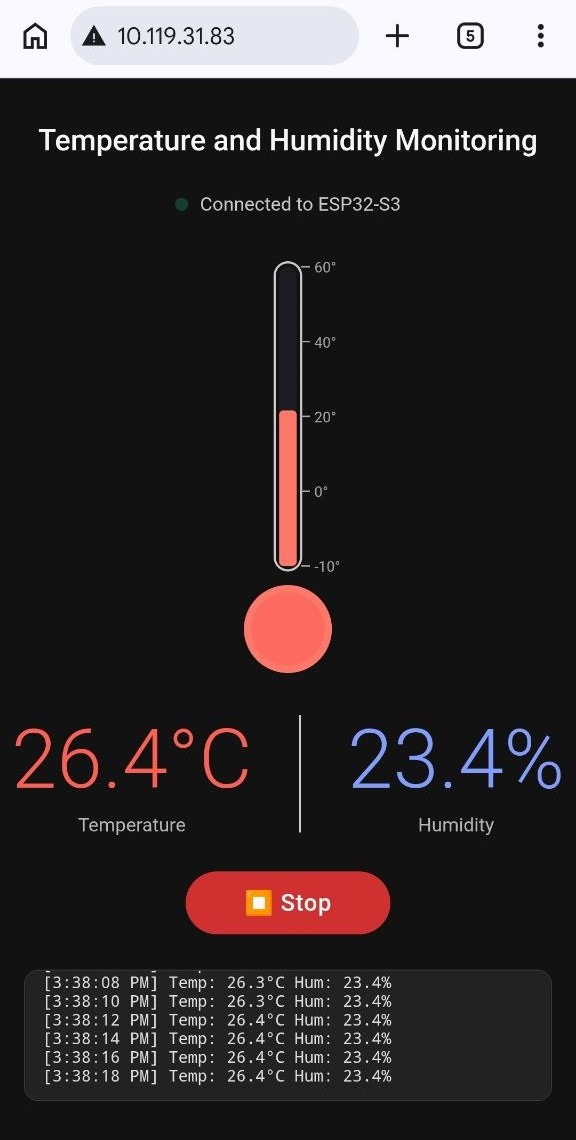
I recorded a short video of my first UI that I created and to me it was really enjoyable.
Reflection
This week was one of the most enjoyable and rewarding in the entire Fab Academy journey for me. Transforming raw sensor numbers into a beautiful, interactive web interface felt like completing the circle, from electronics design and production to a finished, usable application.
I really liked how the custom SVG thermometer dynamically changes color and height based on temperature. It made the data much more understandable at a glance compared to just numbers. Implementing WebSocket for real-time updates (every 2 seconds) without page refreshing was a big learning point and worked very smoothly.
The experience from previous weeks (especially Input Devices, Output Devices, and Networking) was extremely helpful. I could clearly see the progress in my skills: from simply reading a sensor to building a complete, responsive web application that runs on the ESP32 itself.
This assignment strongly supports my final project direction, as I now have the confidence to build intuitive user interfaces for monitoring systems.
Overall, Week 14 significantly improved my embedded development skills, from hardware to beautiful user interfaces.