Interfaces
Continued adventures in Processing, now with more Arduino!
Create an interface for an input or output device
Input device + Arduino to serial
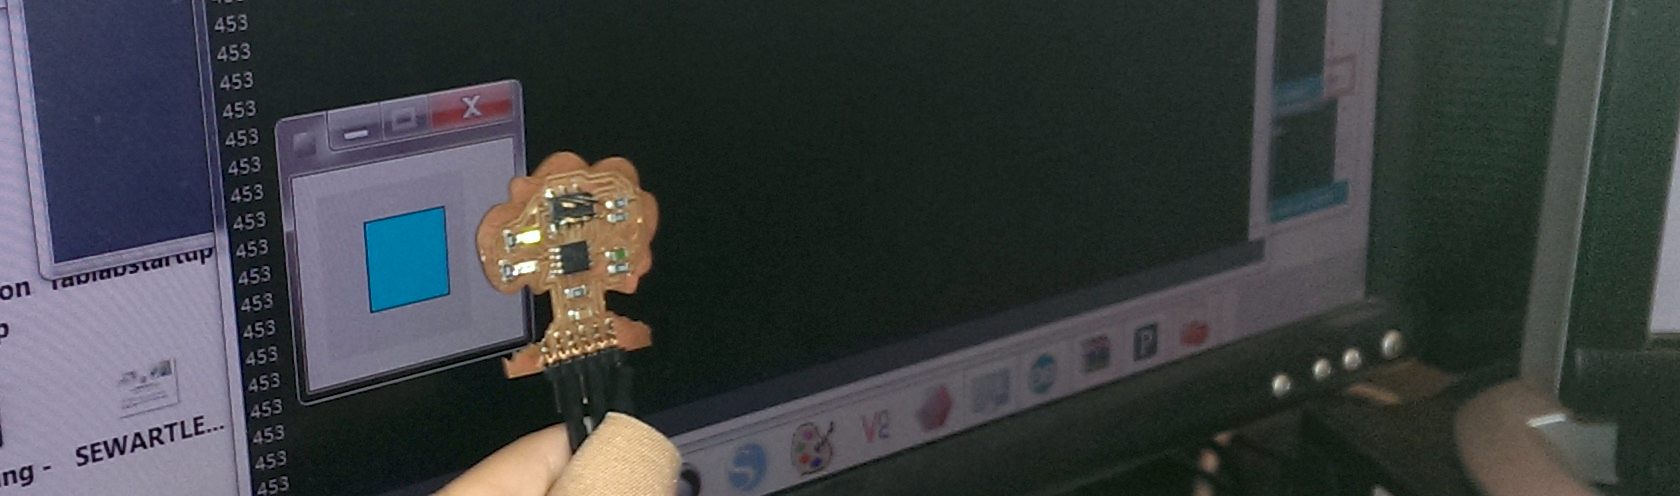
First I found my temperature sensor tree from input week and made sure it was talking to the serial port properly with the Arduino IDE. It sends numbers that go up when it gets cooler, so yay! My board has some indicator lights on it that switch from green to blue when it gets slightly above room temperature, so that I can double check the serial communication (and so that the sensor works independent of a computer interface).
Serial to Processing
The next stumbling block is to get form serial communication into Processing. Luckily there are people who have done it before, so the begining set up was pretty simple. I did run into a few stumbling blocks, though. At first I was getting some random two digit numbers when I was expecting sometimg over 500. Somehow, between three of us (Colten, Gabe and myself), we figured out that it was sending more bits per number than the serial.read() was expecting! Looking online, it seemed like there was no read() variation that would fix this. That would have been the most elegant solution... instead I had to read it in as a string, trim off all the white space, and then recast as an integer. Which works... but seems to run more slowly! Which seems weird. Plus it seems less reliable. Occasionally the signal will seem to stall, returning the same number over and over, when the temperature is changing, and the on board LEDs are changing to reflect the changing reading. Reseting the program, or re-pluging in the sensor will fix it, but it's a weird bug.
Processing and visualizations
I like making little processing sketches. Instead of a straight bar graph, I kind of liked the idea of having a changing color, so I mapped the hue to the sensor reading (minus a few hundred) so that it changes from green to blue and back. hooray, we have lift off! Or at least changing from blue to green and back with temperature changes.
I wanted to something a little different, so then I used another example script to load a buffer with the serial values and sent that to draw a pretty line along the window, like an oscilliscope reading temperature (or whatever your sensor happens to be reading). you may have to change the scale manually, since I set that manually after watching values for a bit. But you get help because my script also prints out the variable it's going to graph.
Final thoughts
I also looked around a bunch for simple code that looks beautiful for data visualizations, and was disapointed that my favorites were all written in javascript rather than java. Ah well. I'll have to stick to coding for myself for now, till I find repositories of beautiful charts, bubbles, and starbursts. All in all it was a lot easier to connect from serial to processing than I might have thought!