Overview<
Project Description<
Motivations<
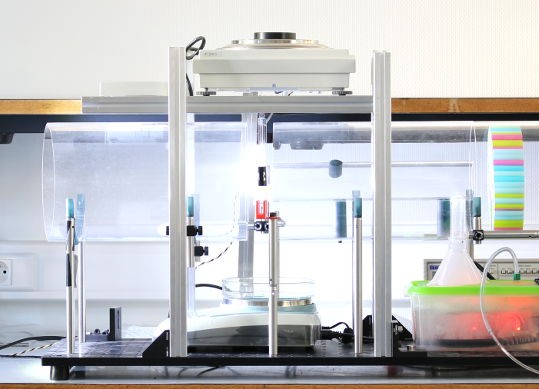
My ongoing PhD thesis is about understanding fog droplets motion around obstacles and more specifically trying to use these understandings to improve fog harvester. To conduct these research, our team is using a test bench that was built in the lab allowing one to simulate real conditions and test their prototypes.
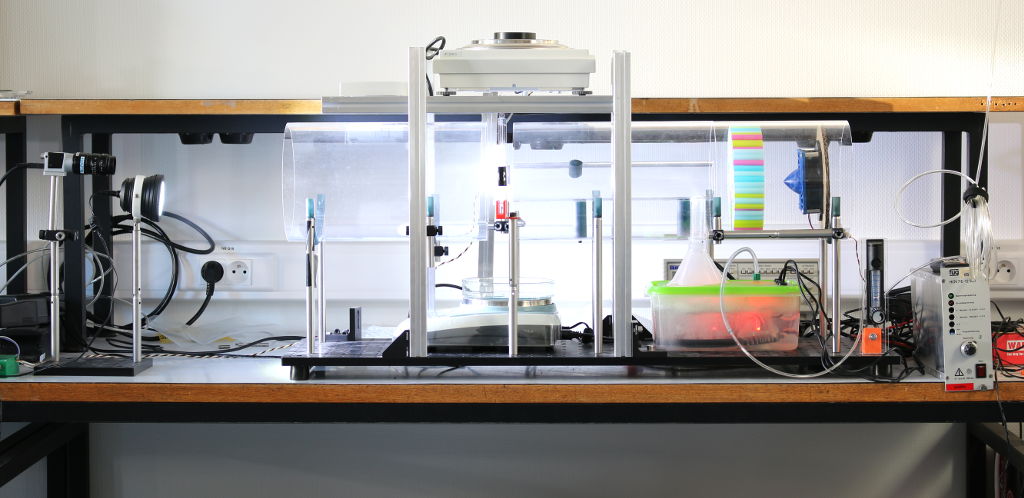
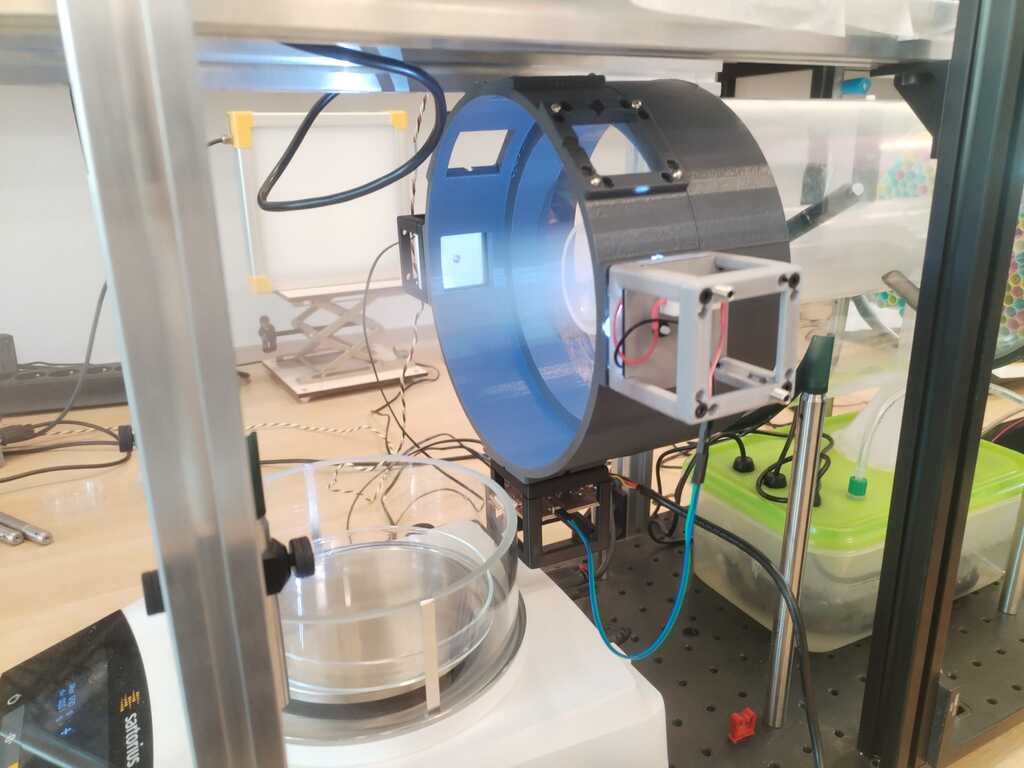
It is composed of a fog generator, a laminar air flow generator, two concentric plastic cylinders and two weighing scales. The fog created by the generator is carried away by the laminar air flow and passes around a hanging obstacle. The top weighing scale measures the mass of the fog water deposited on the obstacle while the bottom one measures the mass of the water drained and hence harvested.
A fog harvester efficiency is computed as the ratio between the incoming fog water mass rate and the harvested water mass rate. We easily measure the harvested water mass rate with a scale under the harvester however we can not yet measure the incoming fog water mass rate, at least not directly. For now we simply estimate it by measuring the water tank mass before and after our measurements and averaging the mass rate.
This measurement method is an issue for two main reasons. First, the efficiency of the nebulizer that creates fog depends on the water level and the fog generation process obviously uses water and make the water level decrease. The incoming water mass rate is hence not constant and the method we use to estimate its value is not accurate for large duration measurements. Second, the water mass rate leaving the tank is not the incoming fog water mass rate. Indeed there is loss on the way hence we overestimate it.
My Fab Academy final project goal is to solve at least one of these problem :
- Make the incoming water mass rate more constant
- Have a direct measurement of the incoming fog water mass rate
At first I started working on the water level control part with a water level sensor and a pump. However, at the beginning of the Week 9 I realised it would way simpler to use a purely mechanical system which would not work for a Fab Academy final project. I then started to work on the fog density measurement.
Theoretical Principle<
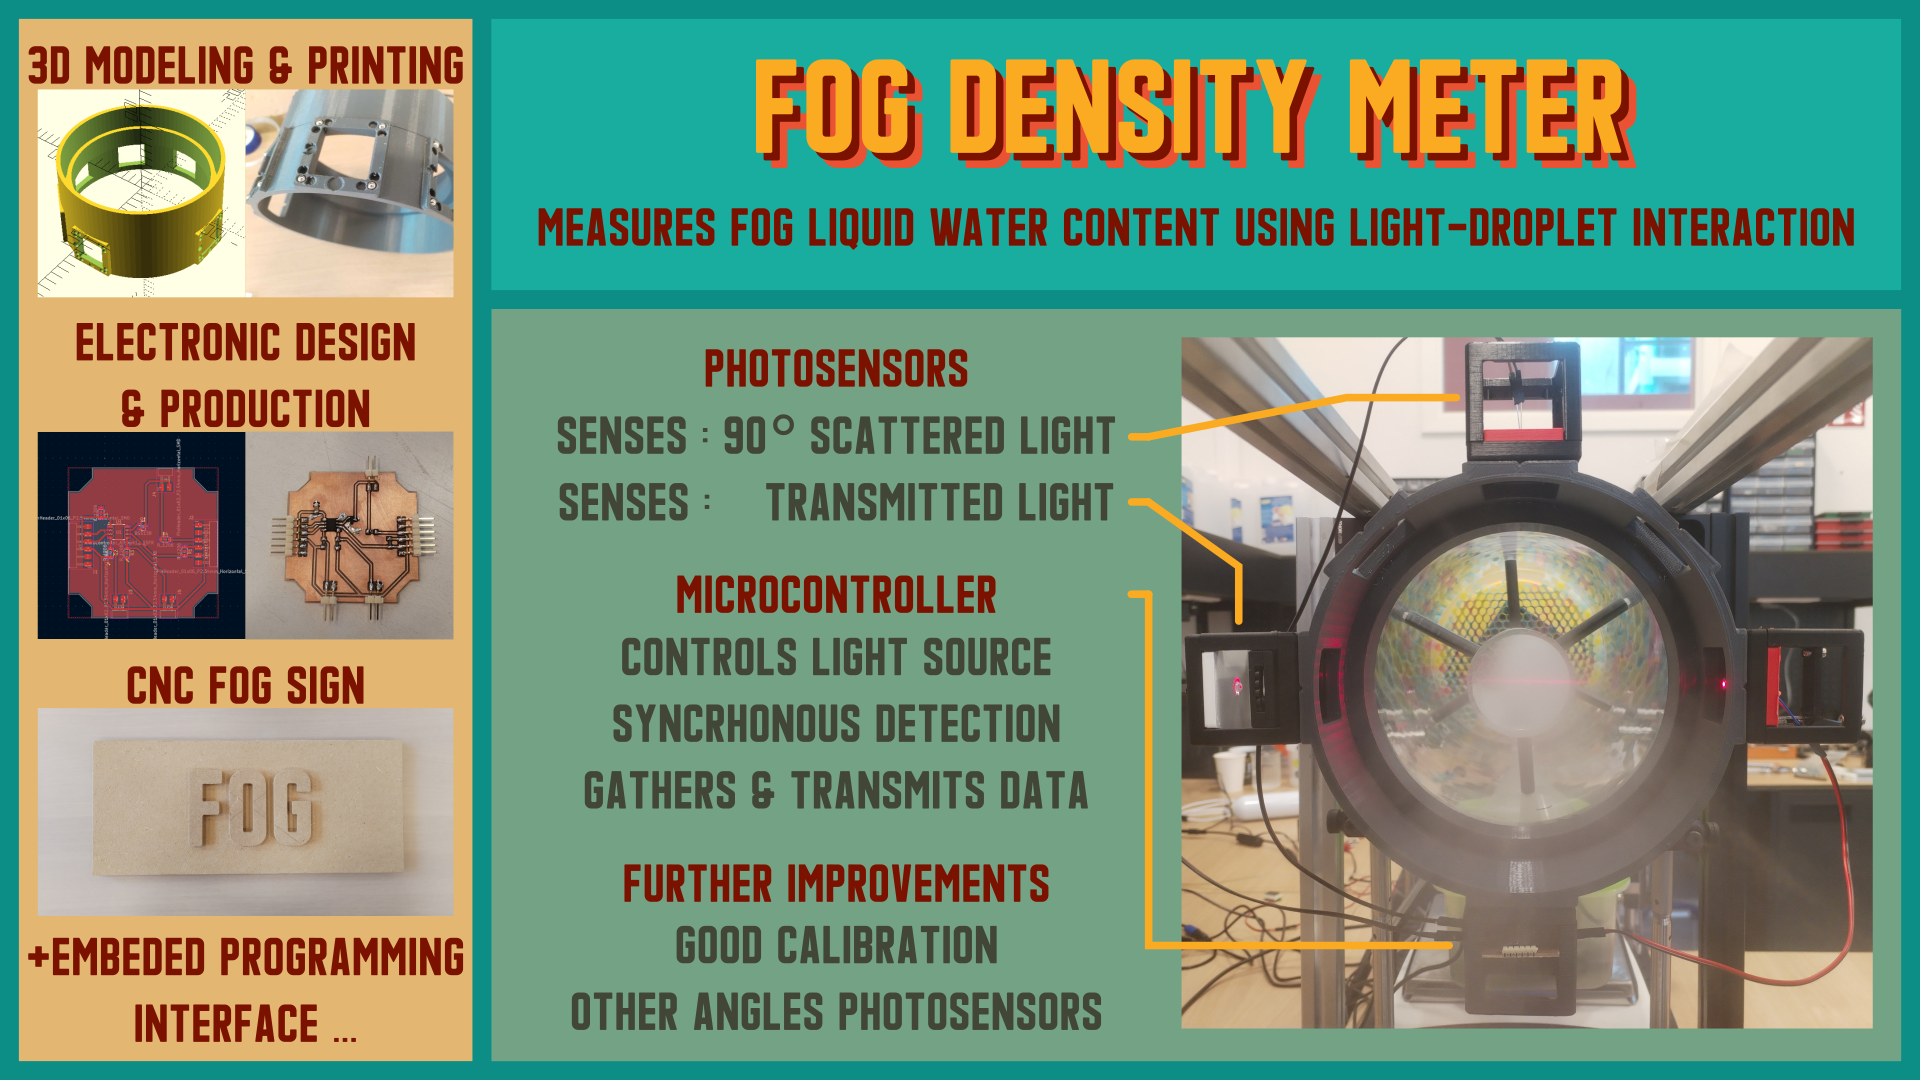
A common way to measure particles density in aerosols, called liquid water content (LWC [g/m³]), is to take advantage of light absorbtion and scattering by either measuring how much light is transmitted through the aerosol depending on its LWC or directly how much light is scattered. If one even manage to measure the directions at which the light is scattered, they could obtain informations about particles sizes distribution. In the fog case, particles are water droplets.
By installing a LED illuminating the fog and a photosensor on the other side, one could measure the light intensity diminution due to the presence of fog. One can show the following relation :
where \(S_0\) is the transmitted signal without fog and \(S\) with fog.
If one install a laser instead and an additional photosensor shifted by a certain angle from the first one's position, one could measure the light scattered at a specific angle. One can show the following relation :
where \(S_s\) is the scattered signal due to fog.
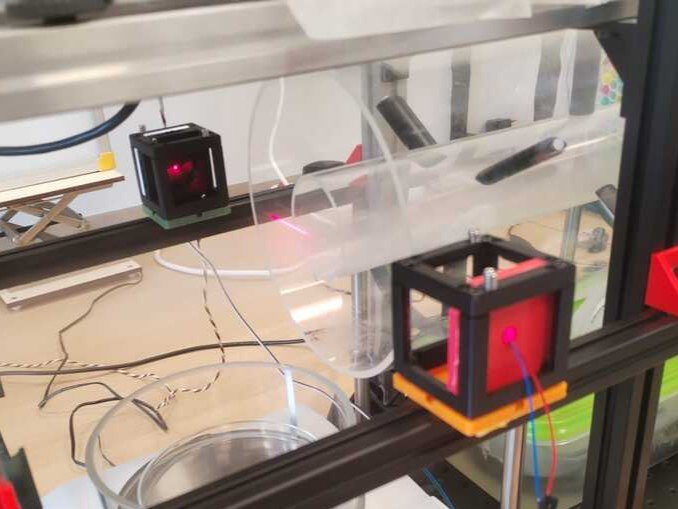
In order to obtain a better measurement and in anticipation for the moment I will need to characterize particles sizes distribution, I will develop a setup that allows me to use both methods. Therefore I will use a laser.
Setup Sketches<
Side View<
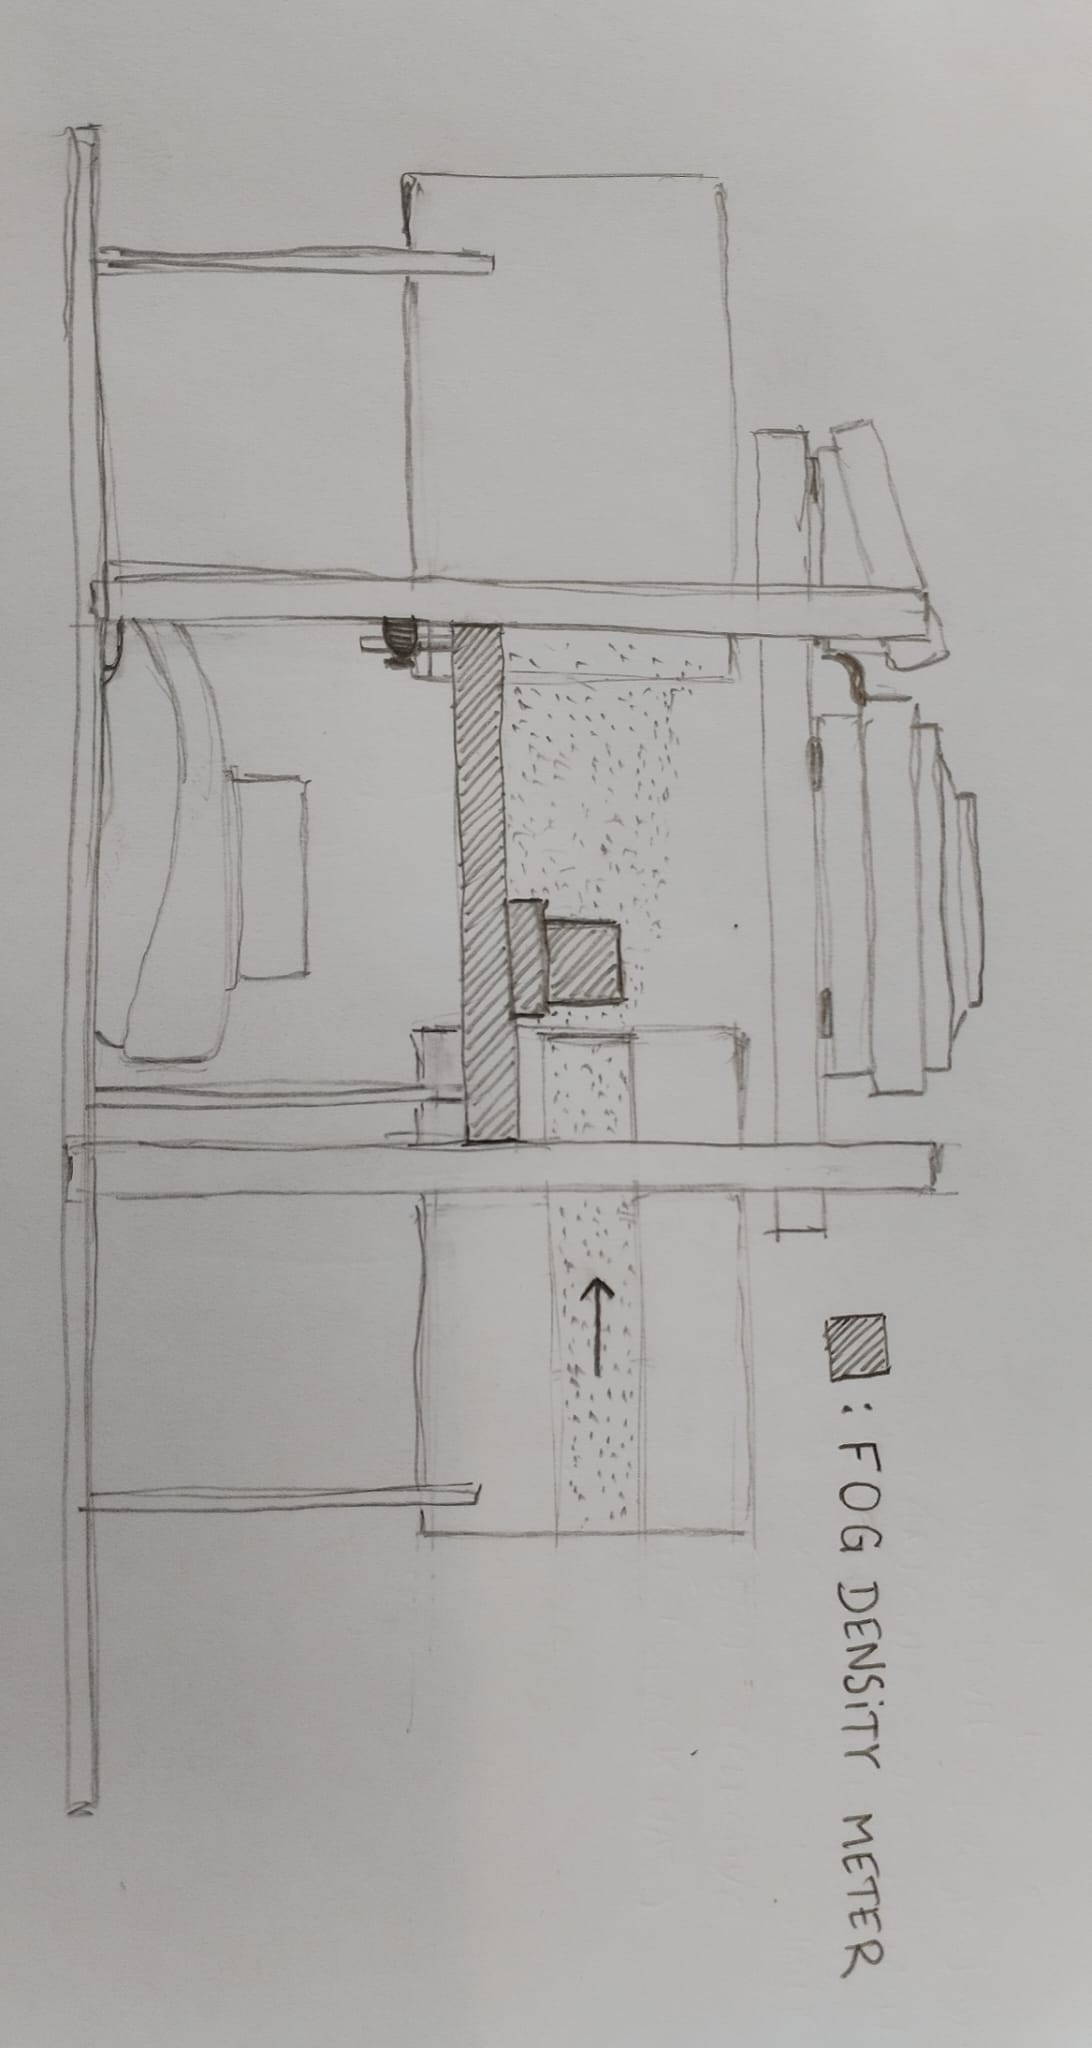
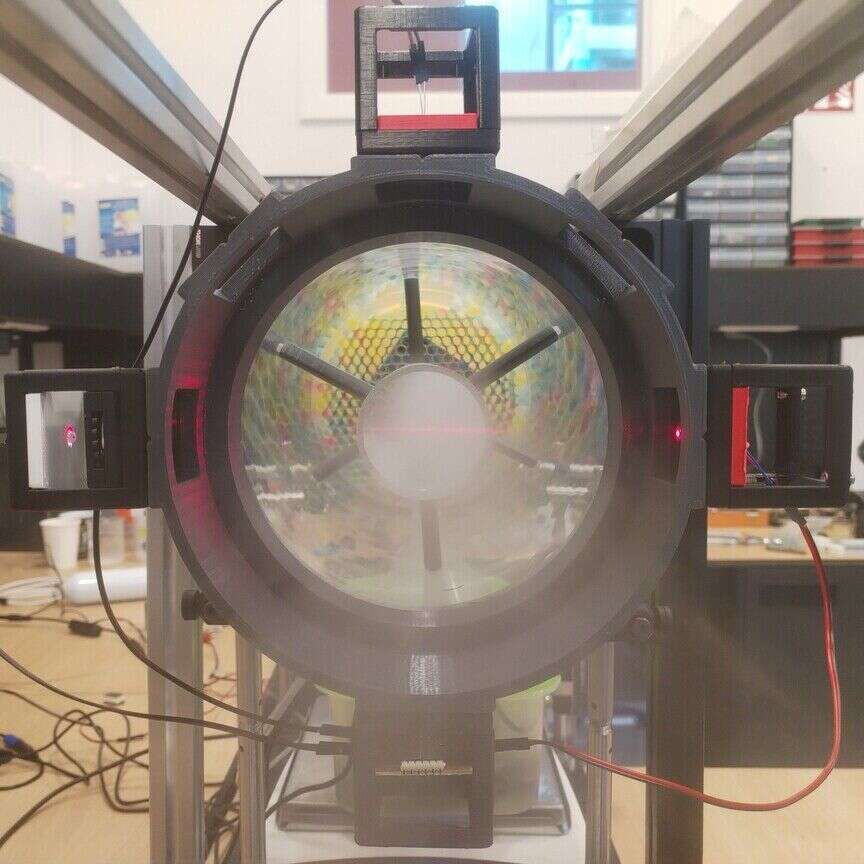
Front View<
System Diagram<
Hero Shots<
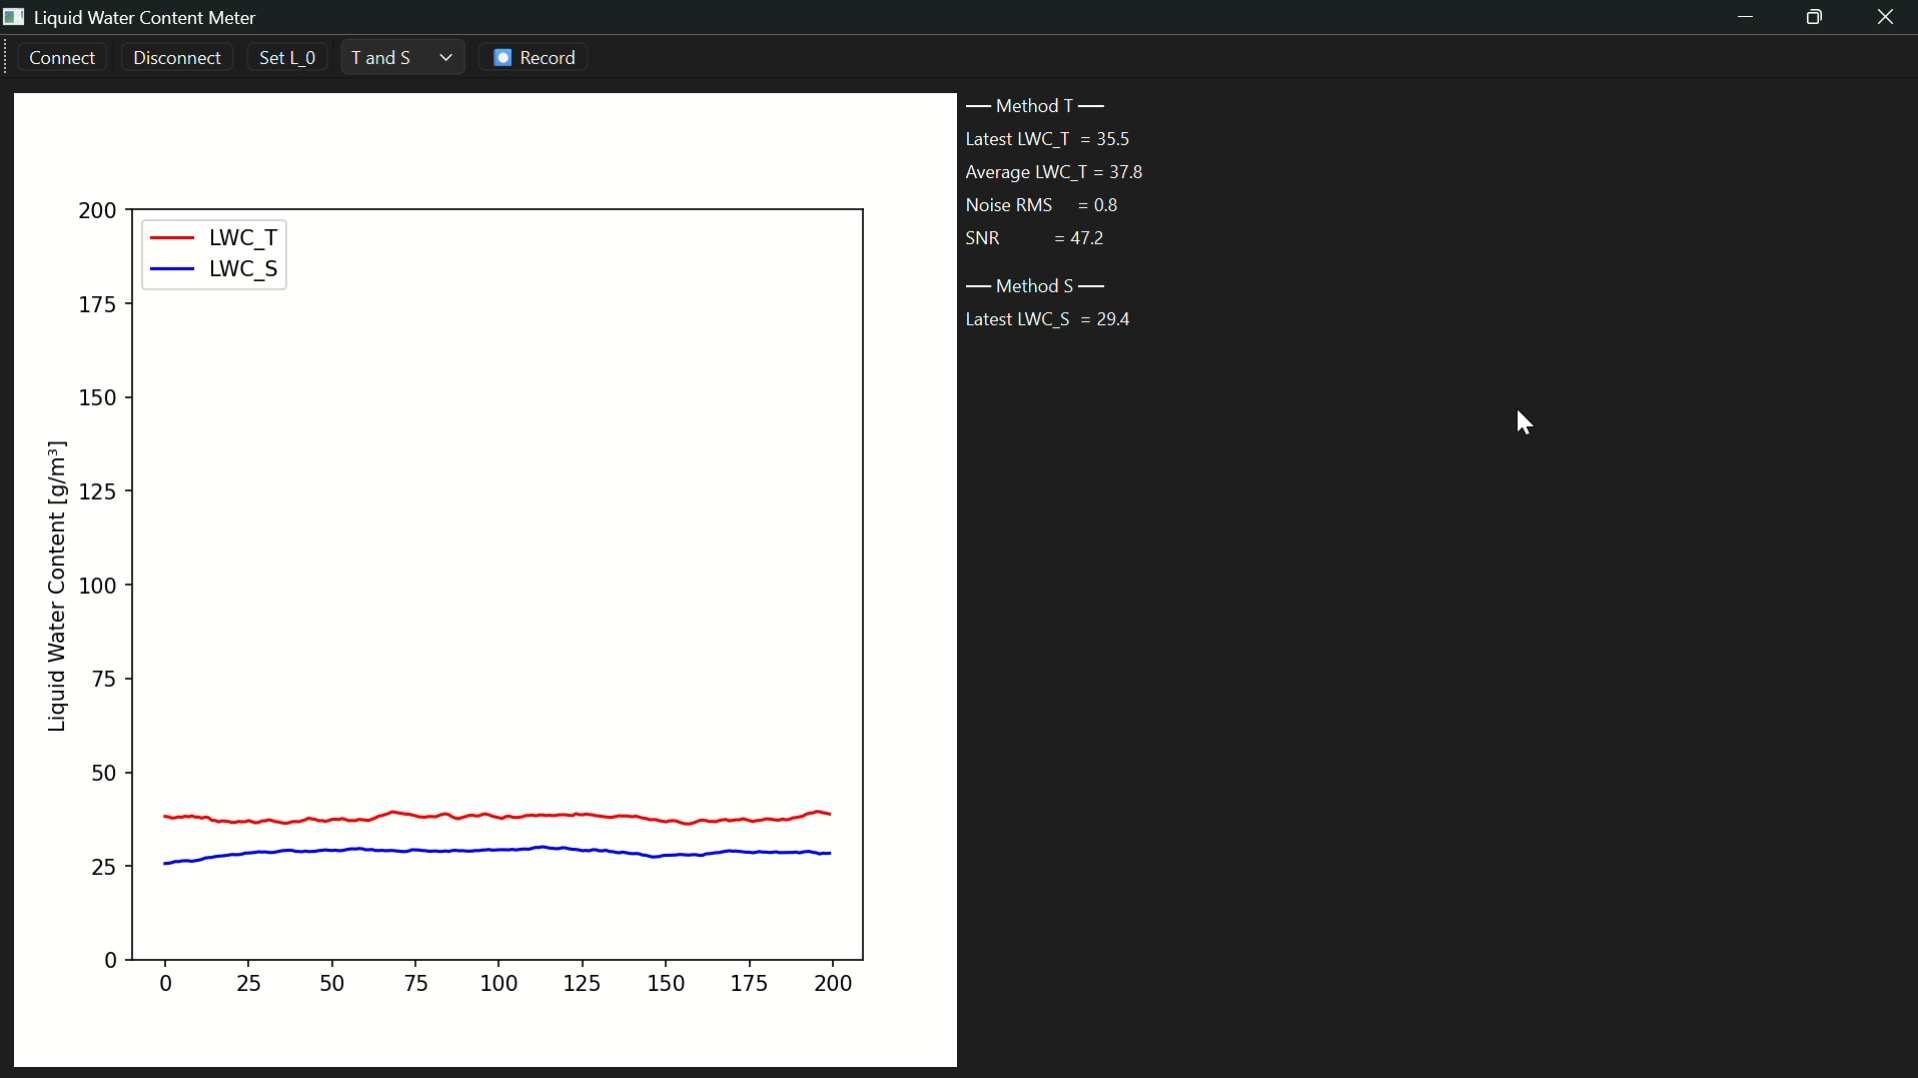
Interface<
Masterpiece Plan<
What does it do ?<
My final project will be a device measuring the liquid water content (g/m³) of the fog generated by our lab's test bench. This measurement will allow us to characterize more precisely the collect efficiencies of our net prototypes. Indeed, the latter are defined as a ratio of the collected water mass rate and the incoming water mass rate. Until now, we estimated the incoming water mass rate by looking at the mass difference of the water tank between the beginning and the end of the experiment.
Who's done what beforehand ?<
One should be carefull when talking nd searching about fog density because the tools and techniques to be used completely depends on the scale of the phenomenon one is studying.
For 10 meters to kilometer scale, visibility measurment can be used :
At a few centimeter scale like ours, the following article makes a comparative overview of the existing techniques :
The reviewed techniques can be shortly identified as :
- Average scattered laser flux
- Single particle counter (using light scattering)
- Wire resistance influenced by droplets impaction
- UV absorbtion
- Fog Collection
Visibility is never mentionned and the mainly used techniques are based on light scattering.
A frequently used device in researches is the FM-120 by Droplet Measurement Technologies, Envea Group as mentionned by :
- Narendra Nelli, Diana Francis, Rachid Abida, Ricardo Fonseca, Olivier Masson, Emmanuel Bosc, In-situ measurements of fog microphysics: Visibility parameterization and estimation of fog droplet sedimentation velocity, Atmospheric Research, Volume 309, 2024, 107570, ISSN 0169-8095
- L'Observatoire de Recherche Atmosphérique SIRTA
However, in the next research was developed a "homemade" fog liquid water content meter that also relies on light scattering :
What sources did I use ?<
Theory<
Scientific papers :
- Narendra Nelli, Diana Francis, Rachid Abida, Ricardo Fonseca, Olivier Masson, Emmanuel Bosc, In-situ measurements of fog microphysics: Visibility parameterization and estimation of fog droplet sedimentation velocity, Atmospheric Research, Volume 309, 2024, 107570, ISSN 0169-8095
- Kos, Gerard, and Kevin Noone. “Comparison of Techniques for Measurements of Fog Liquid Water Content.” Tellus B, 1992.
- Ovsenik, Lubos & Turán, Ján & Mišenčík, Pavol & Bito, Janos & Csurgai-Horváth, László. (2012). Fog density measuring system. Acta Electrotechnica et Informatica. 12. 10.2478/v10198-012-0021-7.
Research Center Documentation :
ScienceDirect :
Wikipedia :
AI chatbots :
3D Models<
What did I Design ?<
-
Printed Circuit Board
PCB DESIGN PICTURE
-
PCB Container
PCB CONTAINER PICTURE
-
Adapted UC2 Containers
UC2 CONTAINERS PICTURE
-
UC2 Crown Support
UC2 CROWN SUPPORT PICTURE
-
Interface
INTERFACE SCREENSHOT
Bill of Materials<
The materials were ordered years ago. The elctronics were ordered on one of the two websites below :
The mechanical materials were ordered on one of the websites below :
- ???
- ???
| Parts | Materials and Components | Quantity | Cost |
|---|---|---|---|
| Electronics | Copper Plate | 1 | |
| AtTiny412 | 1 | ||
| Resistor | 4 | ||
| Capacitor | 1 | ||
| Transistor | 1 | ||
| 6-Pin Headers | 2 | ||
| 2-pin Headers | 3 | ||
| Laser | 1 | ||
| LED | 1 | ||
| Phototransistor | 2 | ||
| PCB Container | PLA | ||
| Screws | |||
| UC2 Containers | PLA | ? g | |
| Screws | 32 | ||
| UC2 Crown | PLA | ? g | |
| Magnets | 24 | ||
| Felt Textile | 5cm² | ||
| System Integration | Wires | ||
| FTDI Cable |
What processes were used ?<
The digital fabrication processes will be :
- 3D printing
- Laser Cutting
- PCB milling
The electonics production processes will be :
- Manual Soldering
What questions still need to be answered ?<
- Does my final project give repeatable and replicable measurements ?
- Can it work during more than one hour ? two hours ? three hours ?
- Is it easy to use for someone else ?
How will it be evaluated ?<
Since my final proect is a measurement tool that I will use for my research, it has to be evaluated as a measurement tool :
- Does it give repeatable and replicable measurements ?
- Does it give good measurements (no bias) ?
- Does it give accurate measurements (not too much noise) ?
License and Usefull Files<
The whole project license is the Creative Commons CC BY-NC-SA. Below you may find the usefull files to reproduce the project. Click to download :