Week 14: Interface and Application Programming — Rich MQTT Dashboard
Note: My English writing skills are limited. For this documentation, I have used AI assistance for parts of the translation.
Date: April 22 - 28, 2026
Group Assignment
Our group compared as many interface and application development tools as possible. We organized them into categories: native desktop, native mobile, cross-platform, creative coding, game engines, and low-code tools.
What I Learned
- There are many tool options for building interfaces — the right choice depends on the target platform, required connectivity (network, Bluetooth, serial, sensors), and difficulty level.
- Comparing tools by "connectivity" was especially useful. Tools like Processing and p5.js have strong sensor integration, while native mobile tools are better for Bluetooth and GPS.
- Low-code tools (like Node-RED) are fast to build with, but custom logic is harder to add.
What I Made This Week
I built a real-time monitoring and control web dashboard for my reptile terrarium.
In Week 11, I made a basic MQTT implementation: sensor display and one fan ON/OFF control. This week I rebuilt it into a full UI that can be used in my final project.
Dashboard URL (local): http://192.168.11.201:8002/files/week14/dashboard/index.html
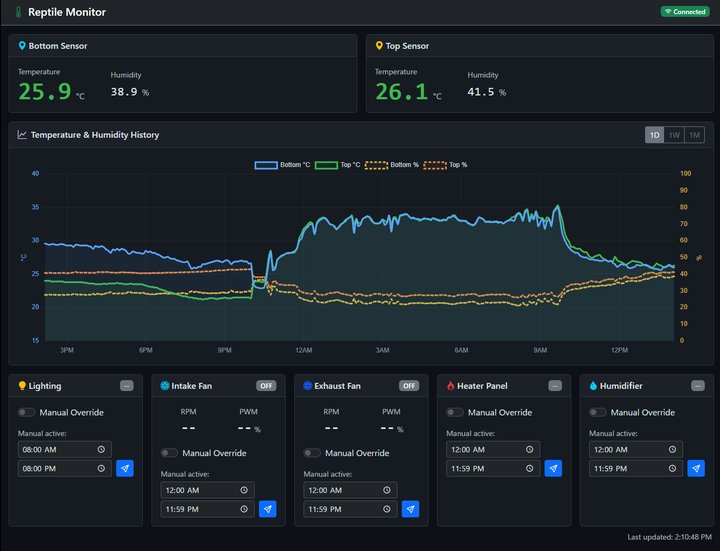 The completed dashboard — sensor display, history graph, and 5 output controls
What Changed from Week 11
| Item | Week 11 | Week 14 |
|---|---|---|
| UI framework | None (plain HTML) | Bootstrap 5.3 |
| Graph | None | Chart.js 4 (temperature & humidity history) |
| History storage | None | Flask + SQLite (up to 1 month) |
| Devices controlled | 1 fan | 5 devices (light, intake fan, exhaust fan, heater, humidifier) |
| Schedule | None | Time-range setting (manual override hours) |
| Deployment | NAS nginx | NAS nginx (same URL as Week 11) |
System Architecture
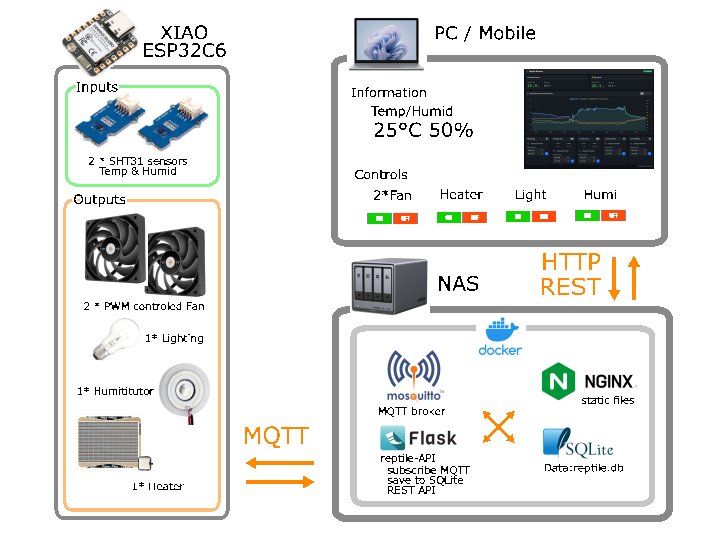 System architecture — ESP32C6 (device) → MQTT → NAS Docker → Browser
The system has three layers:
- Device layer — XIAO ESP32C6 reads two SHT31 sensors every 30 seconds and publishes data via MQTT. It also receives control commands from the browser.
- Server layer — A Docker container on the NAS runs Mosquitto (MQTT broker), a Flask API (history data), NGINX (static files), and SQLite (database).
- Browser layer — The dashboard connects to Mosquitto via WebSocket for real-time data, and calls the Flask REST API to fetch history.
Technologies Used
Frontend
Bootstrap 5.3
- Purpose: UI components (cards, buttons, switches, grid) and responsive layout
- Why I chose it: Faster to build consistent UI than writing CSS from scratch. Adding
data-bs-theme="dark"enables dark mode with one line. - Key features used:
row-cols-5(5-column equal grid),form-switch(toggle switch),btn-group(ON/OFF buttons)
Bootstrap is easy to use. You just add class names to HTML — no CSS writing needed. The grid system makes the layout change automatically for different screen sizes.
Chart.js 4 + chartjs-adapter-date-fns
- Purpose: Time-series graph for temperature and humidity history
- Why I chose it: Canvas-based and lightweight. Time axis (
type: 'time') and dual Y-axis (left: °C / right: %) are built-in features. - Key detail: I enabled
decimation: { algorithm: 'lttb' }to automatically thin out data points. This keeps rendering fast even with 1 month of data (~8,600 records). - Why the adapter is needed: Chart.js cannot format dates on the time axis by itself. Adding
chartjs-adapter-date-fnsenables formats likeMM/dd HH:mm.
MQTT.js 5
- Purpose: Connect the browser to the MQTT broker to receive real-time data and send control commands
- Why I chose it: Browsers cannot use raw TCP MQTT — they need MQTT over WebSocket. MQTT.js is the standard library for this. It can be added with one CDN line.
Backend
Flask (Python)
- Purpose: REST API server that returns history data
- Why I chose it: Lightweight and simple. I only needed 1–2 endpoints, so a large framework like Django was not necessary. Python also works well with the paho-mqtt library.
- Endpoints:
GET /api/history?range=1d— returns up to 1 day of data from SQLiteGET /api/health— health check
SQLite
- Purpose: Store sensor history data
- Why I chose it: No server needed — it is a single file. For about 8,640 records (1 month of data), performance is fine. It is easy to persist as a Docker volume.
- Design: Data is saved in 5-minute buckets. Values within the same 5-minute window overwrite each other, so the database does not grow without limit.
paho-mqtt (Python library)
- Purpose: The Flask backend subscribes to the MQTT broker to receive sensor data
- Why I chose it: The de facto standard MQTT client for Python
Eclipse Mosquitto (Docker container)
- Purpose: MQTT broker — the message relay server
- Why I chose it: Lightweight and simple. An official Docker image is available. I reused the same broker from Week 11.
- Key config: Adding
listener 8083+protocol websocketsallows browser (WebSocket) connections.
Dashboard Features
Sensor Display (top row)
- Shows real-time temperature and humidity for Bottom Sensor and Top Sensor
- Updates immediately when an MQTT
reptile/sensormessage arrives - Temperature color changes by state: low = blue / normal = green / high = red
Temperature & Humidity History Graph (middle)
- Switch between 1D / 1W / 1M views
- Left Y-axis: temperature (°C), right Y-axis: humidity (%)
- 4 datasets: Bottom °C (blue solid), Top °C (green solid), Bottom % (amber dashed), Top % (orange dashed)
- Data fetched from the backend API
Output Controls (bottom row — 5 cards)
Each device has these controls: - Manual Override toggle: When ON, manual control is active - Time range: Set the hours during which manual override is active - Apply button (send icon): Sends the settings via MQTT
Device-specific controls: - Intake Fan / Exhaust Fan: PWM slider (0–100%) + RPM display - Lighting / Heater / Humidifier: ON / OFF buttons
MQTT Topics
| Topic | Direction | Content |
|---|---|---|
reptile/sensor |
ESP32C6 → Browser / Flask | Temperature & humidity JSON (every 30 s) |
reptile/light/cmd |
Browser → ESP32C6 | Lighting control command |
reptile/fan_in/cmd |
Browser → ESP32C6 | Intake fan control (includes PWM) |
reptile/fan_ex/cmd |
Browser → ESP32C6 | Exhaust fan control (includes PWM) |
reptile/heater/cmd |
Browser → ESP32C6 | Heater control command |
reptile/humidifier/cmd |
Browser → ESP32C6 | Humidifier control command |
MQTT Code Example
This was my first time using MQTT. I got help from AI to understand how it works.
// Receive sensor data
client.subscribe('reptile/sensor');
client.on('message', (topic, payload) => {
  const data = JSON.parse(payload.toString());
  updateDisplay(data.temp_bottom, data.hum_bottom);
});

// Send a control command
function sendFanCommand(pwm) {
  const cmd = JSON.stringify({ manual: true, pwm: pwm });
  client.publish('reptile/fan_in/cmd', cmd);
}
Getting History Data from Flask
fetch('/api/history?range=1d')
  .then(res => res.json())
  .then(data => updateChart(data));
Deployment
The system runs in Docker on the NAS.
# docker-compose.yml (excerpt)
services:
  reptile-api:
    image: reptile-api
    network_mode: host        # host mode to avoid port conflicts with other containers
    volumes:
      - reptile-data:/data    # persist the SQLite file
    restart: unless-stopped
I used network_mode: host to avoid port conflicts with other containers already running on the NAS.
🔗 Connection to Final Project
This dashboard is the control interface for my Smart Reptile Habitat System.
The ESP32C6 on the Reptile Monitor PCB (built in Week 8) publishes sensor data and receives commands. The dashboard runs on the NAS and is accessible from any browser on the local network.
I used the Reptile Monitor PCB from Week 8. Heater and lighting control were planned at this stage. The final wiring was decided later in the project.
Hero Shot — System in Action
🔧 Problems and Solutions
Problem: Browser could not connect to MQTT
What happened: The Mosquitto broker only listened on TCP port 1883. Browsers cannot use raw TCP MQTT — they require WebSocket.
Solution: Added listener 8083 and protocol websockets to the Mosquitto config. The browser now connects on port 8083 via WebSocket, while the Flask backend uses port 1883 via TCP.
Problem: Fan card time inputs overflowed the card
What happened: With the 5-card horizontal layout (each card at 20% width), the two time inputs and Apply button in a single row overflowed outside the card.
Solution: Stacked the two time inputs vertically inside a flex-fill div, with the Apply button aligned to the right. This fits within the narrow card width.
What I Learned
- I compared several UI frameworks (Bootstrap, Tailwind CSS, plain HTML) and chose Bootstrap 5.3. Its built-in dark mode and responsive grid made it the right choice for a control dashboard.
- I compared database options for time-series data (InfluxDB, TimescaleDB, SQLite) and chose SQLite. For ~8,600 records per month, a simple file-based database was enough and easy to run in Docker.
- I compared MQTT browser libraries (MQTT.js, Paho) and chose MQTT.js 5. It supports WebSocket connections, which browsers require for MQTT communication.
Development
I wrote all the frontend code in VS Code. The biggest challenge was MQTT over WebSocket — the broker configuration and browser connection were new to me. I used AI assistance to understand the MQTT.js API and how to structure the topic-based command system.
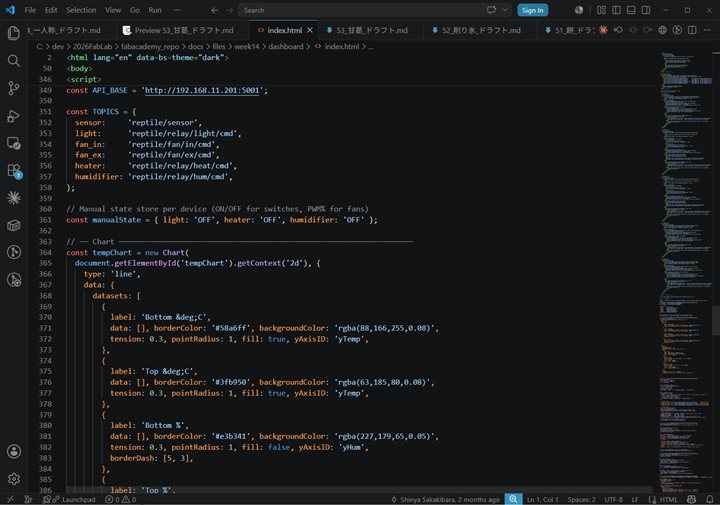 Writing the dashboard JavaScript in VS Code — MQTT.js connection and Chart.js setup
📦 Source Code
Download all source files as a ZIP archive:
- week14_source.zip — Dashboard (HTML) + Backend (Flask, Docker)
Individual files:
- dashboard/index.html — Frontend dashboard
- backend/app.py — Flask API server
- backend/docker-compose.yml — Docker Compose config
- backend/Dockerfile — Docker image definition
- backend/requirements.txt — Python dependencies
📚 References
- Fab Academy: Wildcard Week
- Week 11: Networking and Communications
- Bootstrap 5.3
- Chart.js
- MQTT.js
- Eclipse Mosquitto
Last updated: April 28, 2026