SensorSense
The SensorSense app is an Android application developed using Unity that serves as a tool for visualizing data acquired from a device’s sensors. The app allows real-time data visualization, streaming data over local networks, and saving data in various formats.
You can find the documentation for this project here
Functionality Overview
Sensor Integration
The app integrates with multiple device sensors, including:
- Gyroscope
- Accelerometer
- Microphone
- GPS
- Light Sensor (using custom Android Java interface due to Unity’s limitations)
Each sensor is represented as a subclass of the abstract class Sensor.
Real-Time Data Visualization
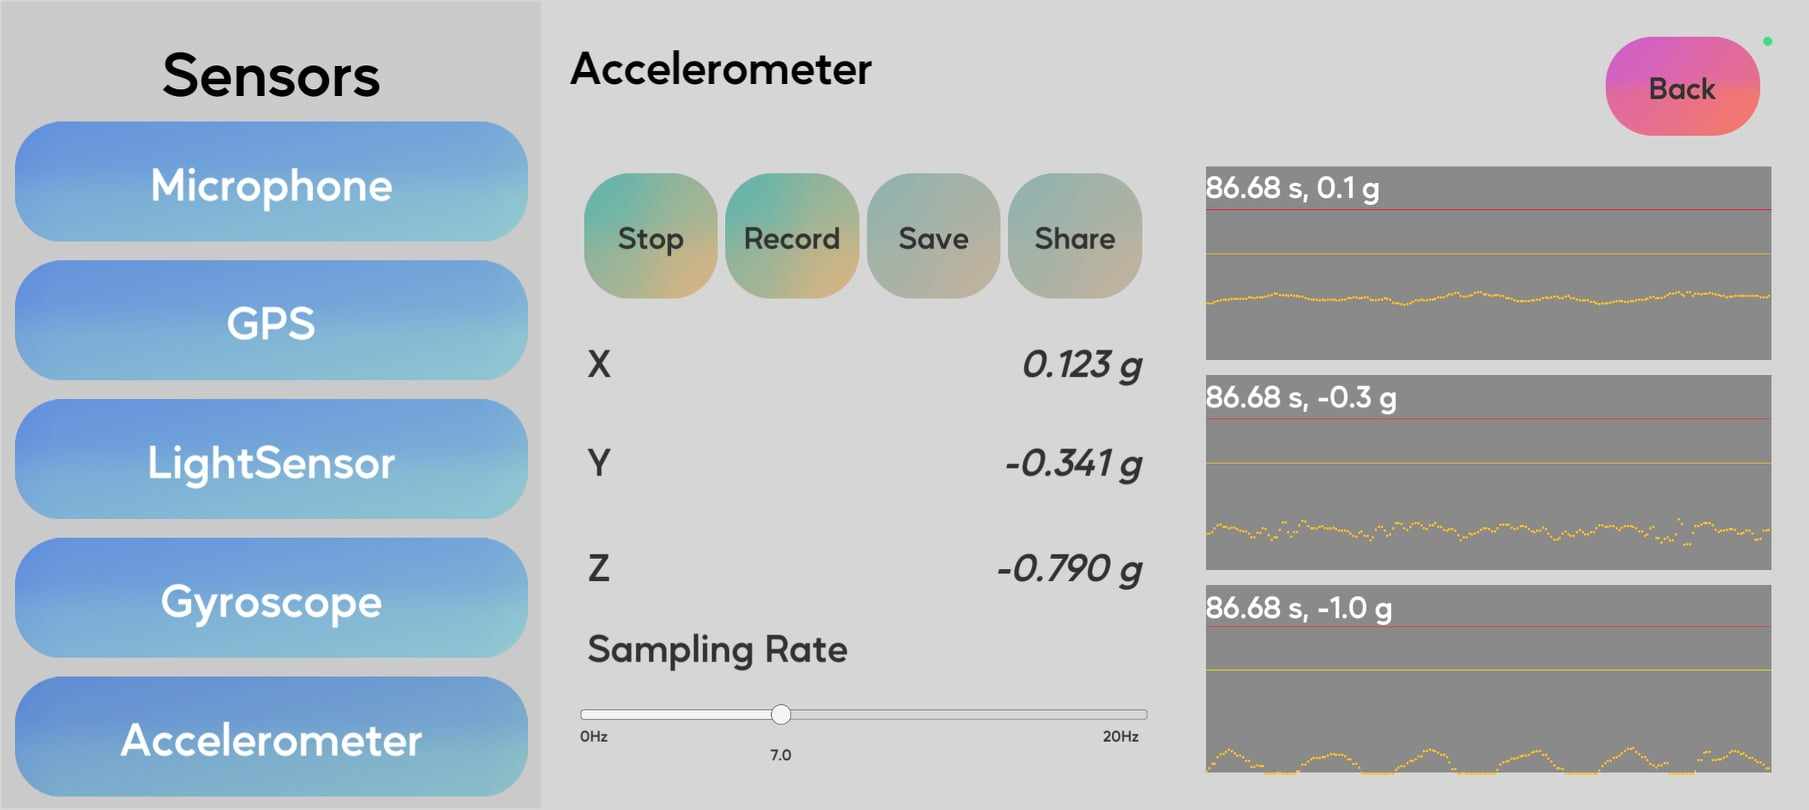
The SensorSense app features real-time data visualization using the LineGenerator class. This class draws graphs by utilizing Unity’s OnGUI functionality. The illustrate sensor data, such as accelerometer readings on the screen.
Data Streaming and Saving
The SensorSense app also enables data streaming over local networks using UDP protocol. This allows users to share sensor data with other devices in real time. Additionally, the app can save the acquired data to .csv files directly on the Android device.
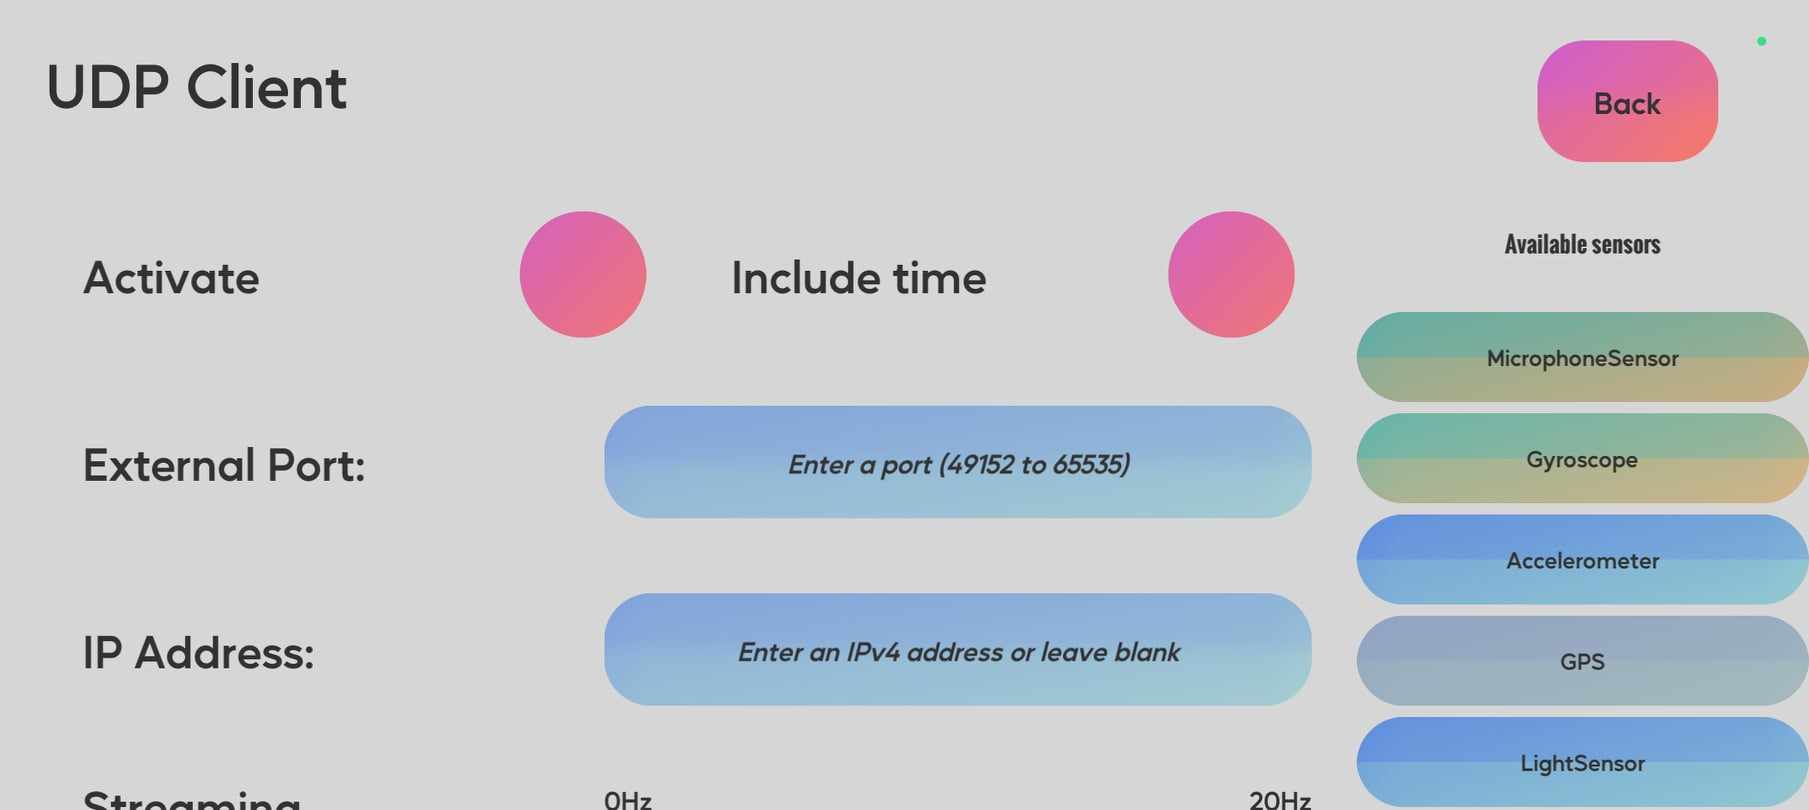
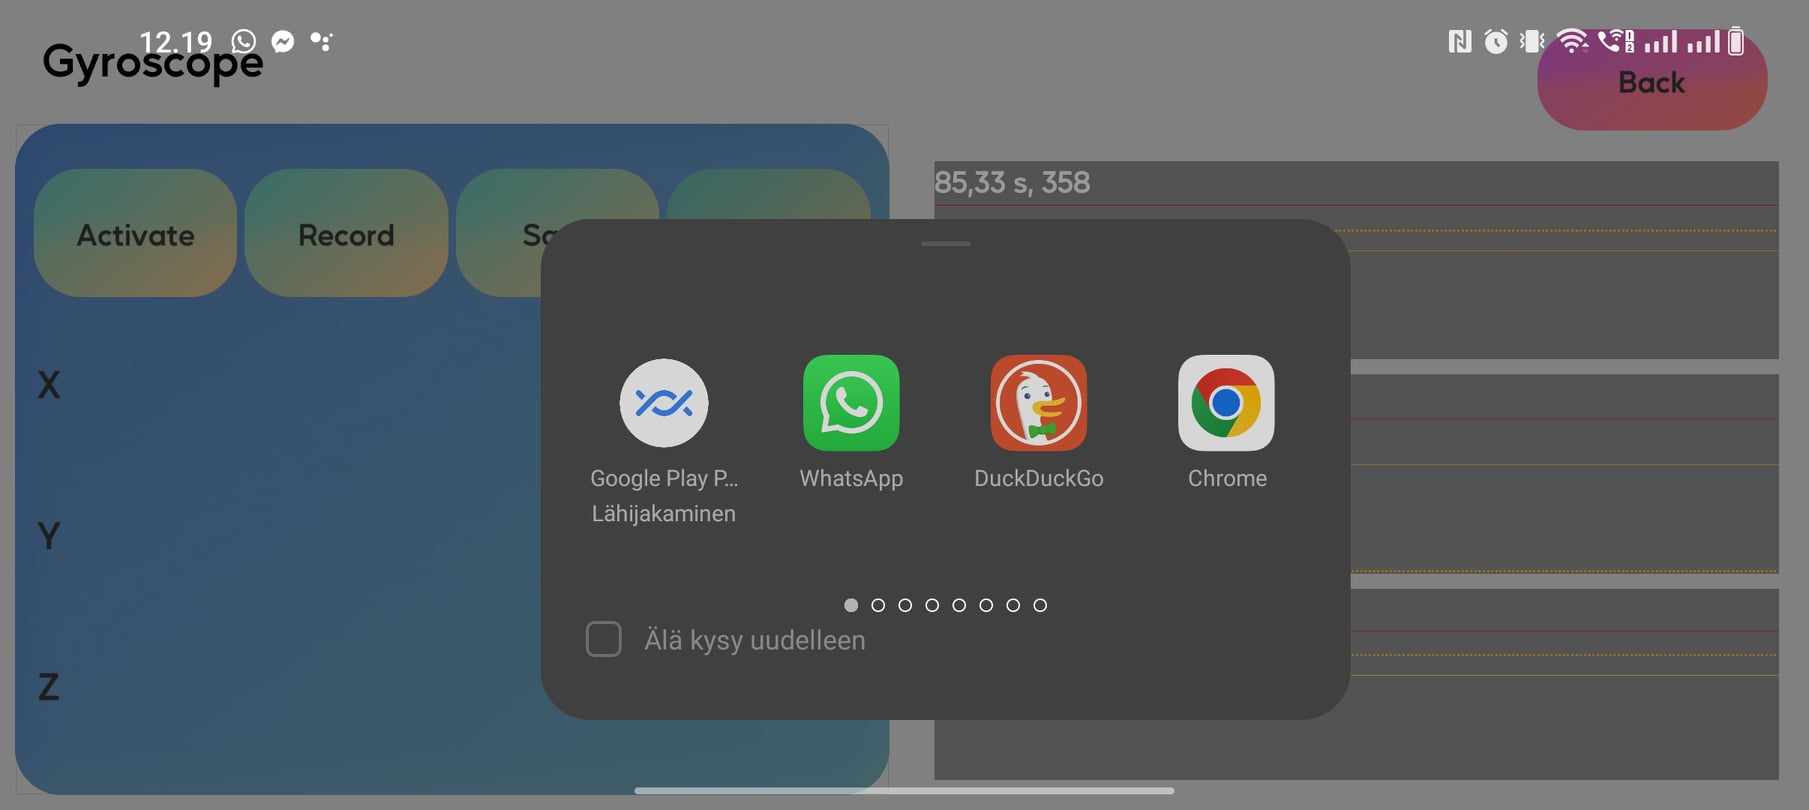
The data can also be shared as a text though any meassging app.
Core Logic
Sensor Class
Sensor class serves as the basic blueprint for all sensor types. The Sensor class contains the basics for sensor functionality, including data retrieval, activation, stopping, streaming, and recording. By using a single structure, the Sensor class can easily be adapted to use different sensor inputs.
Data Visualization and Functionality Control
The SensorScreen handles the interaction between data aquisition and graphing. Real-time data visualization is accomplished using a dedicated LineGenerator graph for each sensor.
Class Dependencies
Practical Applications
Apart from the app’s architercture, the app can be used in real life situations, below we give out an example.
Explore the rest of data processing examples using Python and LabVIEW
Device Orientation Calibration
The accelerometer sensor data can be directly retrieved by the app. By utilizing the gravitational force detected by the accelerometer, it’s possible to determine the device’s alignment with respect to the Earth’s gravitational field. Similar calibration methods are used in video game controllers, VR headesets, etc.
To showcase this, we created a Python script that utilizes accelerometer and gyroscope data to calibrate a device’s orientation. The script uses a complementary filter to fuse the sensor readings and calculate the device’s roll, pitch, and yaw angles.
Python Script: Link to the original script
Here’s a brief description of the script’s functionality:
- The script reads accelerometer data from a .csv file
- It processes the accelerometer readings to calculate the roll, pitch, and yaw angles.
- These angles are used to adjust the device’s orientation.
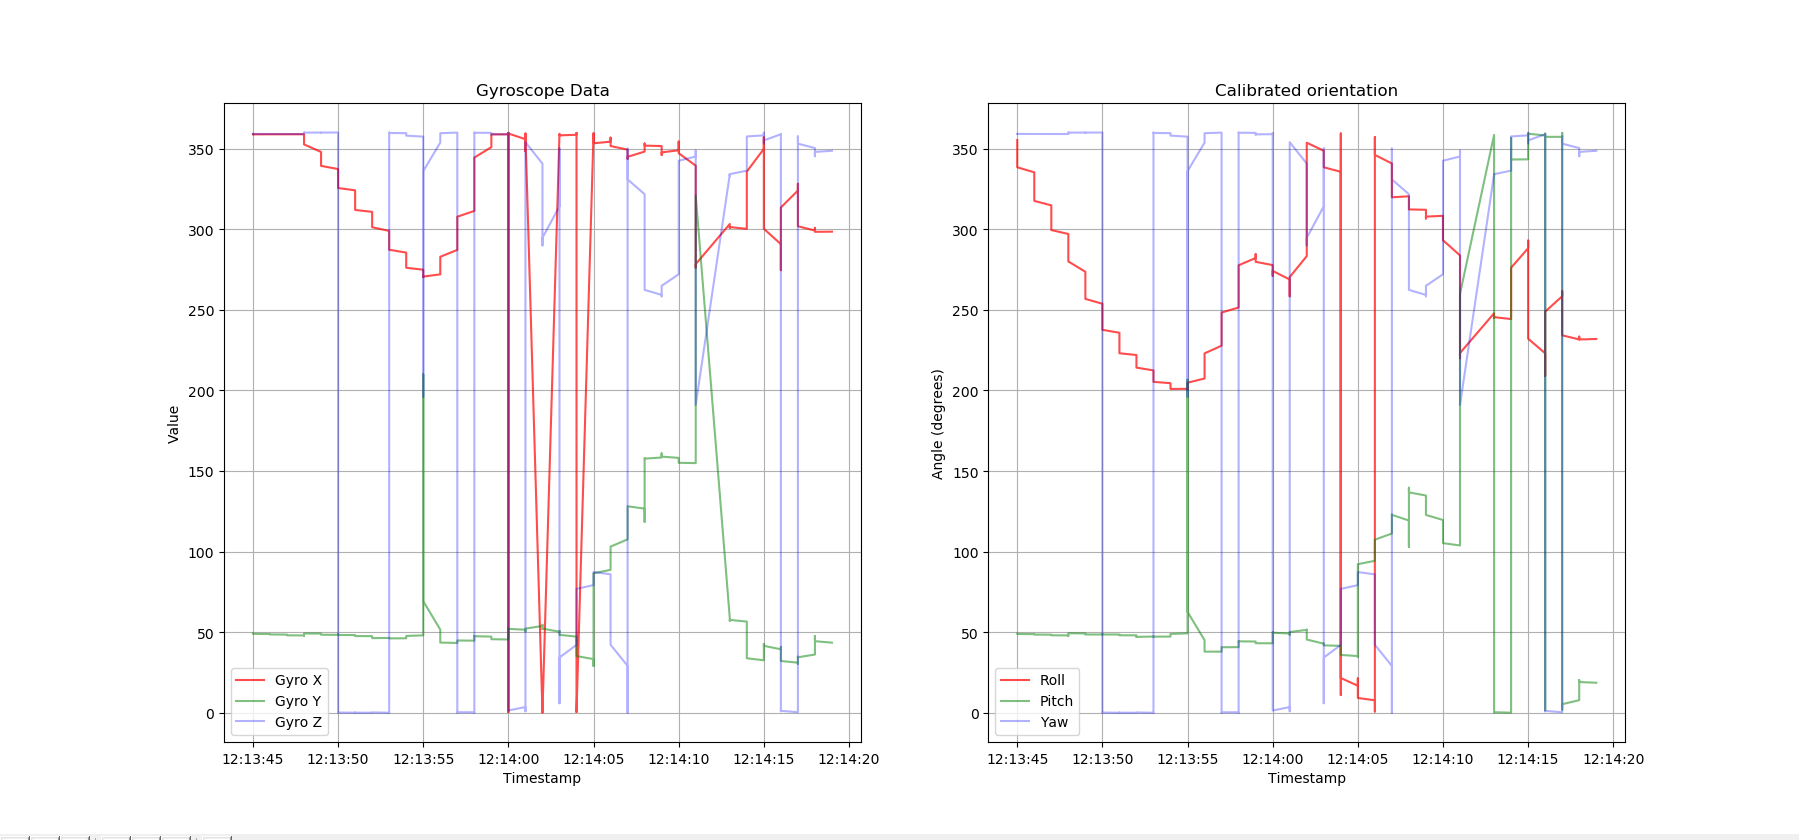
Practical Result and Visualization
Here’s an image showcasing the practical result of the device’s orientation calibration using the complementary filter: