16. Interface and application programming
This week the aim is to write an application that interfaces with the input/output device that made in the previous week.
Python- Programming Language
Python is a high level general purpose programming language. It is an object oriented programming language. Applciation interfaces can be easily written in Python. Python supports a huge library of tools for different purposes like numerical computation, plotting, graphics,etc.By default Python libraries and interpreter are available for Ubuntu OS.
Matplotlib
Matplotlib is a Python 2D plotting library which produces publication quality figures in a variety of hardcopy formats and interactive environments across platforms. To install it run the comamnd in terminal
sudo apt-get install python-matplotlib
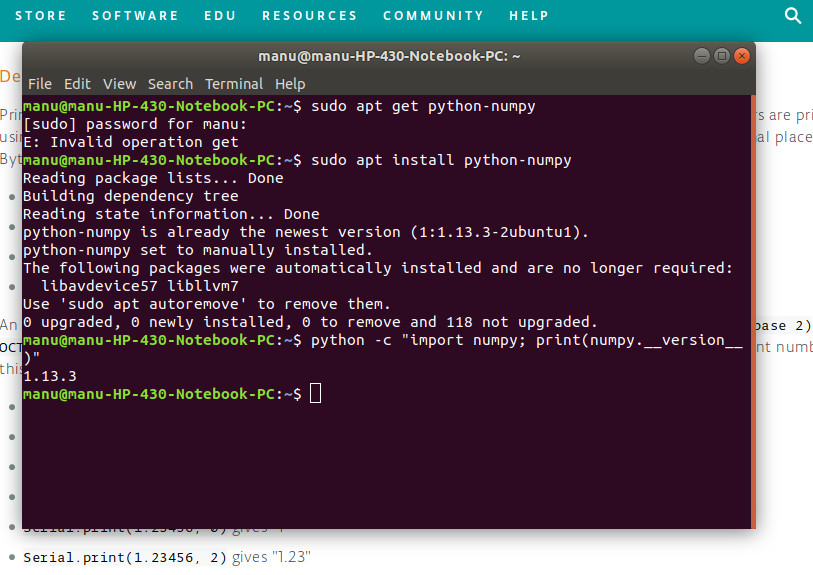
Numpy
Numpy is the fundamental package for scientific computing with Python. It contains among other things:
1. a powerful N-dimensional array object
2. sophisticated (broadcasting) functions
3. tools for integrating C/C++ and Fortran code
4. useful linear algebra, Fourier transform, and random number capabilities
Numpy can be installed by using terminal as sudo apt-get install python-numpy
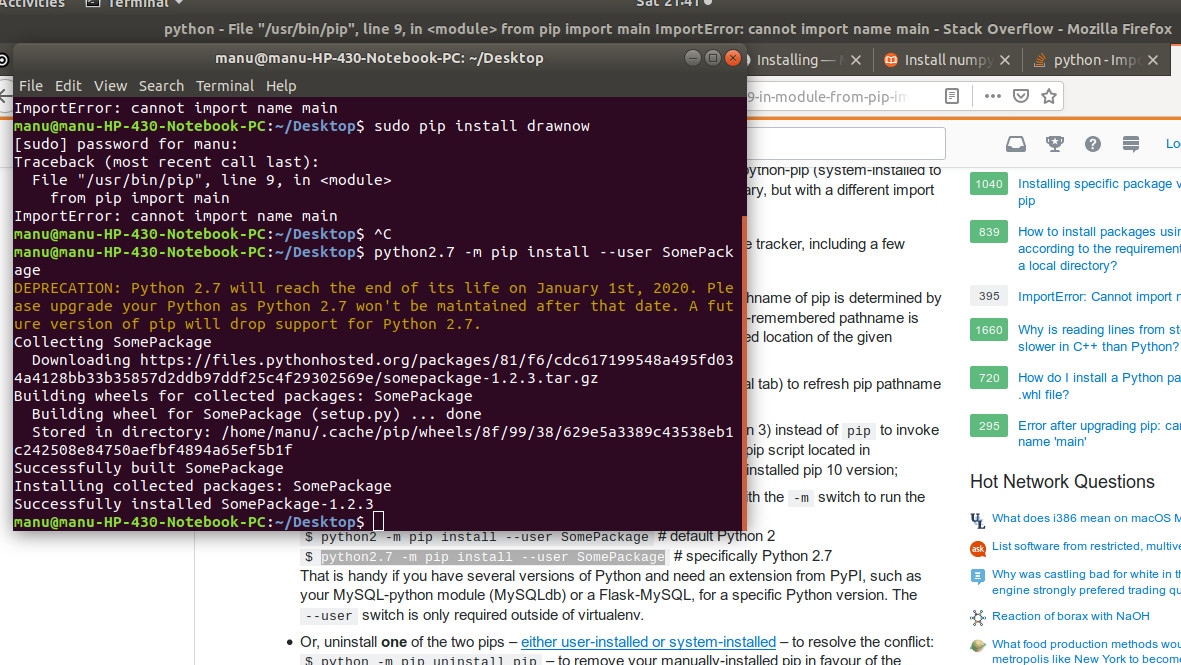
Drawnow
Drawnow is a tool to plot the iterative codes and help us to view the updated plot. It can be installed by
sudo pip install drawnow
Pythonserial
Pythonserialmodule encapsulates the access for the serial port. It provides backends for Python running on Windows, OSX, Linux, BSD (possibly any POSIX compliant system) and IronPython. The module named “serial” automatically selects the appropriate backend.
Interface with Sonar board made during Input Week
The board made with HC SR04 was interfaced using python for plotting real time values obtained from the board.
Programming the board
The board was reprogrammed using Arduino IDE as under
#include <SoftwareSerial.h>

// defined the pin numbers
const int trigPin = PA2;
const int echoPin = PA3;

// define the variables

long duration;
int distance;

SoftwareSerial ss(1,0);

void setup()
{

 pinMode (trigPin,OUTPUT);// sets trigPin as output
 pinMode (echoPin,INPUT); // sets echoPin as input
 ss.begin(9600);//start serial communication at 9600 baud rate

}

void loop()
{
 // clears the trigger pin
digitalWrite(trigPin, LOW);
delayMicroseconds(2);

// Sets the trigPin for High state for 10microseconds to generate the pulse

digitalWrite(trigPin, HIGH);
delayMicroseconds(10);
digitalWrite(trigPin, LOW);

// reads the echoPin,to get the ultrasonic wave travel time
duration = pulseIn(echoPin, HIGH);

// Calculating the distance
distance= duration*0.034/2;

//prints the distance on serial monitor

ss.println (distance);

delay(1000);

}
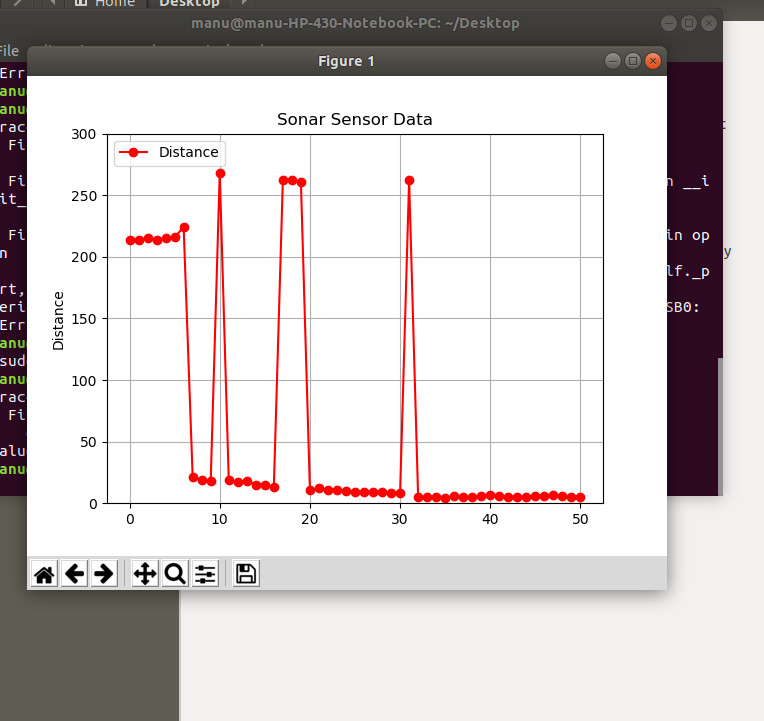
Plotting using Python
The serial communication was observed in the Serial monitor of the Aurduino IDE. The serial data obtained from the MCU can be used using Pythonserial. The plots are obtained using Matplotlib, Drawnow and Numpy.
The plot was created using the following python script.
# Manu Mohan S, FabAcademy ,Fablab Trivandrum, India
# Interface and Applications Week Assignment

# This is a python based program to plot the distance obtained from ATtiny 44 as serial data vs time.
# The plotting is done using matplotlib a python based MATLAB like tool.
# Some libraries of python like numpy,drawnow etc were also used.
# This program is made by modifying the program obtained from-
# http://www.toptechboy.com/tutorial/python-with-arduino-lesson-11-plotting-and-graphing-live-data-from-arduino-with-matplotlib/


import serial                       #Import serial library
import numpy                        # Import numpy
import matplotlib.pyplot as plt     # Import matplot.lib
from drawnow import *               # Import drawnow

Distance=[]                         # Creates an array for the analog values
sensordata=serial.Serial('/dev/ttyUSB0', 9600) # Stores the serial data in object called sensordata
plt.ion()                           #Tell matplotlib that we need an interactive mode to live plot data
cnt=0

def makeFig():                      # Create a function to make the plot
    plt.ylim(0,400)                 # Set min and max values of Y axis
    plt.title('Sonar Sensor Data')  # Title for the plot
    plt.grid(True)                  # Turn the grid on
    plt.ylabel('Distance')          # Y label
    plt.plot(Distance, 'ro-', label='Distance') # plot the value with red dots(ro)
    plt.legend(loc='upper left')    # Plot the legend
while True:                         # while loop
    while (sensordata.inWaiting()==0): # while there is no data in the object 'sensordata'
        pass                        # do nothing
    sensordataString = sensordata.readline() # read the line of the object 'sensordata'
    dataArray = sensordataString.split(',')  # Split and store it into an array called dataArray
    distance=float(dataArray[0])   # Convert the first value to a floating value and store it in 'distance'
    Distance.append(distance)      # Build the array called 'Distance' by adding the read values from 'distance'
    drawnow(makeFig)               # use drawnow to execute the function 'makeFig'
    plt.pause(.000001)             # Pause briefly to stop the graph from crashing
    cnt=cnt+1
    if(cnt>50):                    # If you have 50 or more points, delete the first one from the array
        Distance.pop(0)            # This allows us to just see the last 50 data points
 After saving the scrpt file as
 .py. The terminal in the folder has to be opened and write the command as python 'filename' to run the python script by the default Ubuntu interpreter.
Errors
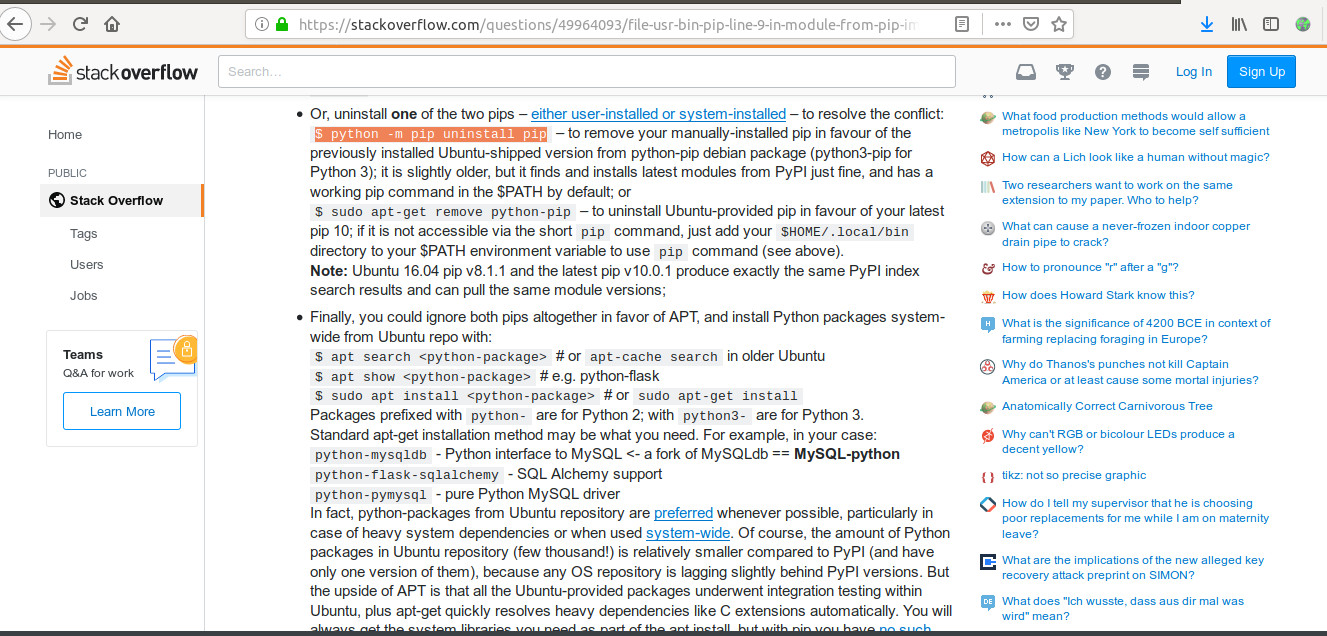
 After searching in the internet I found that this error is caused by two versions of pip installed in the system. The solution was to use the command `python -m pip uninstall pip’ to remove manually installed pip.
Source : https://stackoverflow.com/questions/49964093/file-usr-bin-pip-line-9-in-module-from-pip-import-main-importerror-canno