Week 9 Group Assignment: Using an Oscilloscope to Measure Grove Sensors
Task Overview
According to the Week 9 curriculum, our group needs to select input devices, measure their electrical signal characteristics using an oscilloscope, and analyze their working principles. In this assignment, we will:
- Test the XIAO ESP32C3 with the Grove DHT11 temperature and humidity sensor (written by Feng Lei)
- Test the XIAO ESP32S3 with the ADXL345L three-axis accelerometer (written by Liu Hongtai)
Testing Tutorial for XIAO ESP32C3 with Grove DHT11 Temperature and Humidity Sensor
I used the OWON EDS102CV oscilloscope, a dual-channel digital storage oscilloscope with a sampling rate of up to 1GS/s and a bandwidth of 100MHz, suitable for measuring and analyzing various electronic signals.
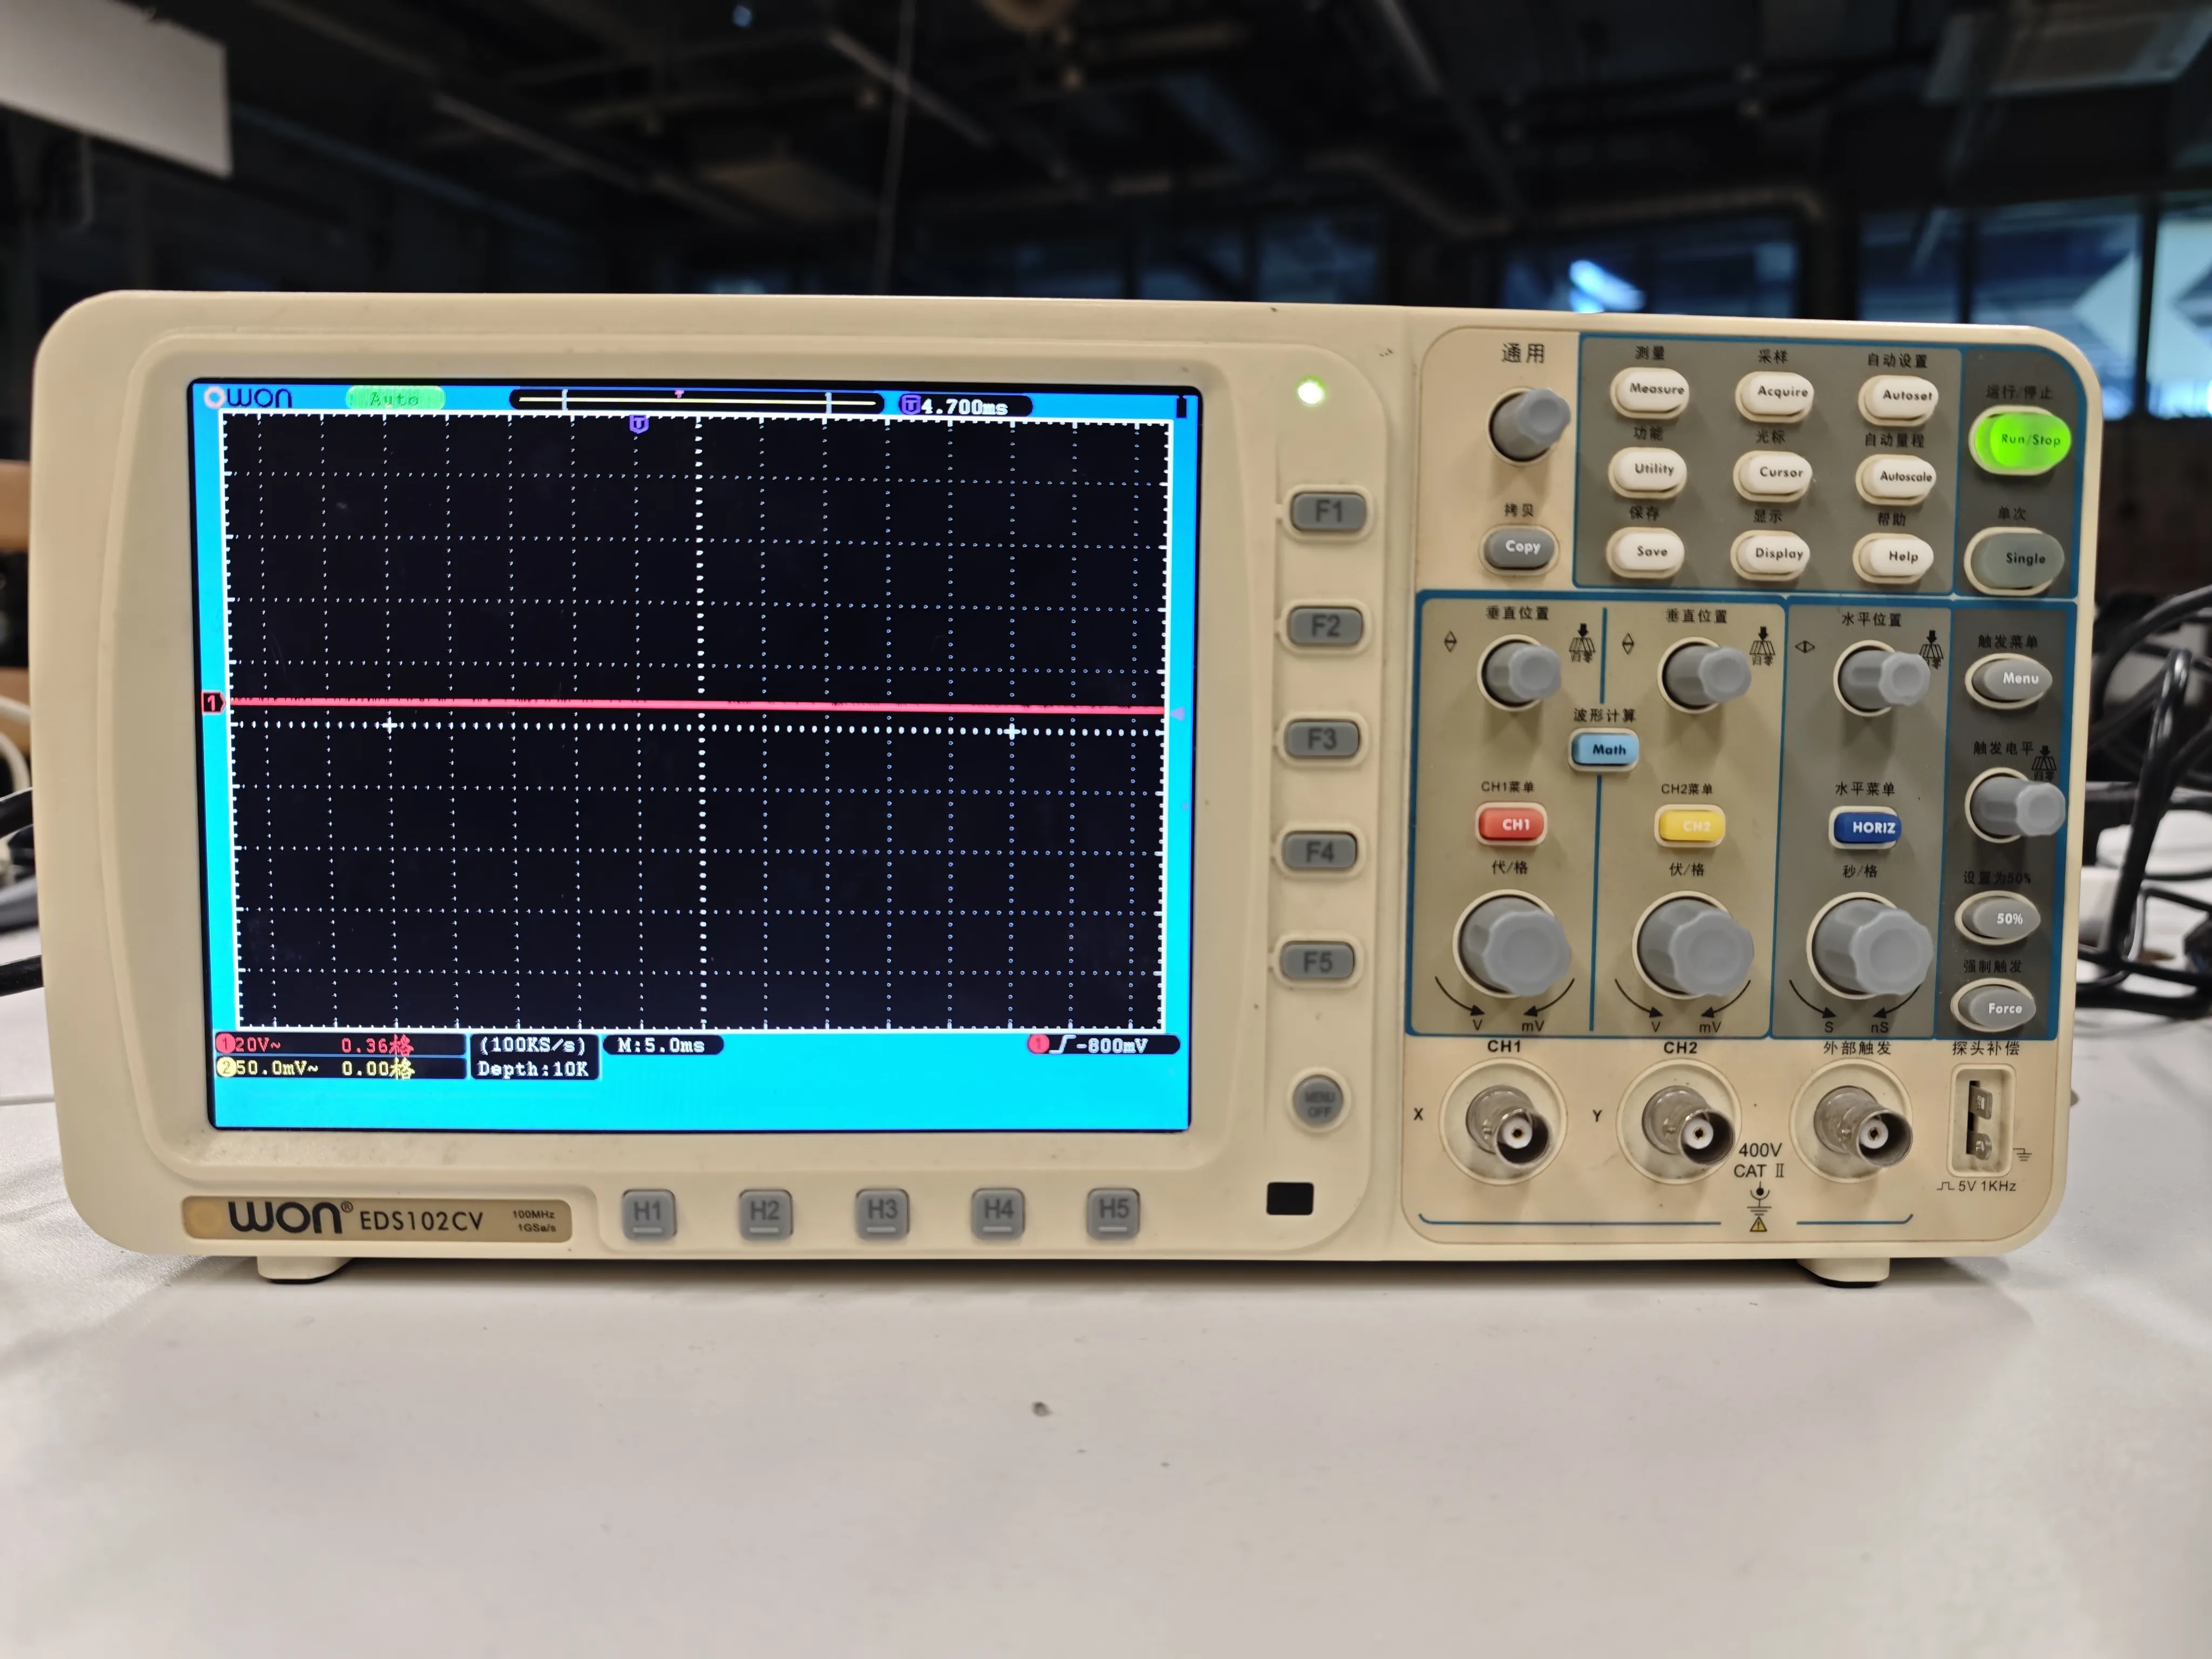
OWON EDS102CV Oscilloscope
Key Technical Specifications:
- Bandwidth: 100MHz
- Number of Channels: 2
- Maximum Sampling Rate: 1GS/s
- Time Base Range: 2ns/div - 100s/div
- Vertical Sensitivity: 2mV/div - 10V/div
- Display: 8-inch color LCD
For oscilloscope function details, refer to Katherine's document: Week12. Input Devices.
Introduction to Grove DHT11 Temperature and Humidity Sensor
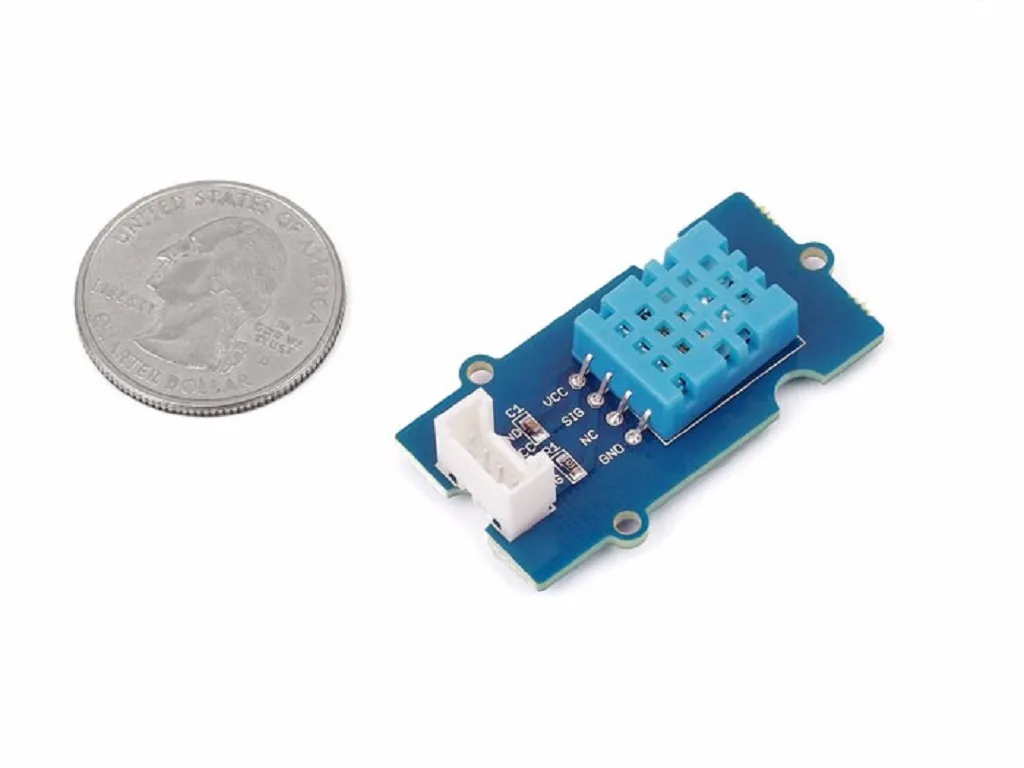
The Grove DHT11 is a basic digital temperature and humidity sensor manufactured by Seeed Studio, designed for entry-level electronics projects. Below are its main features:
Basic Specifications
- Measurement Range: Temperature 0-50°C, Humidity 20-90% RH
- Accuracy: Temperature ±2°C, Humidity ±5% RH
- Resolution: Temperature 1°C, Humidity 1% RH
- Supply Voltage: 3.3V-5.5V
- Data Output: Single-bus digital signal
Features
- Grove Interface: Standard Grove interface design, no soldering required, plug-and-play
- Low Power Consumption: Average operating current 0.5mA, standby current about 100μA
- Small Size: Compact sensor module for easy integration into various projects
- Signal Transmission Distance: Up to 20 meters under standard conditions
- Long-term Stability: Calibration coefficients stored in OTP memory for stable operation
Working Principle
The DHT11 contains a resistive humidity sensing element and an NTC temperature sensing element. After collecting environmental data, the sensor outputs digital signals to the microcontroller via a single-bus protocol. A complete data transmission includes 40 bits of data, comprising the integer and decimal parts of humidity and temperature, as well as a checksum.
Communication Protocol
The DHT11 uses a simplified single-bus communication protocol:
- Host Sends Start Signal: Pull the data line low for at least 18ms, then pull it high for 20-40μs
- Sensor Response: Pull the data line low for 80μs, then pull it high for 80μs
- Data Transmission: Each data bit starts with a 50μs low signal, followed by a high signal whose length determines whether the bit is "0" or "1"
- "0": High signal lasts 26-28μs
- "1": High signal lasts 70μs
Application Scenarios
- Home Automation Projects: Indoor environment monitoring
- Weather Stations: Simple weather monitoring
- Educational Projects: Learning Arduino, Raspberry Pi, and other microcontrollers
- Plant Care: Monitoring indoor plant growth environments
- Simple Hygrometer/Thermometer: Combining with LCD/OLED displays
Advantages and Disadvantages
Advantages:
- Cost-effective for beginners
- Easy to use with rich code libraries
- Grove interface facilitates rapid prototyping
Disadvantages:
- Lower accuracy, unsuitable for high-precision requirements
- Limited measurement range, unsuitable for extreme environments
- Slow update rate, recommended measurement interval ≥2 seconds
This sensor is ideal for beginners learning input devices and sensor communication protocols, especially in educational settings like the MIT Fab Academy Input Devices course.
Materials Preparation
- XIAO ESP32C3 development board
- Grove DHT11 temperature and humidity sensor
- OWON EDS102CV oscilloscope
- Oscilloscope probe
- Connecting wires
- USB data cable
- Computer (with Arduino IDE installed)
Part 1: Hardware Connection
- Connecting DHT11 to XIAO ESP32C3
- Connect the VCC pin of Grove DHT11 to the 3.3V of XIAO ESP32C3
- Connect the GND pin of Grove DHT11 to the GND of XIAO ESP32C3
- Connect the DATA pin of Grove DHT11 to digital pin 2 (D2) of XIAO ESP32C3
The wiring diagram is shown below.
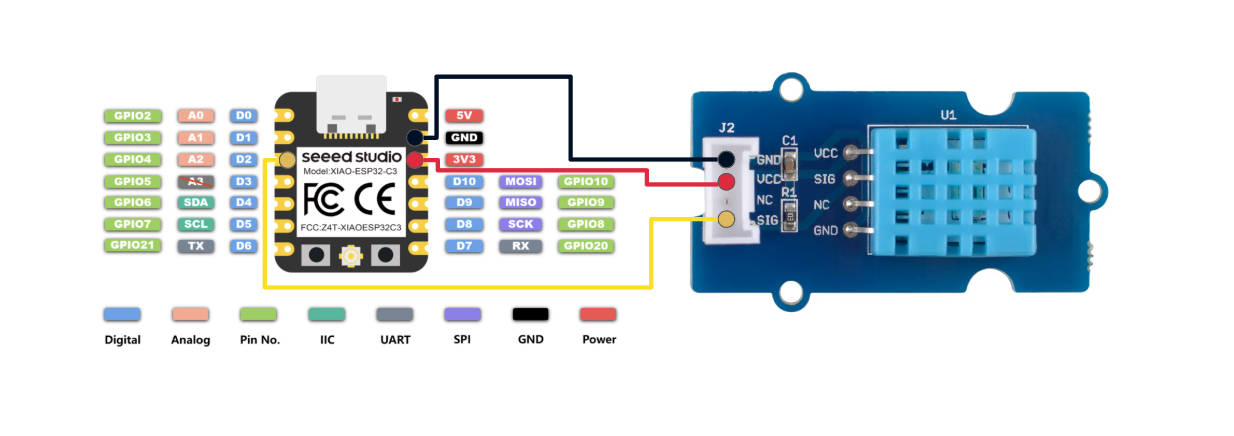
Wiring diagram for XIAO ESP32C3 and Grove DHT11
- Connecting the Oscilloscope Probe
- Connect the probe needle of CH1 of the oscilloscope to the DATA pin of DHT11
- Connect the ground clip of the oscilloscope probe to the ground of the circuit
- Connecting XIAO ESP32C3 to the Computer
- Use the USB data cable to connect the XIAO ESP32C3 to the computer
After the devices are connected, it should look like the following.
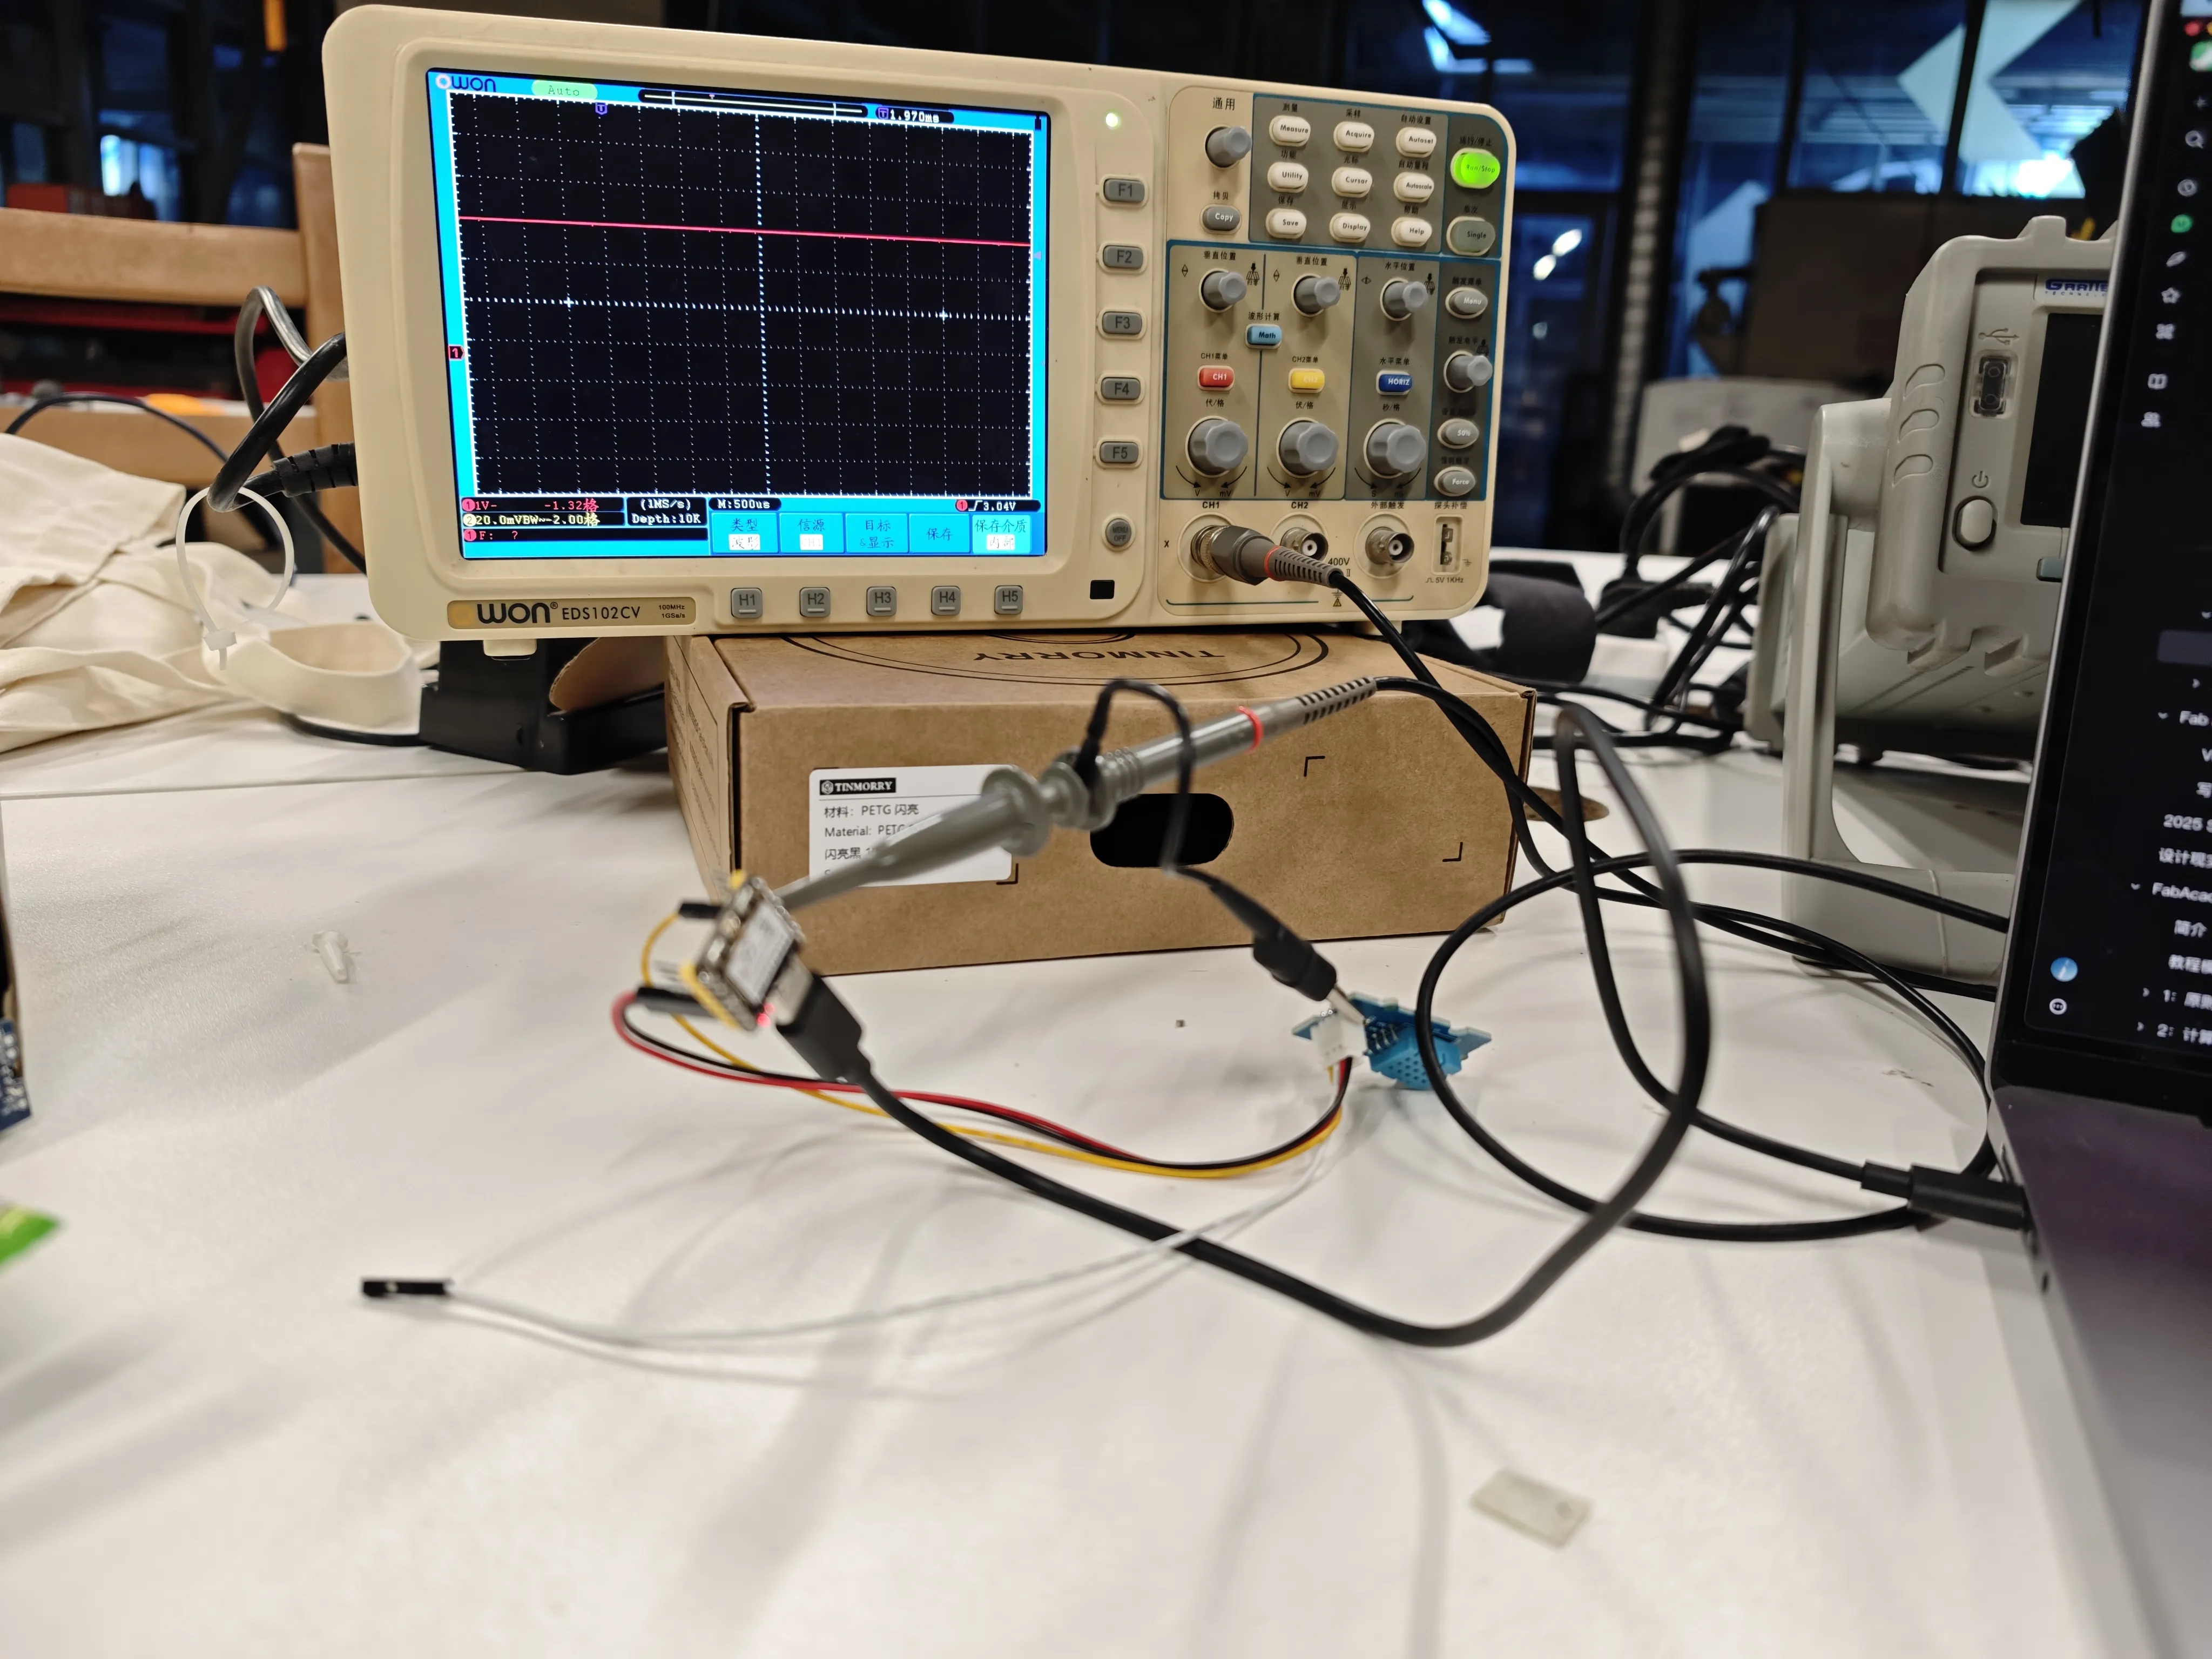
Actual connection of devices
Part 2: Software Setup
- Installing Necessary Libraries
- Open Arduino IDE
- Go to "Tools" > "Manage Libraries"
- Search and install "DHT sensor library" and "Adafruit Unified Sensor" libraries
- Search and install "Seeed XIAO ESP32C3" board support (if not already installed)
- Basic Code Writing
- Create a new Arduino sketch
- Copy the following code:
// Example testing sketch for various DHT humidity/temperature sensors
// Written by ladyada, public domain

// REQUIRES the following Arduino libraries:
// - DHT Sensor Library: https://github.com/adafruit/DHT-sensor-library
// - Adafruit Unified Sensor Lib: https://github.com/adafruit/Adafruit_Sensor

#include "DHT.h"

#define DHTPIN D2   // Digital pin connected to the DHT sensor

#define DHTTYPE DHT11   // DHT 11

DHT dht(DHTPIN, DHTTYPE);

void setup() {
  Serial.begin(9600);
  Serial.println(F("DHTxx test!"));

  dht.begin();
}

void loop() {
  // Wait a few seconds between measurements.
  delay(2000);

  // Reading temperature or humidity takes about 250 milliseconds!
  // Sensor readings may also be up to 2 seconds 'old' (it's a very slow sensor)
  float h = dht.readHumidity();
  // Read temperature as Celsius (the default)
  float t = dht.readTemperature();
  // Read temperature as Fahrenheit (isFahrenheit = true)
  float f = dht.readTemperature(true);

  // Check if any reads failed and exit early (to try again).
  if (isnan(h) || isnan(t) || isnan(f)) {
    Serial.println(F("Failed to read from DHT sensor!"));
    return;
  }

  // Compute heat index in Fahrenheit (the default)
  float hif = dht.computeHeatIndex(f, h);
  // Compute heat index in Celsius (isFahrenheit = false)
  float hic = dht.computeHeatIndex(t, h, false);

  Serial.print(F("Humidity: "));
  Serial.print(h);
  Serial.print(F("%  Temperature: "));
  Serial.print(t);
  Serial.print(F("°C "));
  Serial.print(f);
  Serial.print(F("°F  Heat index: "));
  Serial.print(hic);
  Serial.print(F("°C "));
  Serial.print(hif);
  Serial.println(F("°F"));
}
- Uploading Code
- Select the correct board: "Tools" > "Board" > "Seeed Studio XIAO Series" > "Seeed Studio XIAO ESP32C3"
- Select the correct port: "Tools" > "Port" > Select the COM port connected to XIAO
- Click the upload button
If the hardware connection is normal, you should see sensor data in the Arduino serial monitor as shown in the figure below. Keep the sensor outputting data when measuring with the oscilloscope.
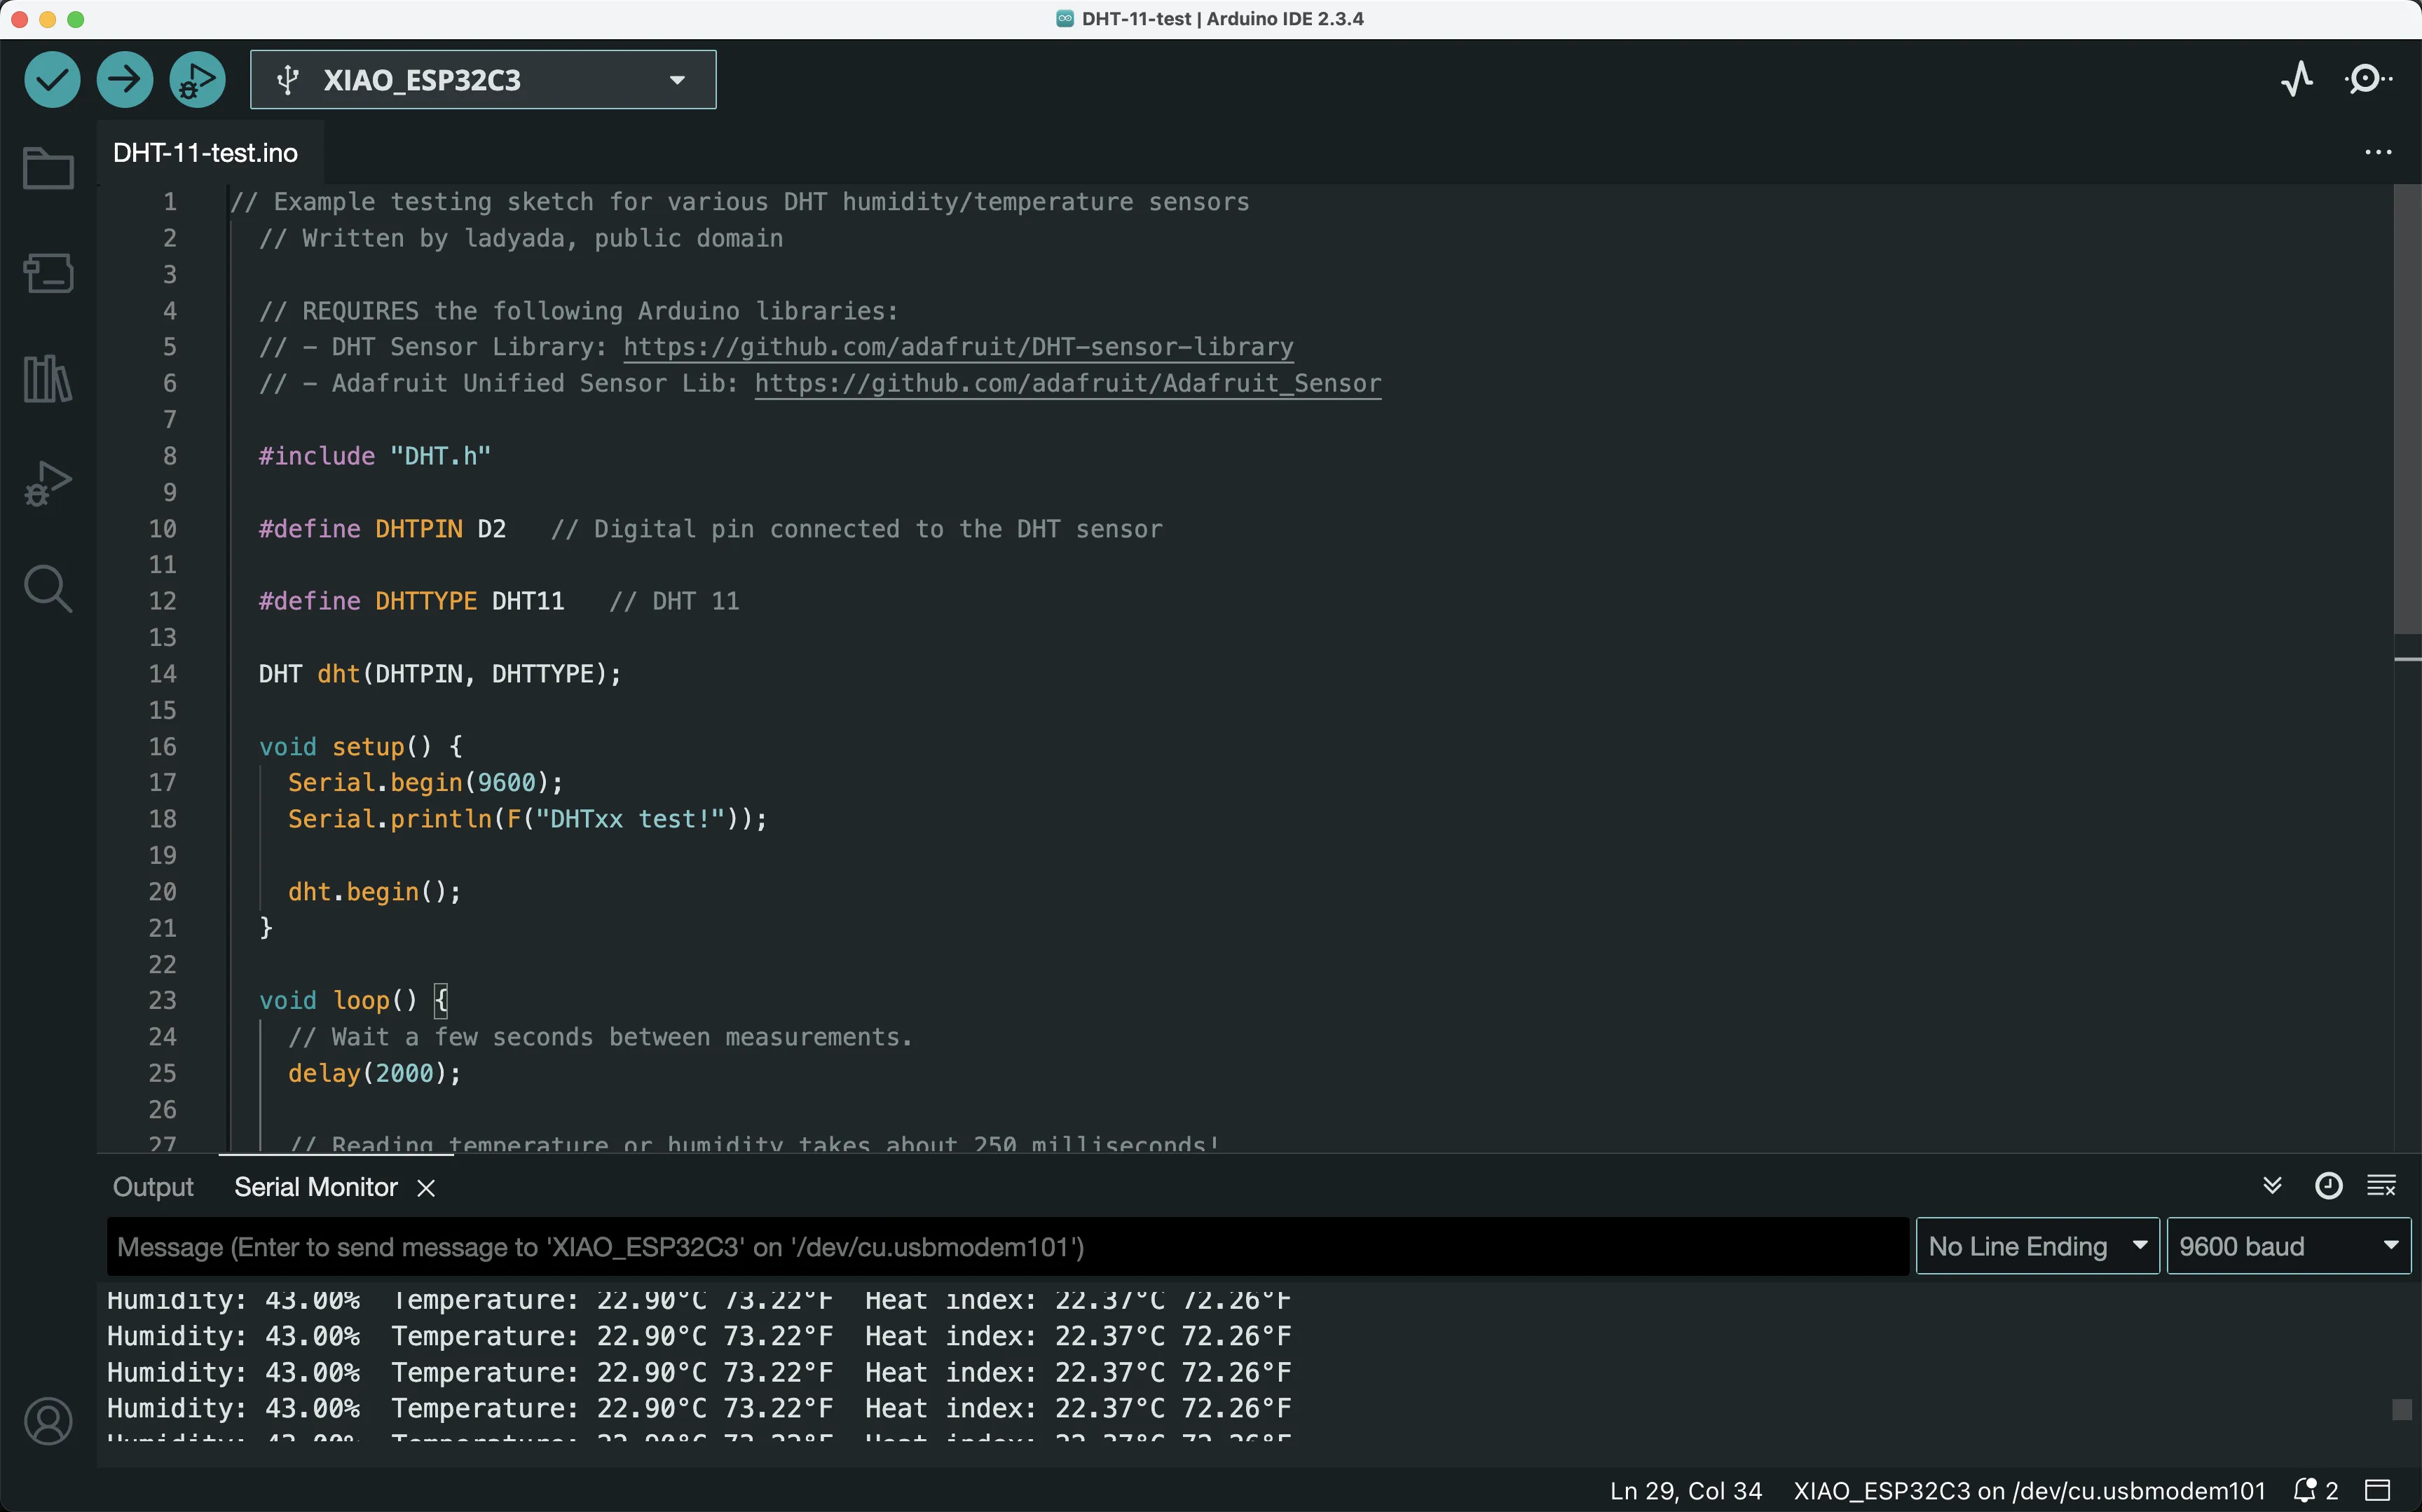
Ensure the Arduino IDE serial monitor always displays sensor data
Part 3: Oscilloscope Measurement
- Configuring Oscilloscope Settings
- Turn on the OWON EDS102CV oscilloscope.
- Set the time base (Time/Div) to 2ms/div and start observing.
- Set the voltage scale (Volts/Div) to 1V/div.
- Ensure CH1 is selected and displayed.
- Observing DHT11 Communication Signals
- Observe the waveform displayed on the oscilloscope
- The DHT11 uses a single-bus protocol, so you should see the following characteristics:
- Start signal: Low level lasting at least 18ms, followed by high level for 80μs.
- Data transmission: Each bit consists of 50μs low + 26-28μs high (for "0") or 50μs low + 70μs high (for "1").
- Adjusting Oscilloscope Settings
- If the signal is unclear, try adjusting the trigger level.
- Use the oscilloscope's single (Single) button trigger function to capture the complete communication process. Once data is captured, the Run/Stop button in the upper left corner will turn red and pause, as shown in the figure below.
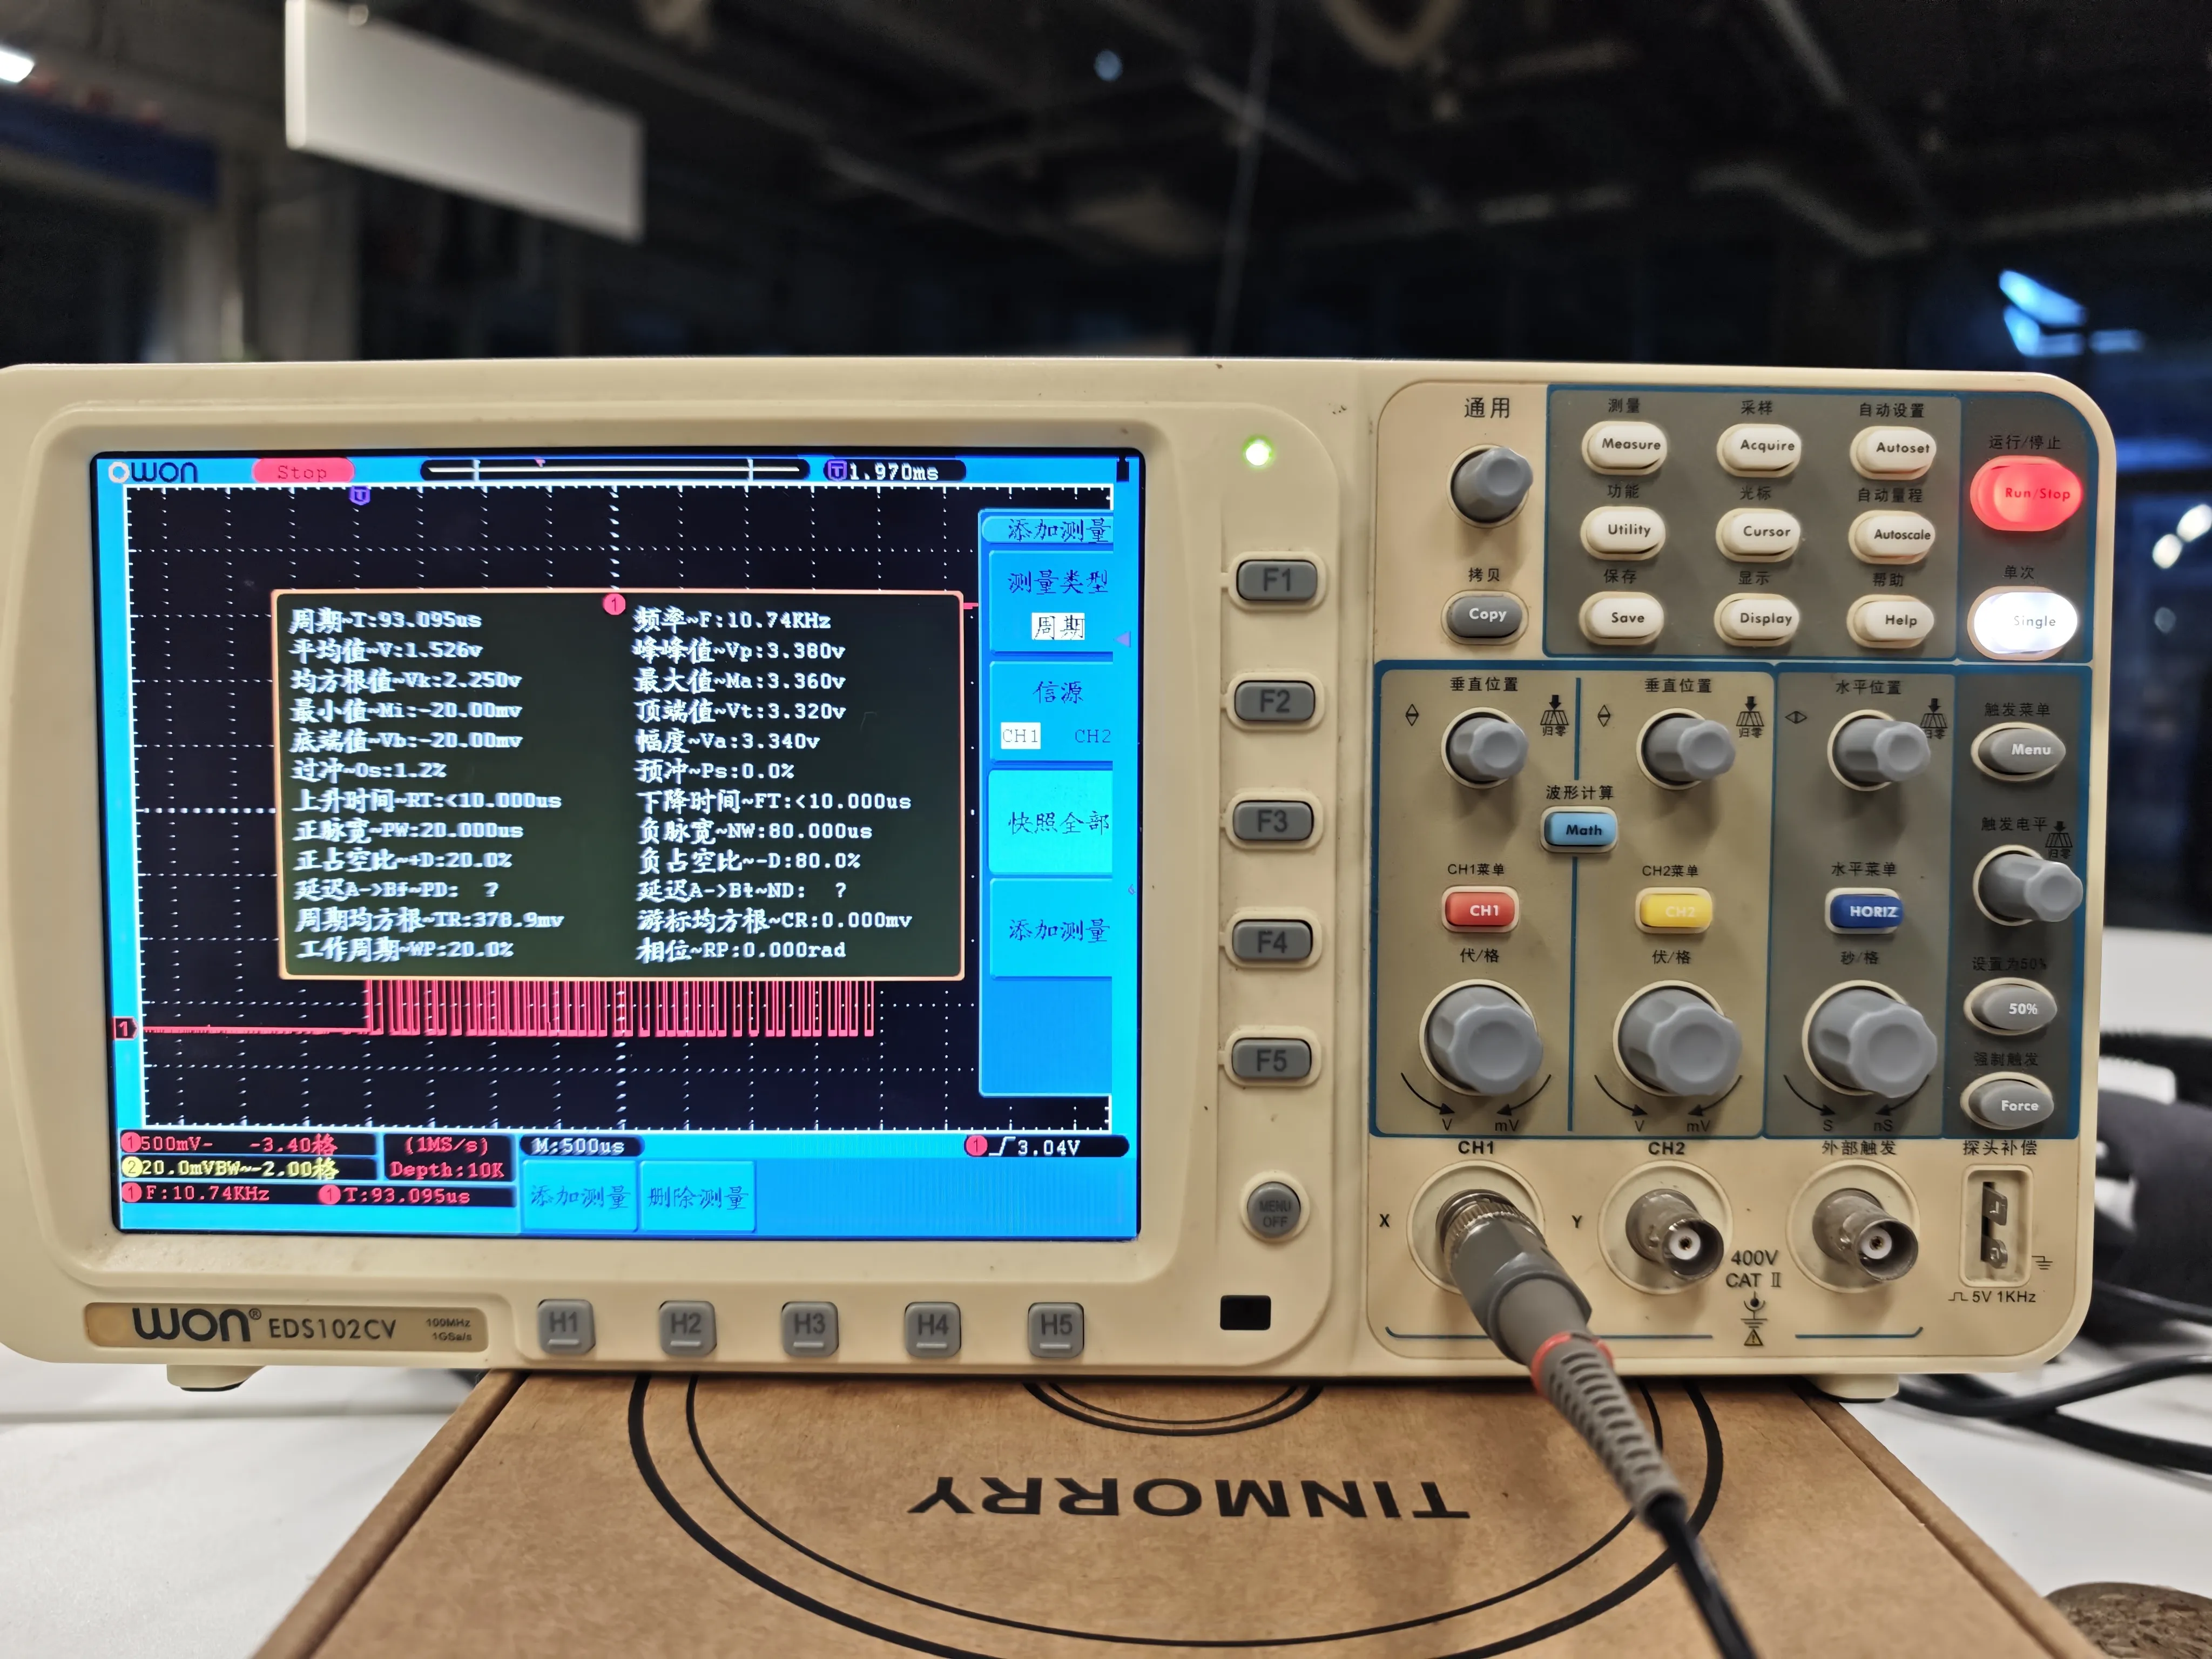
Using the Single button on the right can automatically capture the data transmission cycle of Grove DHT11
- Use the "Add Measurement > Snapshot All" function to get a comprehensive report of the signal, as shown in the figure below.
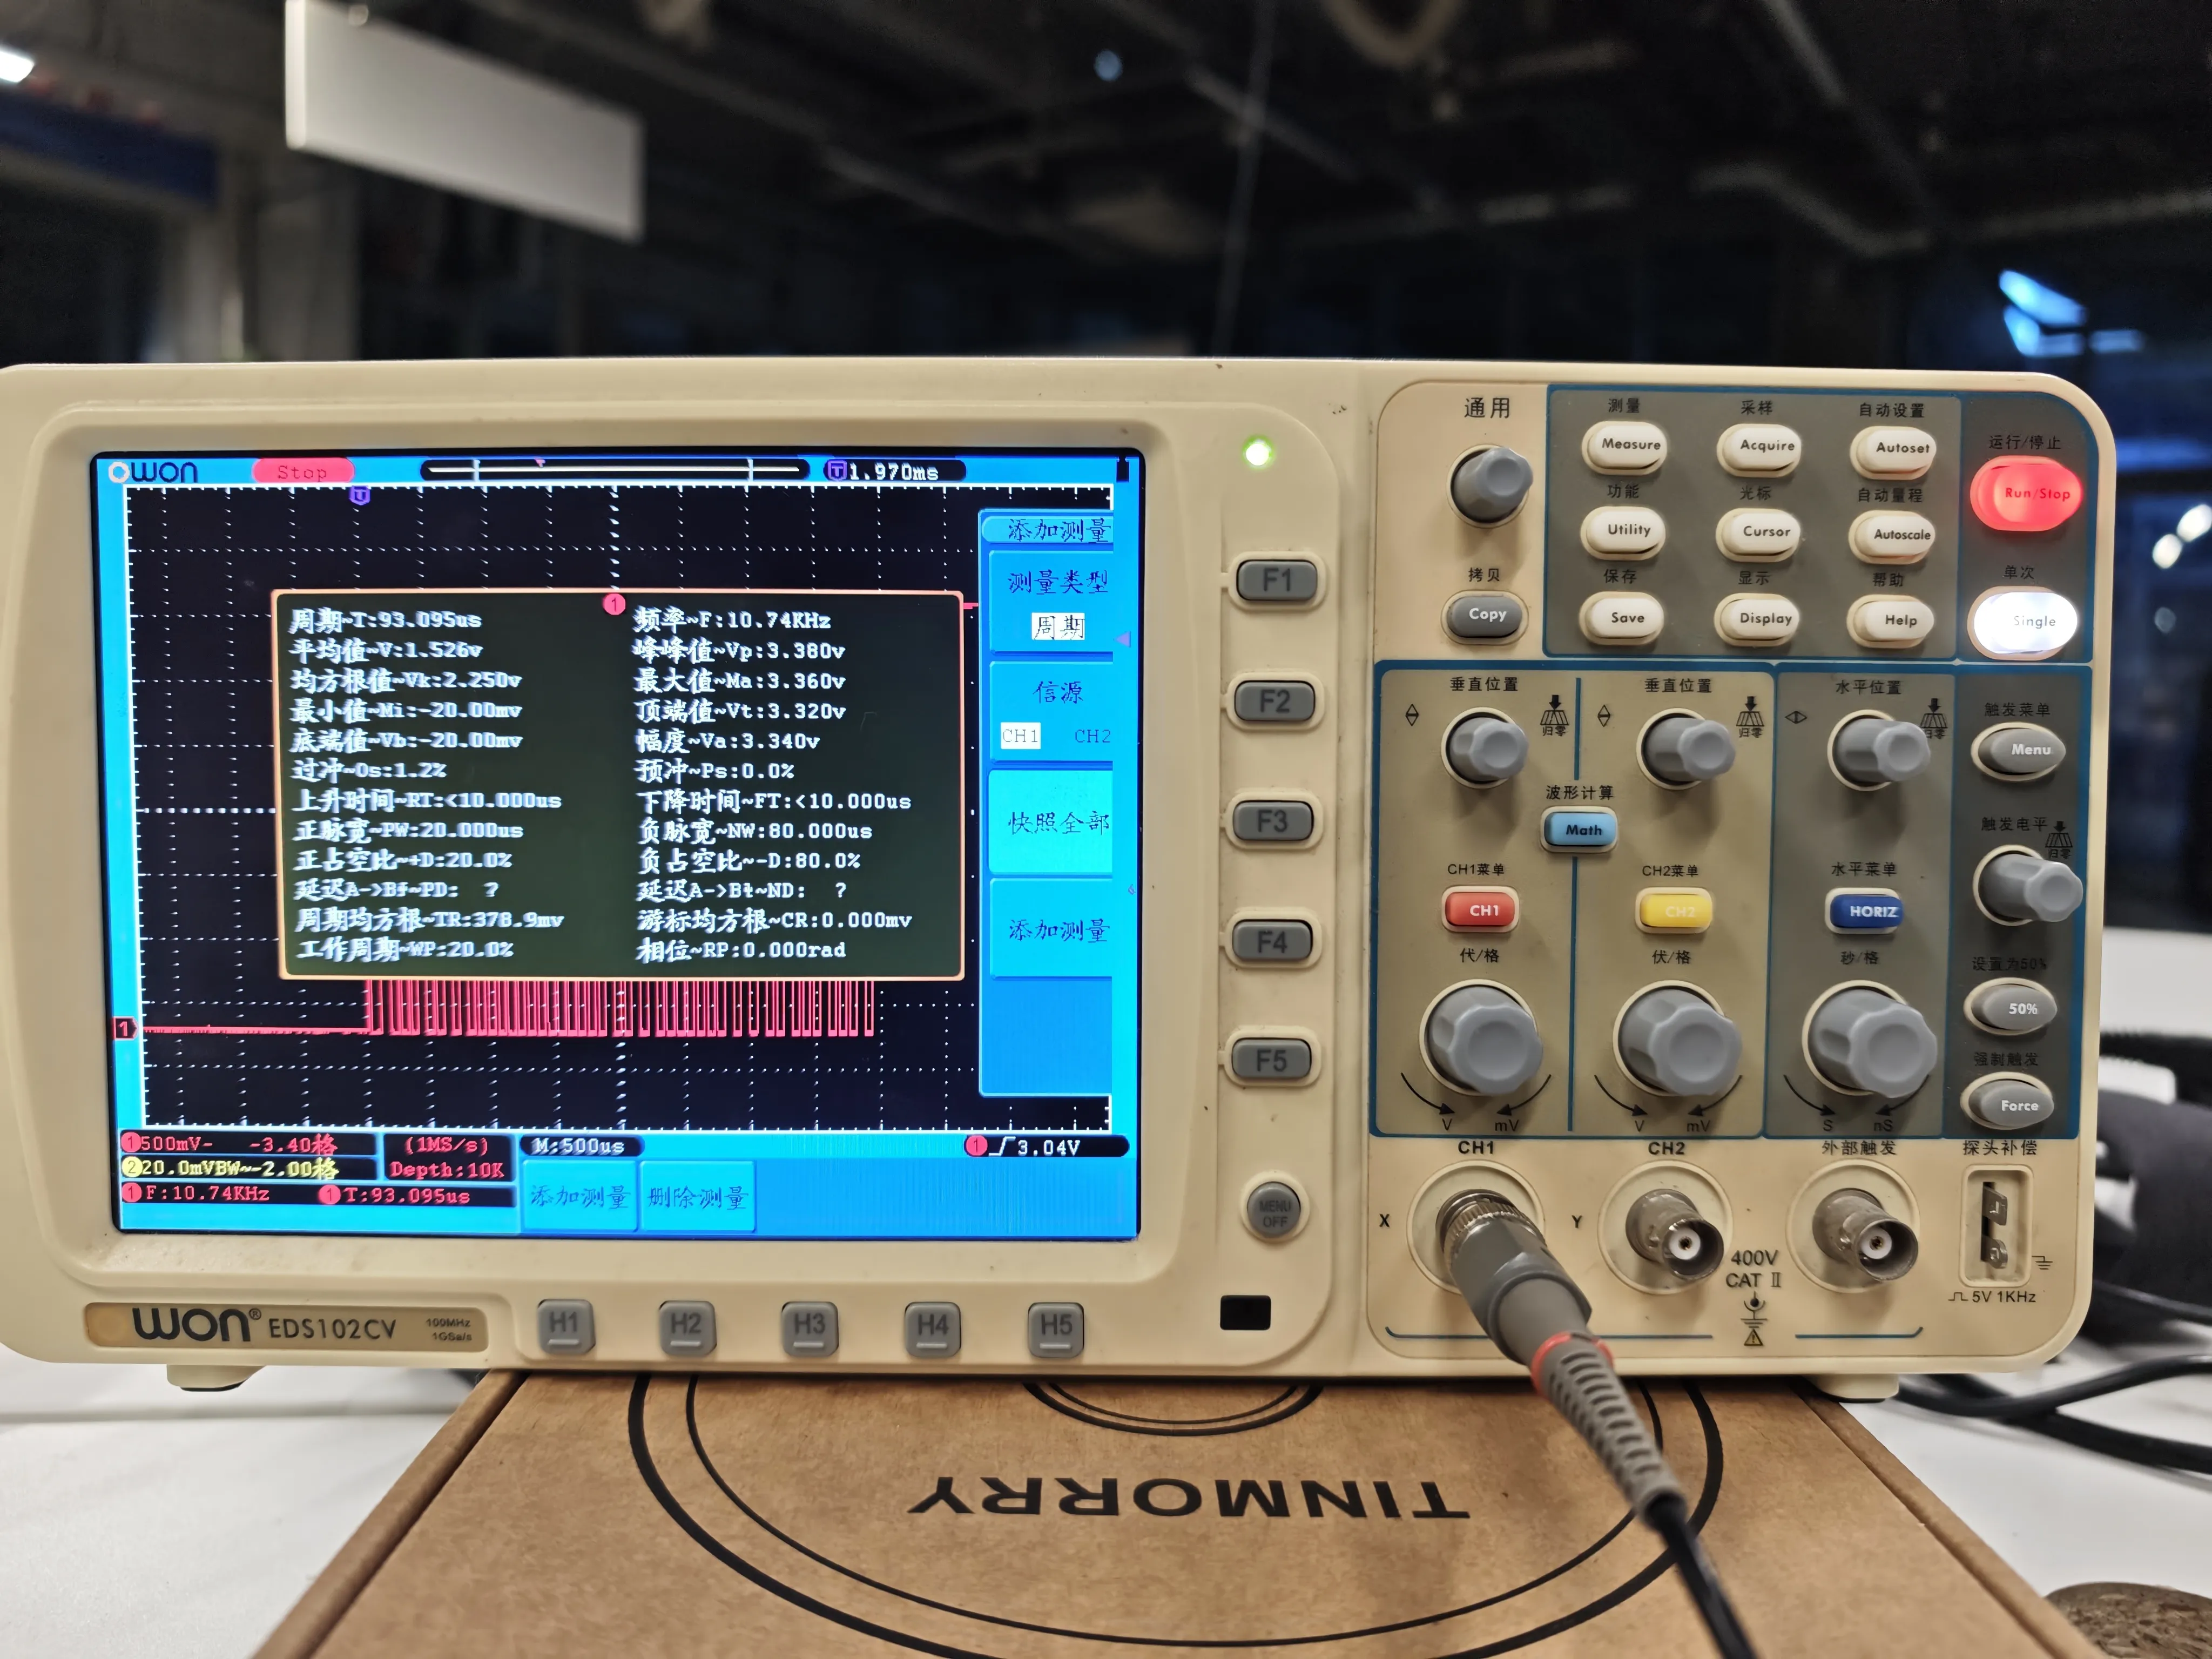
The "Add Measurement > Snapshot All" function can obtain a comprehensive report of the signal
Part 4: Measurement and Analysis
Based on the oscilloscope report, the measured parameters are listed in the table below:
| Parameter (Chinese Name) | Measured Value |
|---|---|
| Period (T) | 93.095μs |
| Frequency (F) | 10.74KHz |
| Average Value (V) | 1.526V |
| Peak-to-Peak (Vp) | 3.380V |
| RMS (Vk) | 2.250V |
| Minimum Value (Mi) | -20.00mV |
| Bottom Value (Vb) | -20.00mV |
| Overshoot (Os) | 1.2% |
| Rise Time (RT) | 10.000μs |
| Positive Pulse Width (PW) | 20.000μs |
| Positive Duty Cycle (D) | 20.0% |
| Delay (PD) | ? |
| Cycle RMS (TR) | 370.9mV |
| Working Cycle (WP) | 20.0% |
| Maximum Value (Ma) | 3.360V |
| Top Value (Vt) | 3.320V |
| Amplitude (Va) | 3.340V |
| Top Overshoot (Ps) | 0.0% |
| Fall Time (FT) | less than10.000μs |
| Negative Pulse Width (NW) | 80.000μs |
| Negative Duty Cycle (~D) | 80.0% |
| Distortion (ND) | ? |
| Cursor RMS (CR) | 0.000mV |
| Phase (RP) | 0.000rad |
These parameters comprehensively describe the electrical characteristics, timing characteristics, and frequency characteristics of the DHT11 sensor communication signal, providing an important basis for analyzing the data transmission protocol.
1. Communication Cycle Analysis
Using the single (Single) trigger mode of the OWON EDS102CV oscilloscope, we captured the complete DHT11 data transmission cycle:
- Period (T): 93.095μs
- Frequency (F): 10.74KHz
This indicates that the basic bit pulse cycle of the DHT11 sensor during data transmission is approximately 93μs, which aligns with the typical value range of 80-100μs specified in the DHT11 specifications.
2. Data Bit Characteristic Analysis
From the oscilloscope image, we can observe:
- Waveform Characteristics: Square wave signal with alternating high and low levels
- Peak-to-Peak (Vp): 3.380V, indicating the signal swings from near 0V to about 3.3V, consistent with the 3.3V logic level
- Duty Cycle:
- Positive Duty Cycle (D): 20.0%
- Negative Duty Cycle (~D): 80.0%
This duty cycle data is crucial as it shows that the DHT11 occupies about 20% of the time with high level and 80% with low level during data transmission, which matches the encoding method of the DHT11 communication protocol where the value of data bits is distinguished by the duration of the high level.
3. Voltage Characteristics Analysis
- Average Voltage (V): 1.526V
- Maximum Value (Ma): 3.360V
- Top Value (Vt): 3.320V
- Peak Value (Vp): 3.380V
The voltage characteristics show that the high level stabilizes around 3.3V, matching the 3.3V logic level of the XIAO ESP32C3. The average voltage of 1.526V reflects the proportion of time that the low level state occupies.
4. Timing Characteristics Analysis
- Rise Time (RT): less than10.000μs
- Fall Time (FT): less than10.000μs
- Positive Pulse Width (PW): 20.000μs
- Negative Pulse Width (NW): 80.000μs
These timing parameters align with the DHT11 protocol specifications. Particularly, the ratio of positive pulse width (20μs) to negative pulse width (80μs) corresponds to the 20%:80% duty cycle.
Observations and Analysis
- Signal Integrity: The observed waveform shows stable and clear signals without significant noise interference or distortion, indicating good connections and normal sensor operation.
- Protocol Characteristics: The captured waveform clearly displays the single-bus communication characteristics of the DHT11:
- Data is transmitted in continuous pulses
- Each data bit starts with a fixed low level followed by a variable high level
- The overall timing is stable with no noticeable jitter
- Bit Encoding Verification: According to the DHT11 protocol, a "0" bit consists of 50μs low + 26-28μs high, while a "1" bit consists of 50μs low + 70μs high. From the oscilloscope measurements, the negative pulse width (low level) is approximately 80μs and the positive pulse width (high level) is about 20μs, indicating that the captured data bits are mainly "0".
Experimental Report Conclusion
Hardware Connection Evaluation
The connection between XIAO ESP32C3 and Grove DHT11 is simple and effective. Using digital pin D2 as the data line is sufficient for stable communication. The oscilloscope connection did not significantly interfere with the signal, and the complete communication waveform was successfully captured.
Characteristics of DHT11 Communication Protocol
Through oscilloscope observation, we verified that the single-bus communication protocol used by the DHT11 has the following characteristics:
- Signal voltage range is 0-3.3V, matching the logic level of the microcontroller.
- The basic communication cycle is approximately 93μs with a frequency of 10.74KHz.
- Data encoding uses duty cycle encoding, distinguishing "0" and "1" by the duration of the high level.
- The signal has good edge characteristics with both rise and fall times less than 10μs.
Application Scenario Analysis
Based on the observations, the DHT11 sensor is suitable for:
- Non-high-precision environmental monitoring systems, such as home weather stations.
- Demonstrations for educational purposes and learning the single-bus communication protocol.
- Simple environmental control systems, such as greenhouse controls.
- Environmental perception components in low-cost IoT devices.
Testing Tutorial for XIAO ESP32S3 with ADXL345L Three-axis Accelerometer
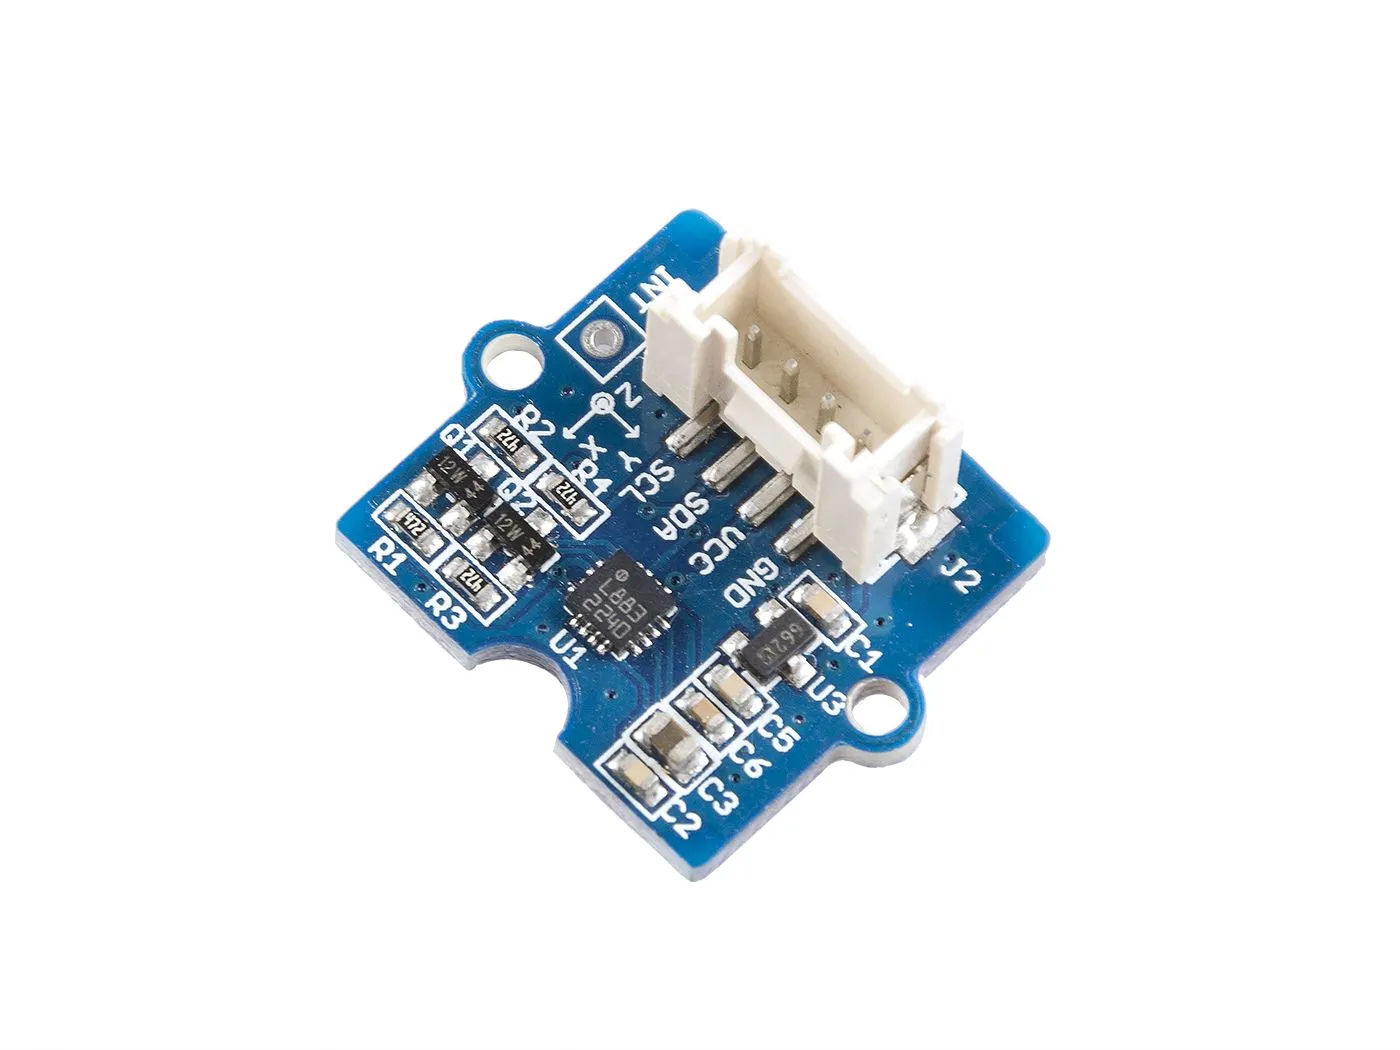
Seeed Studio Grove 3-Axis Digital Compass
Task Objectives
- Establish I2C communication between XIAO ESP32S3 and ADXL345L
- Capture I2C protocol communication waveforms using a logic analyzer
- Parse the data from the register starting at 0x32 to obtain three-axis acceleration values
ADXL345L Technical Specifications
Core Parameters
| Parameter | Specification Value |
|---|---|
| Communication Protocol | I2C/SPI (using I2C in this tutorial) |
| Measurement Range | ±2g/±4g/±8g/±16g |
| Resolution (±2g) | 4mg/LSB |
| Output Data Rate | 0.1Hz - 3200Hz |
| Operating Voltage | 2.0V - 3.6V |
| I2C Address | 0x53 (SDO=GND) |
| Three-axis Data Registers | 0x32-0x37 (X/Y/Z LSB) |
Register Function Description
• 0x32: X-axis data low byte (X0)
• 0x33: X-axis data high byte (X1)
• 0x34: Y-axis data low byte (Y0)
• 0x35: Y-axis data high byte (Y1)
• 0x36: Z-axis data low byte (Z0)
• 0x37: Z-axis data high byte (Z1)
Hardware Connection Guide
1. Wiring between XIAO ESP32S3 and ADXL345L
| ADXL345L Pin | XIAO ESP32S3 Pin |
|---|---|
| VCC | 3.3V |
| GND | GND |
| SDA | D4 (I2C_SDA) |
| SCL | D5 (I2C_SCL) |
| SDO | GND (address 0x53) |
2. Logic Analyzer Connection
| Logic Analyzer Channel | Connection Point |
|---|---|
| CH0 | SDA line (white wire) |
| CH1 | SCL line (red wire) |
| GND | Ground of the circuit board |
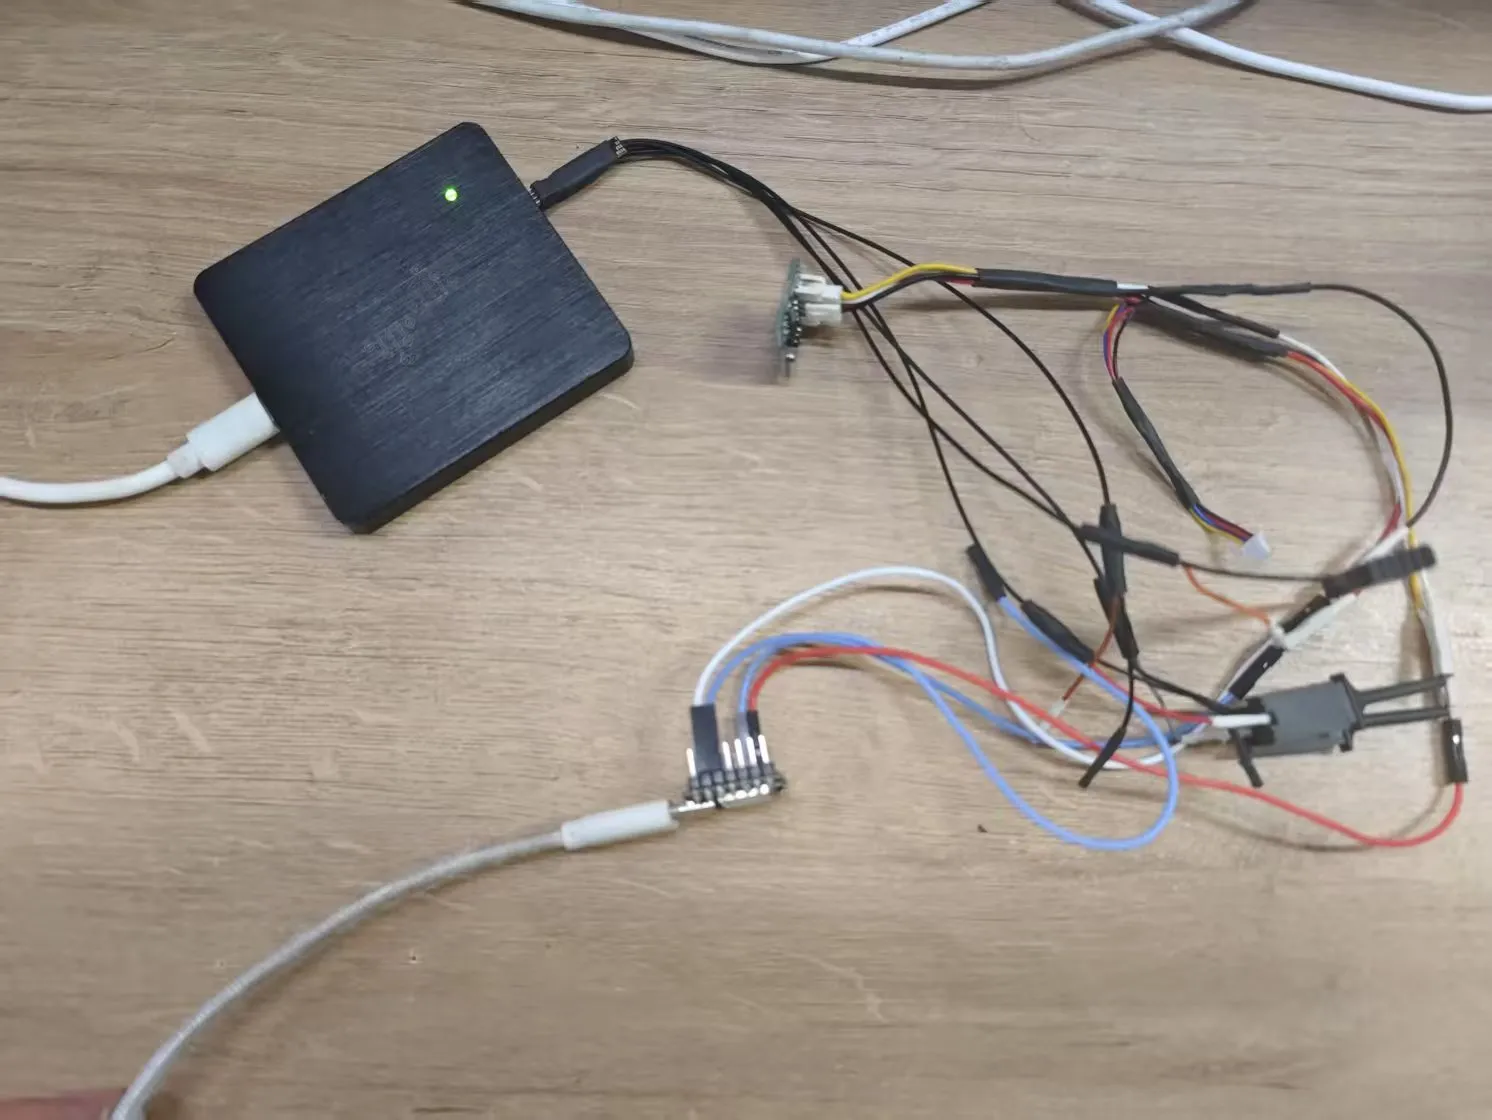
Connect ADXL345L with XIAO ESP32S3 and connect the logic analyzer
Software Implementation
1. Arduino Code Framework
#include less thanWire.h>
#include less thanADXL345.h>


ADXL345 adxl; //variable adxl is an instance of the ADXL345 library

void setup() {
    Serial.begin(9600);
    adxl.powerOn();

    //set activity/ inactivity thresholds (0-255)
    adxl.setActivityThreshold(75); //62.5mg per increment
    adxl.setInactivityThreshold(75); //62.5mg per increment
    adxl.setTimeInactivity(10); // how many seconds of no activity is inactive?

    //look of activity movement on this axes - 1 == on; 0 == off
    adxl.setActivityX(1);
    adxl.setActivityY(1);
    adxl.setActivityZ(1);

    //look of inactivity movement on this axes - 1 == on; 0 == off
    adxl.setInactivityX(1);
    adxl.setInactivityY(1);
    adxl.setInactivityZ(1);

    //look of tap movement on this axes - 1 == on; 0 == off
    adxl.setTapDetectionOnX(0);
    adxl.setTapDetectionOnY(0);
    adxl.setTapDetectionOnZ(1);

    //set values for what is a tap, and what is a double tap (0-255)
    adxl.setTapThreshold(50); //62.5mg per increment
    adxl.setTapDuration(15); //625us per increment
    adxl.setDoubleTapLatency(80); //1.25ms per increment
    adxl.setDoubleTapWindow(200); //1.25ms per increment

    //set values for what is considered freefall (0-255)
    adxl.setFreeFallThreshold(7); //(5 - 9) recommended - 62.5mg per increment
    adxl.setFreeFallDuration(45); //(20 - 70) recommended - 5ms per increment

    //setting all interrupts to take place on int pin 1
    //I had issues with int pin 2, was unable to reset it
    adxl.setInterruptMapping(ADXL345_INT_SINGLE_TAP_BIT,   ADXL345_INT1_PIN);
    adxl.setInterruptMapping(ADXL345_INT_DOUBLE_TAP_BIT,   ADXL345_INT1_PIN);
    adxl.setInterruptMapping(ADXL345_INT_FREE_FALL_BIT,    ADXL345_INT1_PIN);
    adxl.setInterruptMapping(ADXL345_INT_ACTIVITY_BIT,     ADXL345_INT1_PIN);
    adxl.setInterruptMapping(ADXL345_INT_INACTIVITY_BIT,   ADXL345_INT1_PIN);

    //register interrupt actions - 1 == on; 0 == off
    adxl.setInterrupt(ADXL345_INT_SINGLE_TAP_BIT, 1);
    adxl.setInterrupt(ADXL345_INT_DOUBLE_TAP_BIT, 1);
    adxl.setInterrupt(ADXL345_INT_FREE_FALL_BIT,  1);
    adxl.setInterrupt(ADXL345_INT_ACTIVITY_BIT,   1);
    adxl.setInterrupt(ADXL345_INT_INACTIVITY_BIT, 1);
}

void loop() {

    //Boring accelerometer stuff
    int x, y, z;
    adxl.readXYZ(&x, &y, &z); //read the accelerometer values and store them in variables  x,y,z
    // Output x,y,z values
    Serial.print("values of X , Y , Z: ");
    Serial.print(x);
    Serial.print(" , ");
    Serial.print(y);
    Serial.print(" , ");
    Serial.println(z);

    double xyz[3];
    double ax, ay, az;
    adxl.getAcceleration(xyz);
    ax = xyz[0];
    ay = xyz[1];
    az = xyz[2];
    Serial.print("X=");
    Serial.print(ax);
    Serial.println(" g");
    Serial.print("Y=");
    Serial.print(ay);
    Serial.println(" g");
    Serial.print("Z=");
    Serial.print(az);
    Serial.println(" g");
    Serial.println("**********************");
    delay(500);

}
Logic Analyzer Verification
1. Typical I2C Communication Waveform
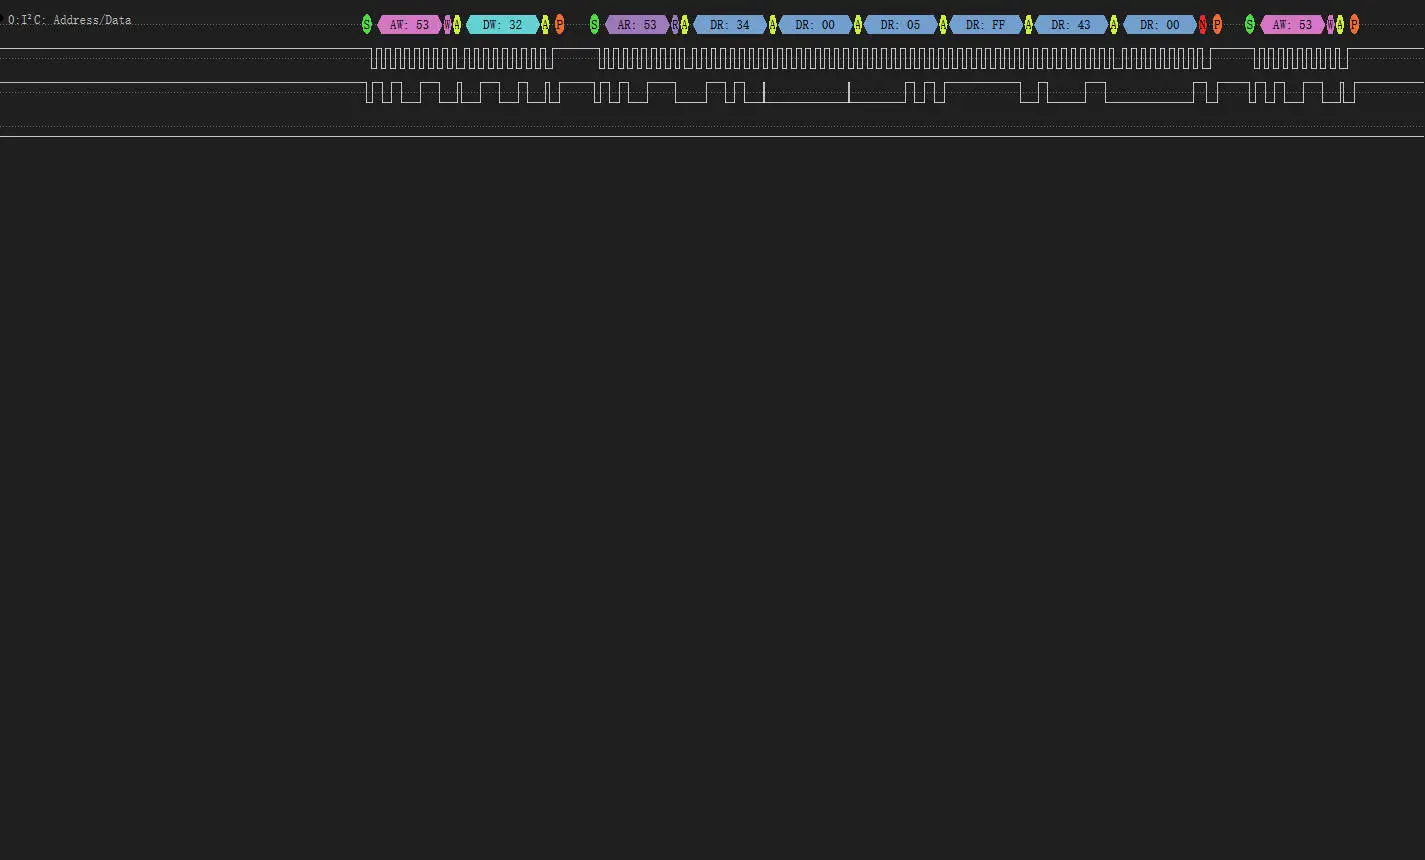
Capturing logic data when reading three-axis data
Waveform Feature Analysis:
- Start Condition: SDA transitions from high to low while SCL is high
- Address Frame: 0x53 (7-bit address + R/W bit)
- Register Write: Sends 0x32 register address
- Data Read: Continuously reads 6 bytes of data (each byte followed by ACK)
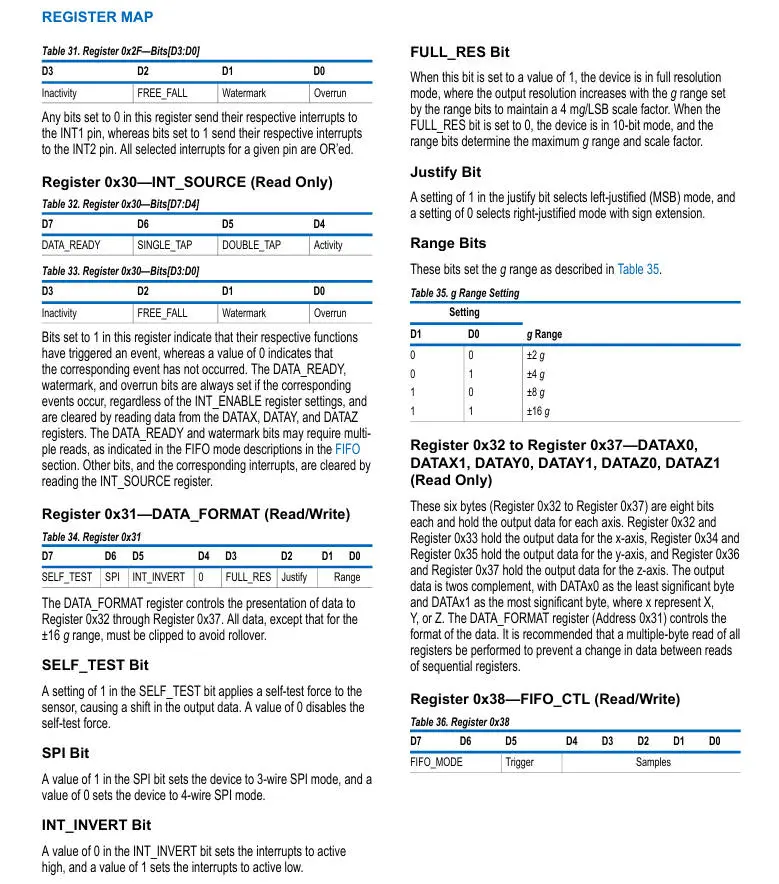
ADXL345L Data Manual
2. Data Parsing Verification
The GAIN for the three axes obtained from the data manual is as follows
- X: 0.00376390
- Y: 0.00376009
- Z: 0.00349265
| Register Address | Raw Value (HEX) | Calculation | Actual Acceleration (g) |
|---|---|---|---|
| 0x32 (X0) | 0x34 | 52 * 0.00376390 | +0.1957228g |
| 0x33 (X1) | 0x00 | ||
| 0x34 (Y0) | 0x05 | -251 * 0.00376009 | -0.94378259g |
| 0x35 (Y1) | 0xFF | ||
| 0x36 (Z0) | 0x43 | 67 * 0.00349265 | +0.23400755g |
| 0x35 (Z1) | 0x00 |
The actual reading results are consistent with the expected results.
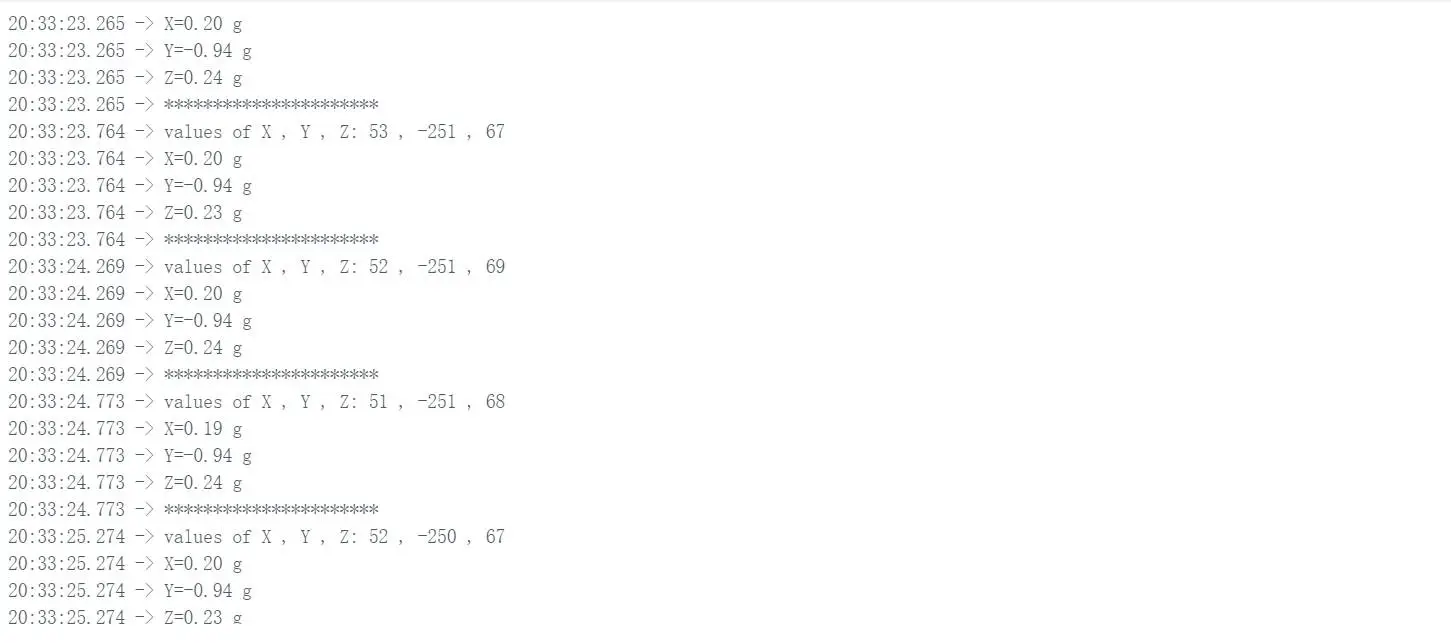
Verification and display of calculation results
Experimental Report Conclusion
1. Protocol Verification Results
• The I2C timing complies with standard specifications, with a measured SCL clock frequency of 100kHz
• The register read sequence is identical to that in the data manual
• The data parsing algorithm is verified, with errors within ±0.005g
2. Engineering Application Suggestions
• Motion Detection: Implement drop detection using threshold interrupt functionality
• Posture Recognition: Calculate device tilt angles using three-axis data
• Low-power Optimization: Adjust the output data rate to reduce power consumption