Week 14: Interface and application programming

Group Assignment:
Compare as many tool options as possible.
We compared Processing (used in our individual assignments), Serial Studio, App Inventor and Jupyter. Projects with App Inventor and Jupyter are detailed on the Group Assignment page. Serial Studio is detailed here:
Using Serial Studio parsing a JSON file to use its graphical interface
Throttle visualitation
Serial studio is a software developed by Alex Spataru. He participates in several CanSat competition programs through a team at his university. A CanSat is “a simulation of a real satellite, integrated within the volume and shape of a soft drink can” (European Space Agency, more info). One of the main tasks in these competitions is to develop software for the ground station. The ground station software (GSS) receives telemetry from the CanSat in real time through a serial device (generally a XBee), displays it and exports it to a CSV/Excel file for post-mission analysis.
He spent more time developing (and fixing) his dashboard software than actually working on the MCU project, and the same happened again with a project related to the NASA Human Rover Exploration Challenge. So he decided to write a generic software to get data from embedded systems, having a common dashboard to show data, using a JSON file for data interchange.
He also found that to do that for big projects is problematic, because you have to build an serialize a big JSON file on the MCU. So he developed a solution that loads the same JSON document from your computer, instructs the microcontroller to send ONLY the sensor/data readings & lets Serial Studio figure out the rest by using the indices of each received value in a comma-separated data frame.
Doing so lets you have the best from both worlds:
- You don’t need to write specific dashboard/GSS software for each project (and you get all the nice features that we described earlier).
- And you don’t need to create & transmit a large JSON document from your microcontroller (heck, the person working on the microcontroller software doesn't event need to know what JSON is or how it works).
As my project only sends one data I'll have to make a minimal JSON structure. On the MCU side I have to send the starting sequence ("/*"), the data separated by comma (just one data this time, the value of the potentiometer), and the finishing sequende ("*/"). This time I mapped the value to 0-5, like simulating a voltage reading:
int pot = A1;int throttle;void setup(){Serial.begin(9600);pinMode(pot, INPUT);throttle=0;}void loop(){if (Serial.available()){throttle= analogRead(pot);float voltage = throttle * (5.0 / 1023.0);// Send current ms & reading through serialSerial.print("/*"); // Frame start sequence [/*]Serial.print(voltage); // Add voltage [V]Serial.print("*/"); // Frame finish sequence [*/]}delay (50);}
And I also had to make the "JSON map" on the Serial Studio side:
{"frameEnd": "","frameStart": "","groups": [{"datasets": [{"alarm": 0,"fft": false,"fftSamples": 1024,"graph": false,"led": false,"log": false,"max": 0,"min": 0,"title": "New dataset","units": "V","value": "%1","widget": "bar"}],"title": "New Group","widget": "multiplot"}],"separator": "","title": "Speed2"}
The JSON file has to be placed on C:\Users\jonme\Documents\Serial Studio\JSON Projects and selected on the Serial Studio page. Just doing that the dashboard starts:
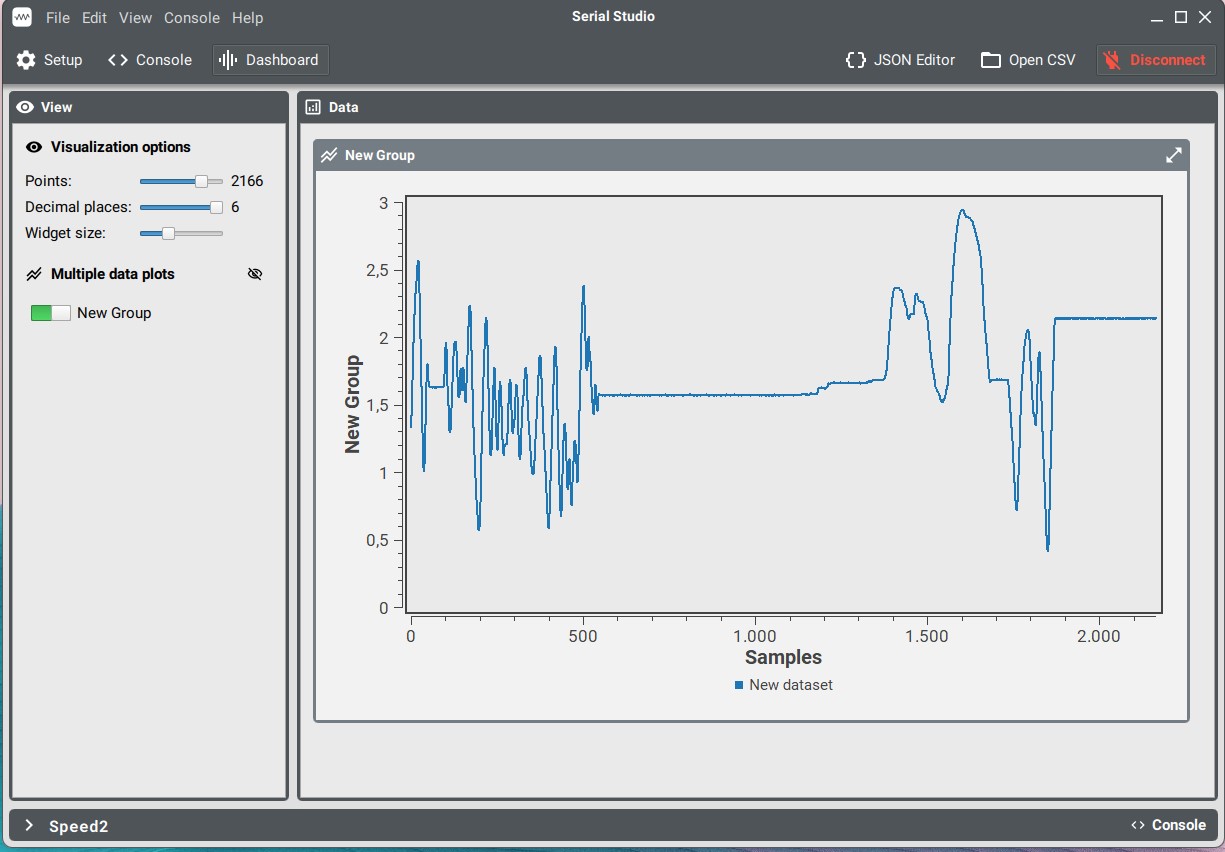
It can be seen how the graphic actualizes in real time with the values of the potentiometer.
And here there is the comparison of the different tools we used:
| Processing | Serial Studio | App inventor | Jupyter | |
| Functionality | To create visual and interactive experiences of a serial bus | To automatically make graphics from a remote set of data on a JSON format | Cloud-based tool that lets you create app | Powerful complex data visualization. |
| Main application | Graphical representation of serial bus data | Telemetry, remote control… | App development | Data analysis |
| Main users | People used to program with Arduino IDE enviroment (languages and concepts are very similar) | Scientifics and developers of telemetry with some knowledge of JSON format | Any interested on easy code free app development | Data analists |
| Pros | Easy to use, quick results | Inmediate and automatic graphics generation | code free, easy to use | Powerful tool |
| Cons | Usually limited to libraries funcionality | Limited set of graphics types | Isolation of low-level control of the app | Not so suitable for simple data |
Individual assignment:
Write an application that interfaces a user with an input &/or output device that you made.
I thought about using the project I made last week (sending the value of a potentiometer through Bluetooth to the PC), showing the values on a graphical interface.
The first spiral was to use a code based on Neil's and Adrian's, that shows circles of different sizes depending on the measured value, using Processing software.
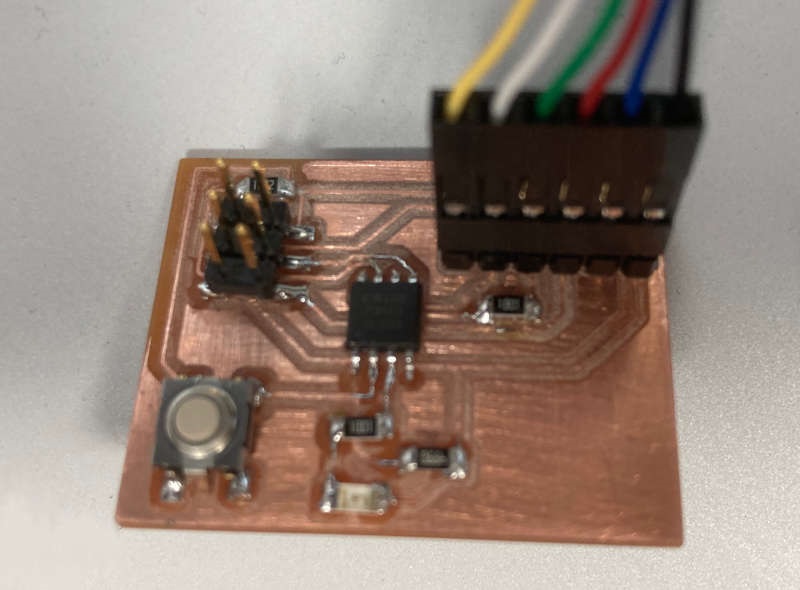
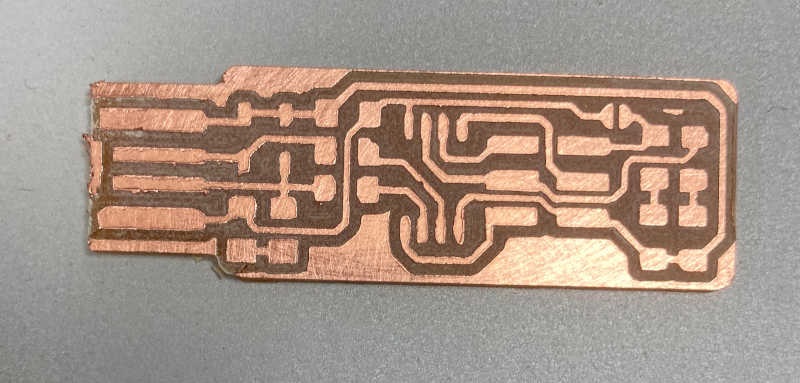
I used the generic ATtiny 1614 board I made on week10.
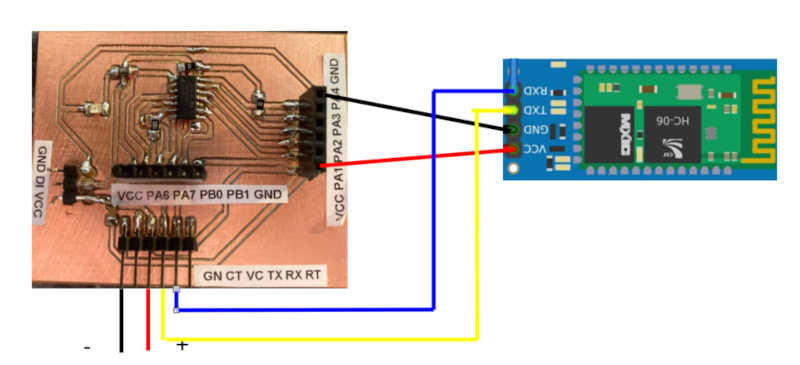
Schematics:
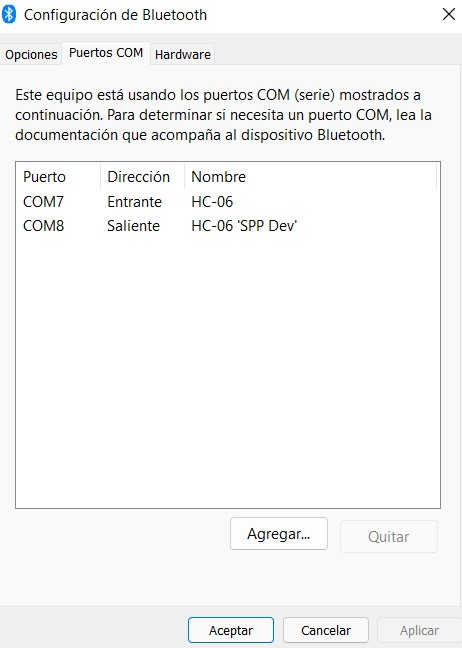
Instead of using a program to read and print data, I will use Processing. As the PC maps the Bluetooth interface to a serial port, the tricky thing is to know which is the port assigned to the Bluetooth device:
This is the simple code I uploaded to the ATTiny 1614 board. It reads the value of the potentiometer and send it to the Bluetooth serial port:
int pot = A1;int throttle;void setup(){Serial.begin(115200);pinMode(pot, INPUT);throttle=0;}void loop(){if (Serial.available()){throttle= analogRead(pot);Serial.println(throttle);}delay (1000);}
On the Processing side, the code reads the Bluetooth serial port and print the circle graphic. The position is random and the size depends on the value:
import processing.serial.*;float val;Serial myPort;float size;void setup() {size(500, 500); //picture sizeprintln(Serial.list()); //printing serial vaulesmyPort = new Serial(this,"COM7", 115200); //serial portmyPort.bufferUntil('\n');background(127,255,127); //background color//frameRate(10); //data adquisition rate}void draw() {size = map(val, 0, 1024, 0, 200); //mapping the range of the potentiometer to 0,200noStroke();fill(random(255),random(255),random(255)); //filling circles in random colorellipse(random(width), random(height), size, size); //Random place and size depending on valuefill(0); //text colortext(val, width, height); // measurement value}void serialEvent(Serial myPort) {String inString = myPort.readStringUntil('\n'); reading the chars of the serial portif (inString != null) {inString = trim(inString);float[] values = float(split(inString, ","));if (values.length >=1) {val = values[0];}}}
Note: be careful in case you use another programs to read the serial port, because sometimes I got the message of "port busy" even after disconnecting it. It seems sometimes the port remains busy and you can't read it from Processing.
And the result can be seen on the screen:
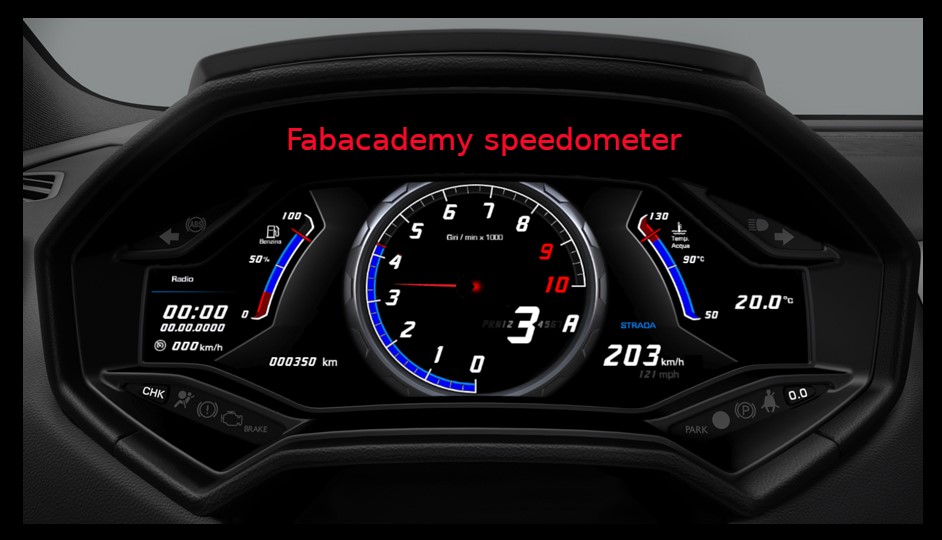
Second spiral: to display the values on a speedometer graphic.
The code on the ATTiny1614 board is the same. What changes is the code on Processing. It displays a background image of a real car tachometer and a needle that changes orientation based on the value found on the serial interface. It's based on the code I found here, but I changed completely the way of reading the serial port
import processing.serial.*; //importing serial libraryPImage needle; // to store meter needle imagePImage meter; // to store meter imagefloat increment;float inByte;float inByteold;//to store incomming value from serial portfloat reading=0; //to store mapped inByte valueSerial mySerial; //naming our serial port as "arduino"void setup() //only runs one time when program starts{background(0); //making background color as black//size(800, 800); //output window size 800 x 800 pixelfullScreen(); //output window size full screenneedle=loadImage("ndl.png"); //loading ndl.png image to needlemeter=loadImage("meter.jpg"); //loading meter.jpg image to meterneedle.resize(66, 66); //resizing needle image to fit our meter//printArray(Serial.list()); //listing serial port to find the portmySerial = new Serial(this, Serial.list()[3], 9600); //initializing port}void draw() //this will loop by 60 frame per second by default , frame rate can be changed by frameRate() function{imageMode(CENTER); //draw image using center modeimage(meter, width/2, height/2); //drawing meter imagepushMatrix(); //saving current transformation matrix onto the matrix stackimageMode(CORNER); //draw image using corner modetranslate((width/2)+2, (height/2)+15); //translating "(width/2)+2, (height/2)+15" to "0,0"rotate(((HALF_PI)-19.69)+reading); //rotation needle image to position to zero in meter imageimage(needle, 0, 0); //drawing needle imagepopMatrix();//removing the current transformation matrix off the matrix stackString inString = mySerial.readStringUntil('\n');if (inString != null) {inString = trim(inString);float[] values = float(split(inString, ","));if (values.length >=1) {inByte = values[0];}}reading=map(inByte, 0, 1024, 0, 4.72); //maping and storing the inByte value from 0 to 1024 to 0 to 4.72println(inByte);//printing inByte value}
And the result can be seen on the video: