 Erwin Kooi
14 - Interface and application programming
“1 picture, 1000 words.”
Plotting some numbers on a screen is all fine and good, but how do you present the data in a meaningful way? Humans are visually oriented beings and our societies are strongly focussed on visuals. (Which can be hard sometimes for me as visually impaired person.)
- Group assignment:
- Compare as many tool options as possible.
- Individual assignment
- Write an application that interfaces a user with an input and/or output device that you made
- Not much. GUI programming (using C++) was a looong time ago.
- I want to animate a tractor moving to a wall, depending on the distance as measured by the board I made in the input week.
- I want to learn a quick way of interfacing microcontroller boards with a graphical display on the computer.
- There is a large number of graphic frameworks that will let you create the most awesome representations of data.
- The more flexible, the more complex these frameworks become.
- Tkinter is a good library for making basic interfaces in python programs.
- Keep It Simple Stupid
The group assignment went a bit different than other group assignments.
Nadieh Bremer does data visualizations for a living and she gave an introduction in a number of frameworks.
My main take-aways were:
- Rendering graphics in a browsed is done through HTML5 canvas or SVG (or WebGL, but that can become complex very quickly).
- Canvas is a fire-and-forget. Capable of plotting huge amounts of data but has no references to that data. You have to redraw the canvas when the data changes. There are tricks with overlapping canvases that will give the illusion of animation.
- SVG has references to data objects but this can overwhelm the allotted memory of the browser. The references let you dynamically specify properties for the object, without the need for redrawing the entire screen.
- WebGL uses the GPU instead of the CPU, allowing for massive parallel processing. But this requires very specific programming skills.
- There are a number of useful frgeneric n data visualisation. “It makes the simple things hard and the hard things simple”. It uses SVG’s to create the graphics.
- three.js, a wrapper for WebGL and useful when you have to create snappy animations with huge datasets. It uses WebGL (duh).
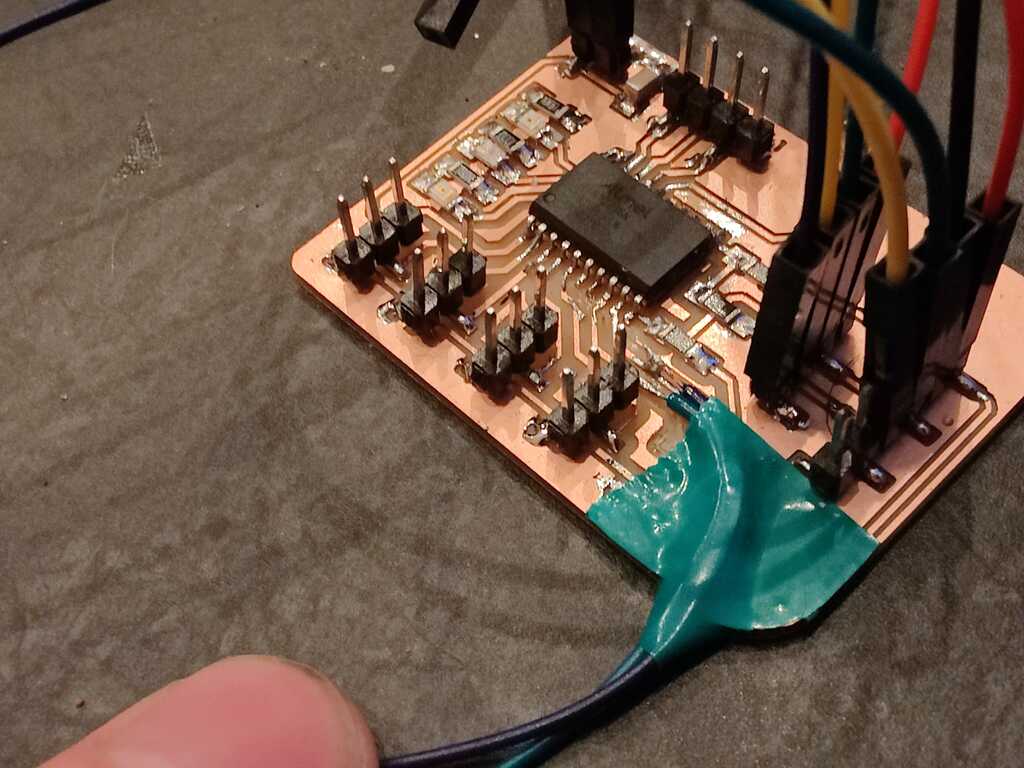 This will continue to build on the individual projects of weeks 10 and 12, the parking sensor for my tractor. The serial connector broke off, but adding wires directly to the traces fixed this for the short term. Not my best soldering work, but for now it will hold.
The plan is to have a window where tractor approaches a wall, depending on the measured distance by the sensor board.
There are two main options.
- Write a python program with easy access to the serial port and attach graphics
- Write a p5js program with easy graphics and attach the serial port
I started experimenting with p5.js, but quickly found that interfacing with the serial port was going to be tricky. It would require an intermediate program that translated the serial port to a websocket and then connect to that websocket using a p5.js library.
Mods has a serial->websocket module, but that would mean I would have to run mods if i want to interface with the sensor board. Too complicated.
  graph LR
    A1[serial port]-- serial -->A2[websocket converter]-- network -->A3[p5.js serial library]-->A4[graphics routines]-->A5[screen]
I will go for the first option, as it will be cleaner, simpler and I think that my future work wil focus more on python than p5.js.
  graph LR
    A1[serial port]-- serial -->A2[pyserial]-->A3[graphics routines]-->A4[screen]
This means selecting a graphical frontend for Python.
In Python, there are two main graphics libraries
- Tkinter
- WxPython
I will go for the first option. Tk/Tcl was around when I learned programming and I am an old fart. :-) But in earnest, Tkinter is very mature, well integrated and has an easy object model.
WxPython is not “bad” and has a huge library of widgets, but Tkinter feels more like me.
Tkinter runs its own loop to make sure that the screen is updated. Therefor there should be no blocking code anywhere else that prevents this loop from running.
It is possible to register a callback function that will be called when the Tkinter loop has finished one cycle. This callback function can be used for example to get data from the serial port.
The sensor board has to communicate with the computer. Since the value of the sensor will be the size of an AVR int (2 bytes), the computer has to be able to distinguish between the Most Significant Byte (MBR) and the Least Significant Byte (LSB).
This will be done using an identification sequence (preamble) at the start of the frame. The content of this sequence must never be equal to a valid measurement. (Otherwise the computer might think this is a measurement.)
When the measurement is out of range, it will have a value of 8192, which translates to MSB = 0x05, LSB = 0xff. Anything larger than 0x05 for the MSB will do the trick.
I choose 0xff, 0xff.
The protocol will therefor look like this:
  graph LR
    B0[0xff]---B1[0xff]---B2[MSB]---B3[LSB]
The first two bytes will be used for synchronization, then discarded. The third byte will be multiplied by 256 and added to the fourth byte. Now the complete distance measurement has been transferred.Rinse and repeat.
The Arduino code for the sensor board from week 12 has been updated to speak this protocol and was updoaded to the board.
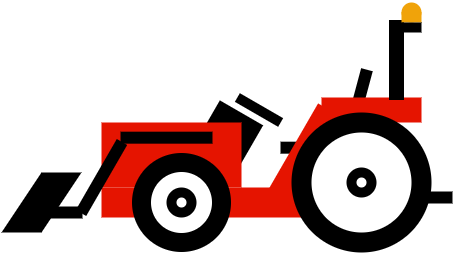 The image of the tractor can be created using Tk's rectangles and ovals. This would cause a lot of calculations to have each remain in the relative correct position, while moving the entire image (I tried...).
It is easier to create an image of a tractor using a graphics program and load that as an image into Tk. Then the entire image is moved as an image.
The image was made with the wonderful open source MS Visio alternative [drawio](https://diagrams.net) and exported as png image.
The image of the tractor can be created using Tk's rectangles and ovals. This would cause a lot of calculations to have each remain in the relative correct position, while moving the entire image (I tried...).
It is easier to create an image of a tractor using a graphics program and load that as an image into Tk. Then the entire image is moved as an image.
The image was made with the wonderful open source MS Visio alternative [drawio](https://diagrams.net) and exported as png image.
The code has three clear phases.
- initialization
- communication
- graphics
In the initialization phase, the graphics are setup and the serial port is opened.
root = tk.Tk()                  # a Tk instantiation called "root"
root.title("Parking Sensor")    # window title
root.bind("q", exit)            # hit q to exit

ser = serial.Serial("/dev/ttyUSB0", 115200) # Open the serial port with 115200 baud

#####

## Define a handler to be executed in the mainLoop
root.after(100, update, root, canvas)
## Keep the canvas updated
root.mainloop()
Communication through the serial port is done by the pyserial library, initialized in the initialization phase.
The code will wait processing till it receives two consecutive 0xff’s.
After that, it will read two bytes and calculate the distance from these two bytes.
    while (1):
        ## Wait for the start sequence of 0xff, 0xff
        byte1 = byte0           # store the previous received byte
        byte0 = ord(ser.read()) # store the new byte
        if byte1 == 255 and byte0 == 255: break # compare both

    ## Read the values, MSB first
    distanceH = ord(ser.read())
    distanceL = ord(ser.read())
    ## Calculate the value from the bytes
    distance = distanceH * 256 + distanceL
The graphics are
    ## Move the tractor image to the calculated position
    canvas.coords(image, (windowWidth-2*wallThickness - tractorWidth - (distance/displayScale)), (windowHeight-floorThickness-tractorHeigByte.

### What would I do differently next timeThe
* Not much. I would create classes for the graphical objects, so they can be arranged in a more abstract way.ht))
    ## Update the canvas
    canvas.update()
    ## Return when done
    parent.after_idle(update, parent, canvas)
All components are now working together.
- The vl53l0x ToF distance sensor from week 10.
- The LEDs on the board from week 10:
- green: distance > 25 cm
- yellow: 25 cm > distance > 10 cm
- red: 10 cm > distance
- The ssd1306 OLED display from week 12 (taped to the bottom corner of the monitor).
- A communication protocol from week 13.
- The graphical representation from this week 14.
The distance of the tractor to the wall as displayed on the screen is scaled to the length of the tractor in real life. So the proportions of tractor size and the distance to the wall will “feel” correct.
The source image of the tractor can be found here
The source code can be found here
- Most things went right. I started playing with p5.js, but interfacing with the serial port on linux would be tricky (and require additional tools to create websockets and websocket listeners). p5.js is awesome for creating quick graphics. The Coding Train is an excellent resource on youtube for getting started with it.
- The sensor board sent the decimal representation of the measured distance over the serial port. I changed this to raw byte values and added a preamble to be able to distinguish between the Most Significant Byte and Least Significant Byte.
- Not much. I would create python classes for the graphical objects, so they can be arranged in a more abstract way.