Week 17: Interface and Application Programming
2019.05.08
Individual Assignments:
- Write an application that interfaces with an input and/or output device that you made, comparing as many tool options as possible. Incomplete
Week 17 Contents:
Processing
Reading serial data from an Arduino
Processing is a programming language forked from the Arduino IDE that focuses on the visual arts. It enables you to create programs visualising data very easily. I'm going to follow this tutorial to get the Arduino talking to Processing.
I'm going to write a small program to take data from the Arduino and show it on screen in Processing. On the Arduino I need to read from the input pin and send data to the serial port:
// SENSORSKETCH01 - RUN THIS ON THE ARDUINO

int sensorPin = A0;   // select the input pin
int sensorValue = 0;  // variable to store the value coming from the sensor

void setup() {
  Serial.begin(9600); // initialise serial communication at 9600 baud
}

void loop() {
  sensorValue = analogRead(sensorPin); // read the value from sensorPin to sensorValue
  Serial.println(sensorValue); // print sensorValue
  delay(100); // wait 1/10 of a second
}
On the Processing side I need to import the serial library from Processing > Sketch > Import Library... > Serial.
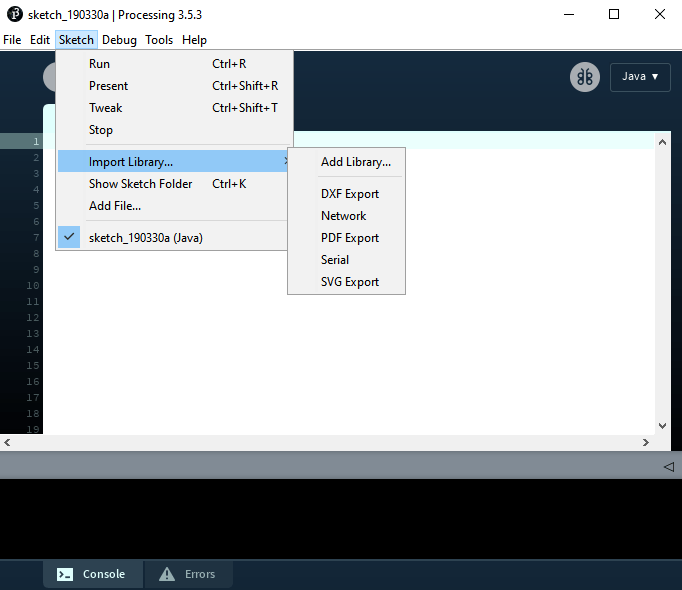
This creates the import processing.serial.*; line at the top of the Processing sketch. I then used println(Serial.list()); to see a list of connected COM ports. At this point I've connected a few different Arduinos to my system, so the Leonardo is on COM 7. This is the only COM port in the list, so Serial.list()[0] will be correct.
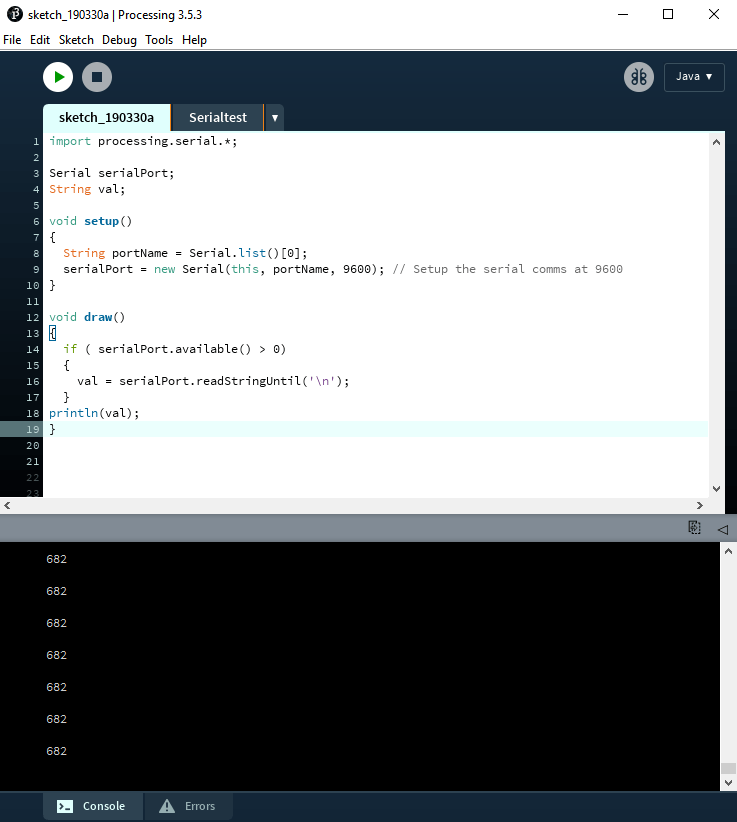
// DISPLAYSKETCH02 - RUN THIS ON PROCESSING

import processing.serial.*;

Serial serialPort; // serialPort is an object in the Serial class (can be anything)
String val; // variable to store data from object above

void setup()
{
  String portName = Serial.list()[0];
  serialPort = new Serial(this, portName, 9600); // Setup the serial comms at 9600
}

void draw()
{
  if ( serialPort.available() > 0)
  {
    val = serialPort.readStringUntil('\n');
  }
println(val);
}
Running the above program with the Arduino sketch above running on the Arduino generates values in the Processing Console window (it also flashes the TX (transmit) LED on the Leonardo):
Making Processing Display the Data
Presenting the serial data
I want to show a line on the screen that moves with the sensor data, like Neil's red/blue examples. I used the Processing tutorials to learn about drawing shapes on the processing canvas.
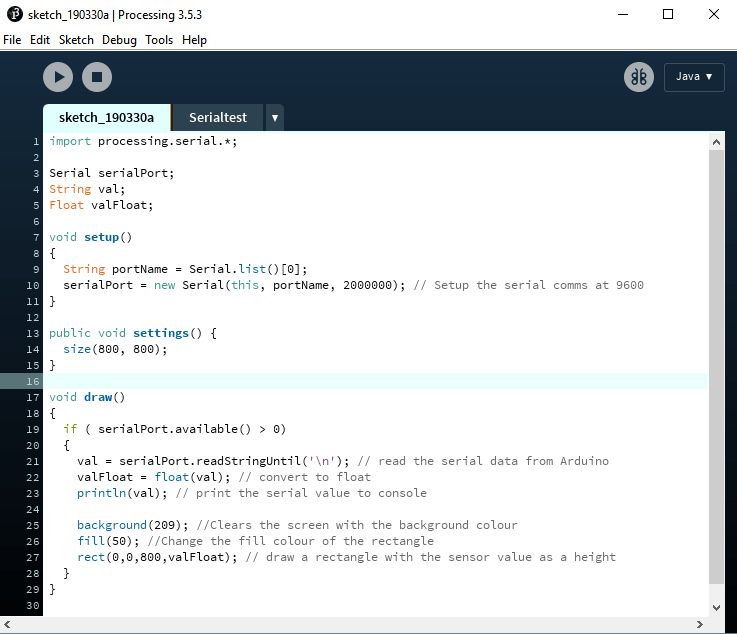
First of all I added a function called settings to control the size of the canvas:
public void settings() {
    size(800, 800);
}
To draw a rectangle I used rect(a,b,c,d);
| a | x coordinate |
| b | y coordinate |
| c | Rectangle width |
| d | Rectangle height |
I did a bit of conversion on the variable valFloat = float(val); This creates a new variable valFloat and sets it to the outcome of a conversion of the val variable to a float.
Then using rect(0,0,800,valFloat); for the rectangle, the program draws rectangles on the screen using the sensor values as the height of the rectangle. It works great and draws rectangles on the screen, but the old rectangles are still visible. I need some way of clearing the screen and only presenting the latest value.
Resetting the background does the job for us: background(209); resets the background to the colour 10, 50, 255 (RGB, 0-255). I then also added fill(50); to change the colour of the rectangle.
Here's the whole sketch:
I then added some text to the screen.
Moisture Sensor Testing
I'm using a moisture sensor to test these programs. It is a very cheap, and I suspect highly inaccurate, sensor with a small amplification board. It has a digital and analogue output. The digital output is 0 or 1. The analogue gives readings of between 0 and 1023. The numbers are driving me a bit nuts, I get a reading of ~681 when in the air down to ~270 when in the water. I have so far had the sensor plugged in to 3.3v. I changed it to 5v on the Arduino and the 'dry' reading shot up to 1023. The lower reading is still around ~270.
Back in the Arduino sketch, using the map and constrain functions I was able to tie down the numbers a little more:
// The variables are declared before the setup loop:
int rawHigh = 250;
int rawLow = 1023;
int toHigh = 0;
int toLow = 100;
Then these lines are added to the loop:
sensorValue = map(sensorValue, rawLow, rawHigh, toLow, toHigh);
sensorValue = constrain(sensorValue, 0, 100);
Because the canvas size in the Processing sketch is 800x800 I multiplied the readings by 8 to get a range across the screen.
Downloads
Arduino
Processing
sketch_111_processing.pde (< 1KB)
References
Online
- The Fab Charter [Accessed 30 Mar. 2018].