Week 11: Input Devices
2019.03.27
Individual Assignments:
- Measure something: add a sensor to a microcontroller board that you have designed and read it. Complete
Group Assignments:
- Measure the analog levels and digital signals in an input device. Incomplete
Week 11 Contents:
- Linear Transducer
- echo.hello_world and serial
- Processing 3
- Linear Transducer
- echo.hello_world and serial
- Processing 3 Introduction Initial tests with an Arduino Attempting a design with the ATMega32u4 The ATTiny44 board SoftwareSerial Power Issues Calibrating the sensor Success!
Arduino ATMega32u4 Board
Eagle Design
While my programmer and hello.world boards worked I felt it was more luck than judgement and did not fully understand what I was building. I need to improve and practise the process for building boards, so I have decided to build a number of boards over the coming weeks. Instead of building one board that allows both input and output and in order to practise Eagle, stuffing, soldering, etc I'm going to make boards specifically for each week. Building on what I learnt about Eagle and board production in Week 5 and Week 7, I have edited Luiz Bueno's BuenoBoardV2 to make it smaller and focused on input.
The process is similar to what came before:
- Add the parts in Eagle
- Join the parts using the schematic editor in Eagle
- Lay out and route the board in the board editor in Eagle
- Export the correct layers as 1200 DPI PNG
- Edit as required in Illustrator
- Create an outline in Illustrator
- Create RML toolpaths using mods/fabmodules for traces/outlines
- Mill the board
- Pick the parts, stick to tape
- Solder the parts, starting with the ATMega32u4 and the USB port (hardest parts)
- Test continuity with multimeter
- The 32u4 has a bootloader from the factory, so should be able to be programmed from the USB.
Software:
Milling:
Soldering:
Programming:
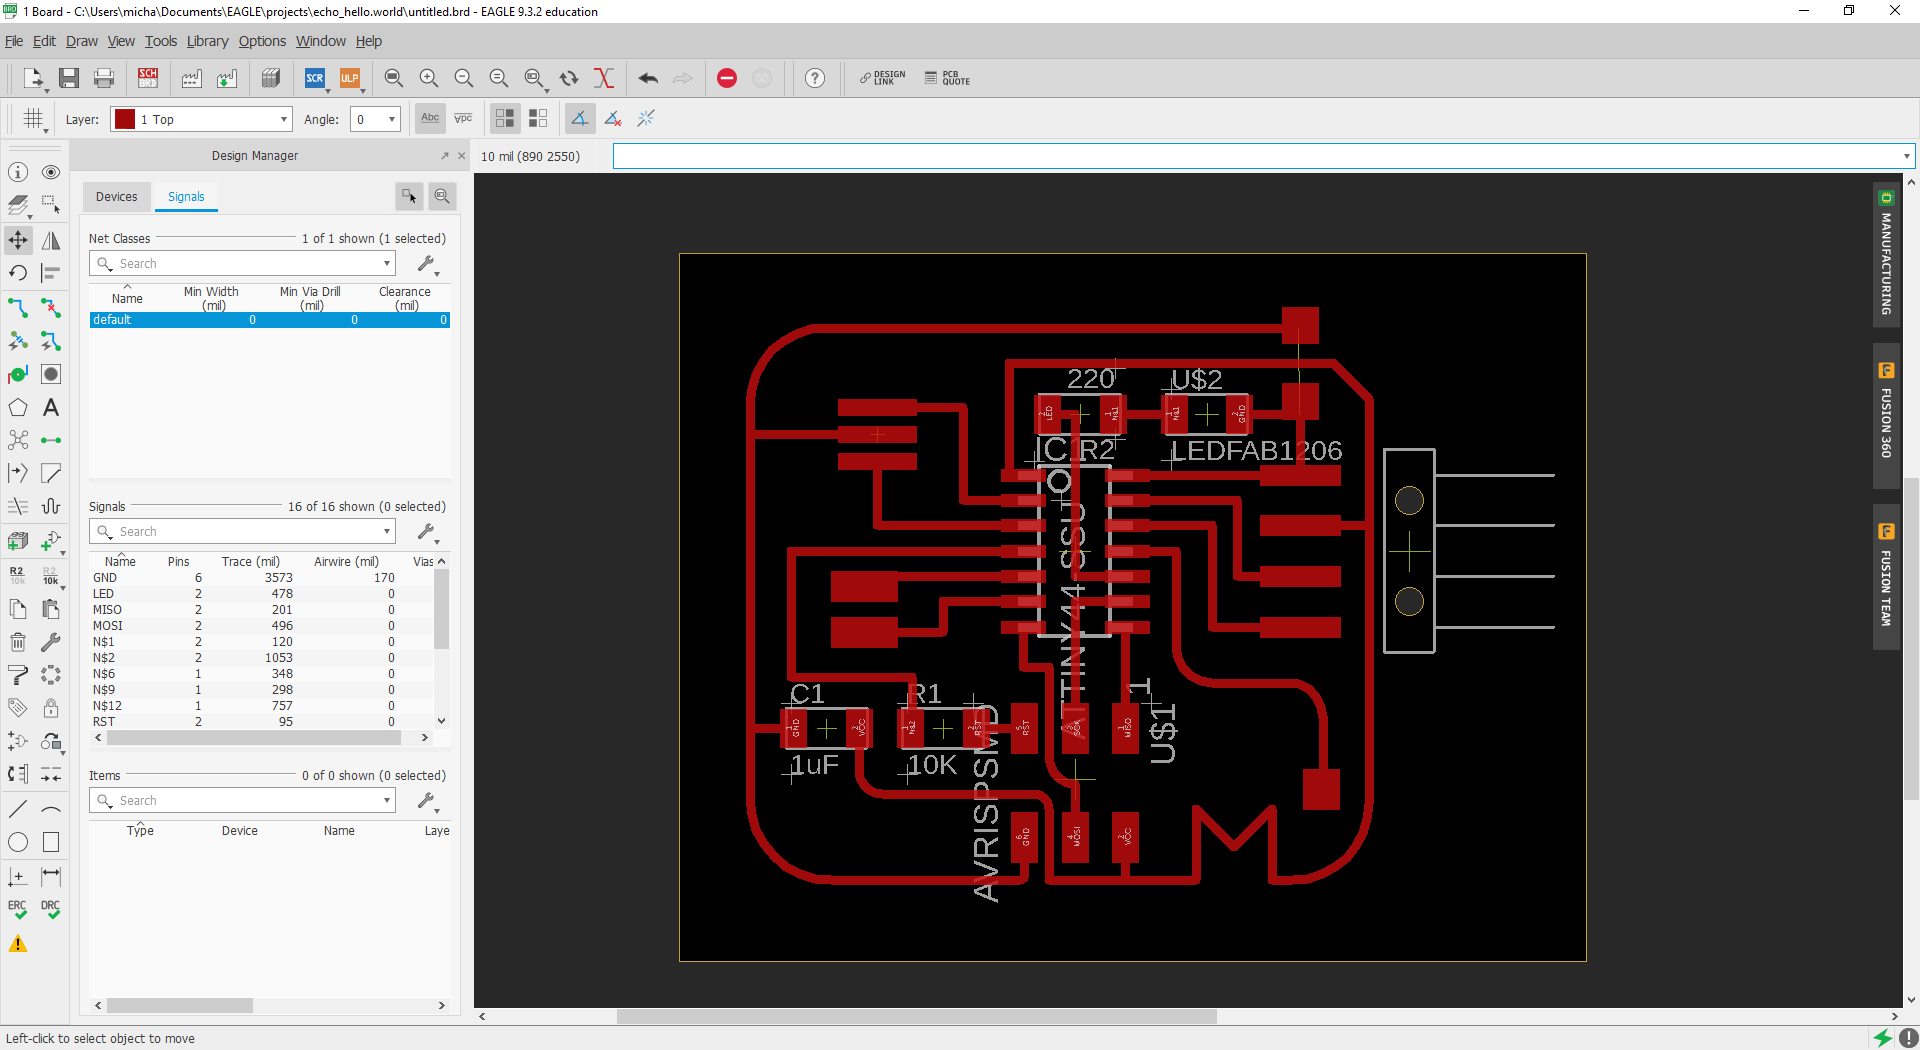
Eagle
Editing the board
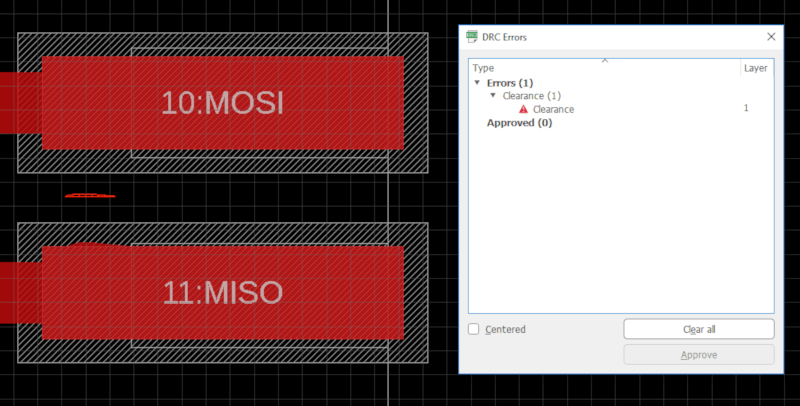
Looking at the DRC errors, there are two clearance issues and two 'airwires'. All 4 issues were really easy to solve. The clearance issues were extra bits on the end of traces causing a problem between pins on the ATMega32u4. The airwires were both on the GND traces and were not quite connected to the centre of their respective resistors. Sorted in a couple of minutes. The image below shows the last error. There is a tiny extra bit on the end of the traces to MISO (shown by the orange hashed area between MOSI and MISO):
The step up from the ATtiny44 hello.world board to the next level of microprocessors like the 328 and the 32u4 was a step too far for me at first. I milled 4 or 5 boards and could not get a single one to work. I was experiencing failures in multiple variables and a lot of the problems were caused by haste. I was making quick changes to a board by editing the PNG in Photoshop, rather than stepping back and checking design rules in Eagle. This caused me to mill a couple of boards with the pads not fully separated. Rushing to mill also caused me to cut through a board because I had not changed the outline when expanding the traces PNG. A lot of the experience that I thought I had built up fell away and I have to admit, I found it really tough to find the motivation to keep going. This was my "I want to quit" week.
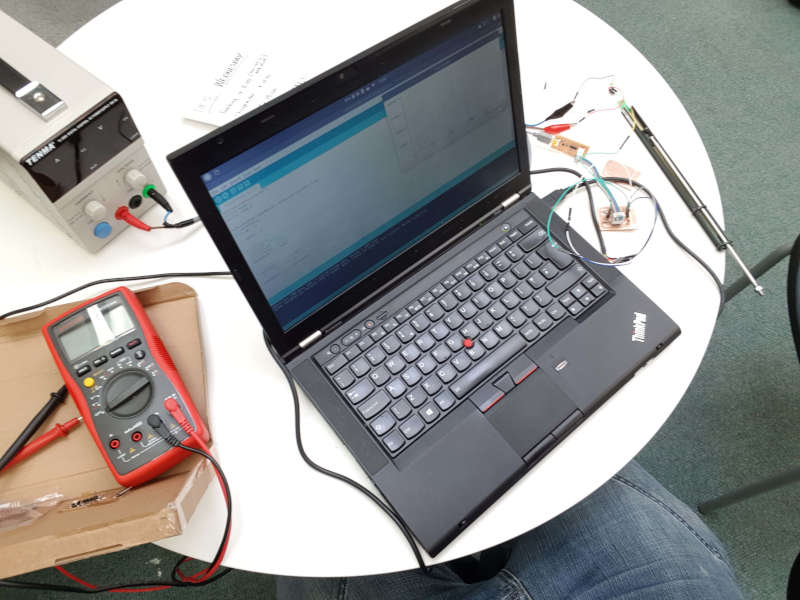
The main assignment was to read data from a sensor. I started with an Arduino, just to get the idea of how things worked. It is simpler than I imagined. Most of the sensors have three connections: VCC, ground and a data feed with some adding a fourth digital connection. Essentially it doesn't matter what the sensor is measuring, the output from the sensor is just a change in voltage.
Input Board: ATtiny44
A step back, to make a step forward
After struggling with the 32u4 board (I still do not know what was wrong: design or build) I have decided to step down to the ATtiny44 again and produce an input board using the foundation of the hello.world board to build upon. I am going to add an LED as I find this is an effective way to ensure a board can run a program before diagnosing other issues.
I did a lot of reading to make sure I understood the electronics before building the board and the data sheet which I found incomprehensible before started to come into focus.
Reset Pin
The reset pin is 'active LOW'. Setting the pin LOW externally will reset the microcontroller. This clears the registers and the program counter and 'tri-states' all pins (except the crystal pins). This tristate setting means the pin is set to a high impedance state. It is neither HIGH nor LOW put can be pulled to either with low current. This state allows multiple output devices to share a single bus as only the 'selected' device will have active output (HIGH/LOW) and any others would be set to the third high impedance state.
On my circuit the reset pin is only connected to the reset on the ISP header, so can only be reset by the programmer.
After power, the connections for the ISP and the transmit/receive for the serial (via FTDI cable) I have 4 pins left. I have used one to connect an LED. The other three I have left 'open' to allow up to three sensors to be connected. I imagine I will only use one, so I have not created space for extra power pins to connect the sensors.
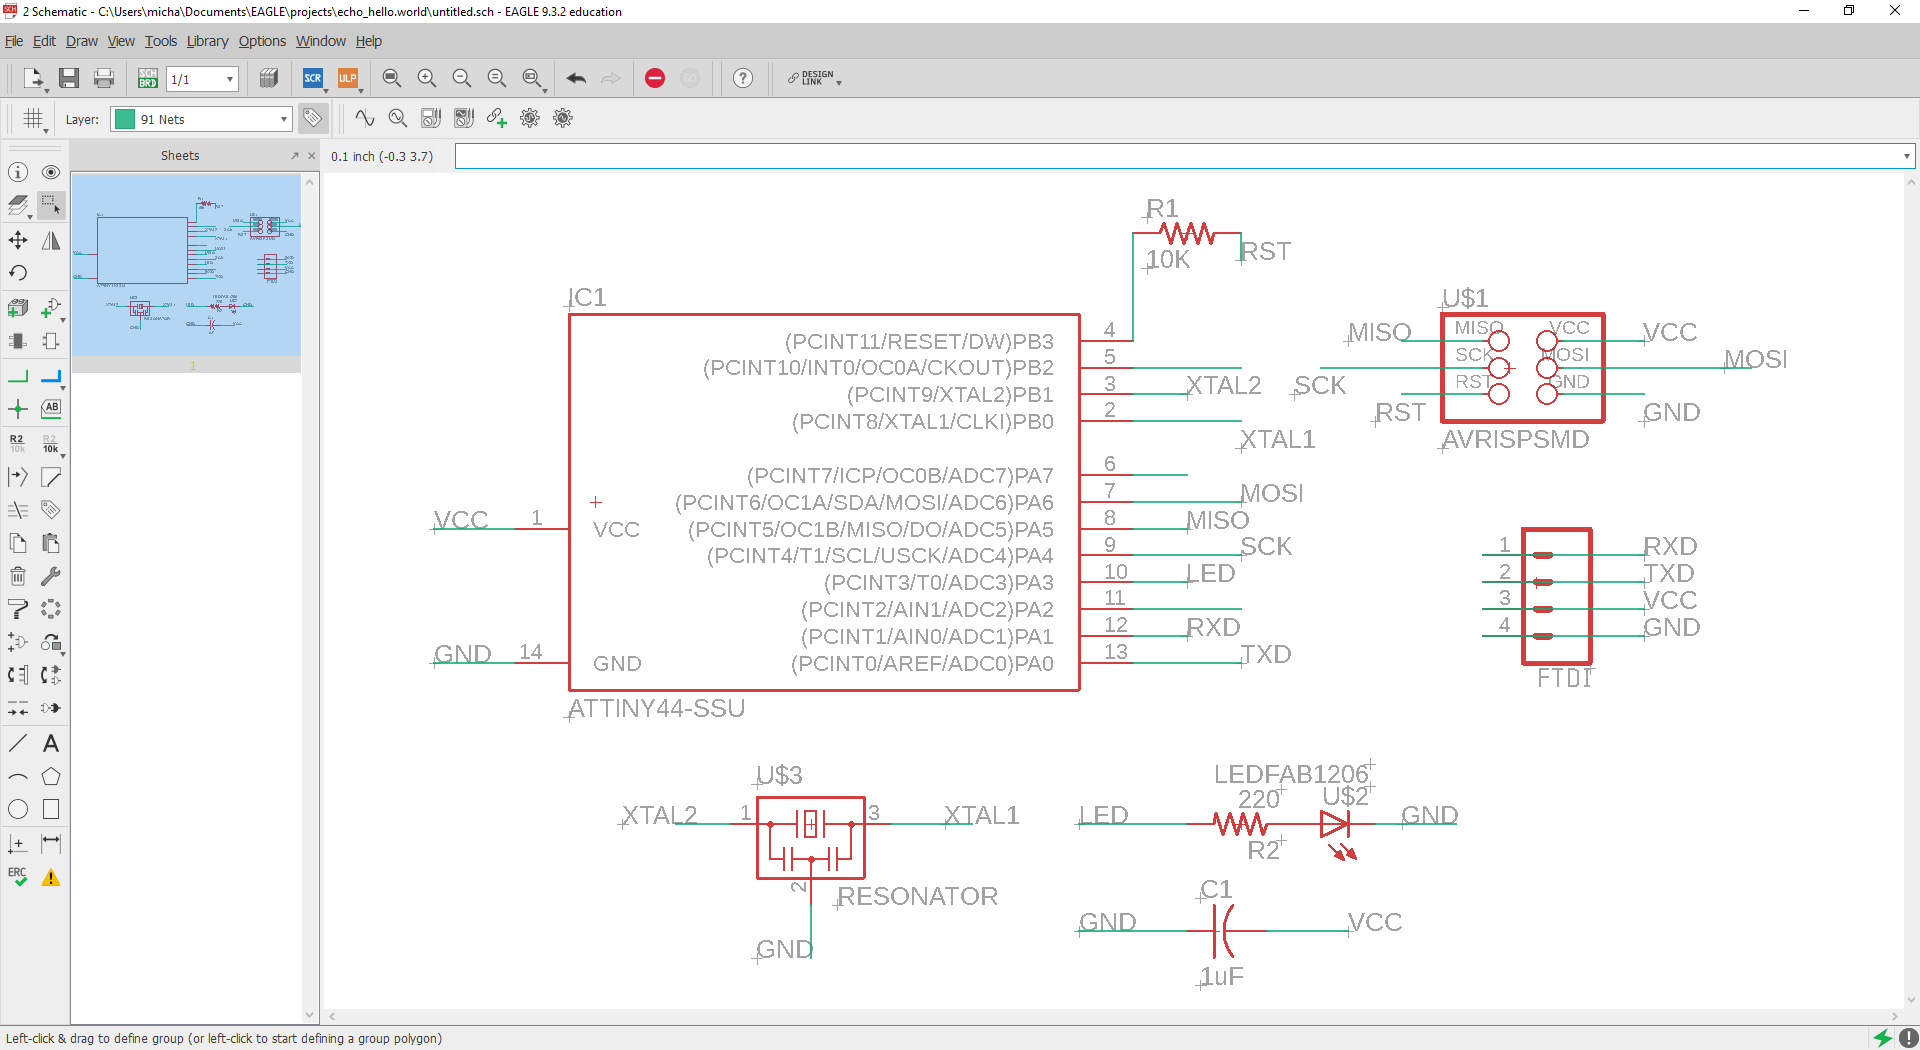
Here is the schematic for my input44 board:
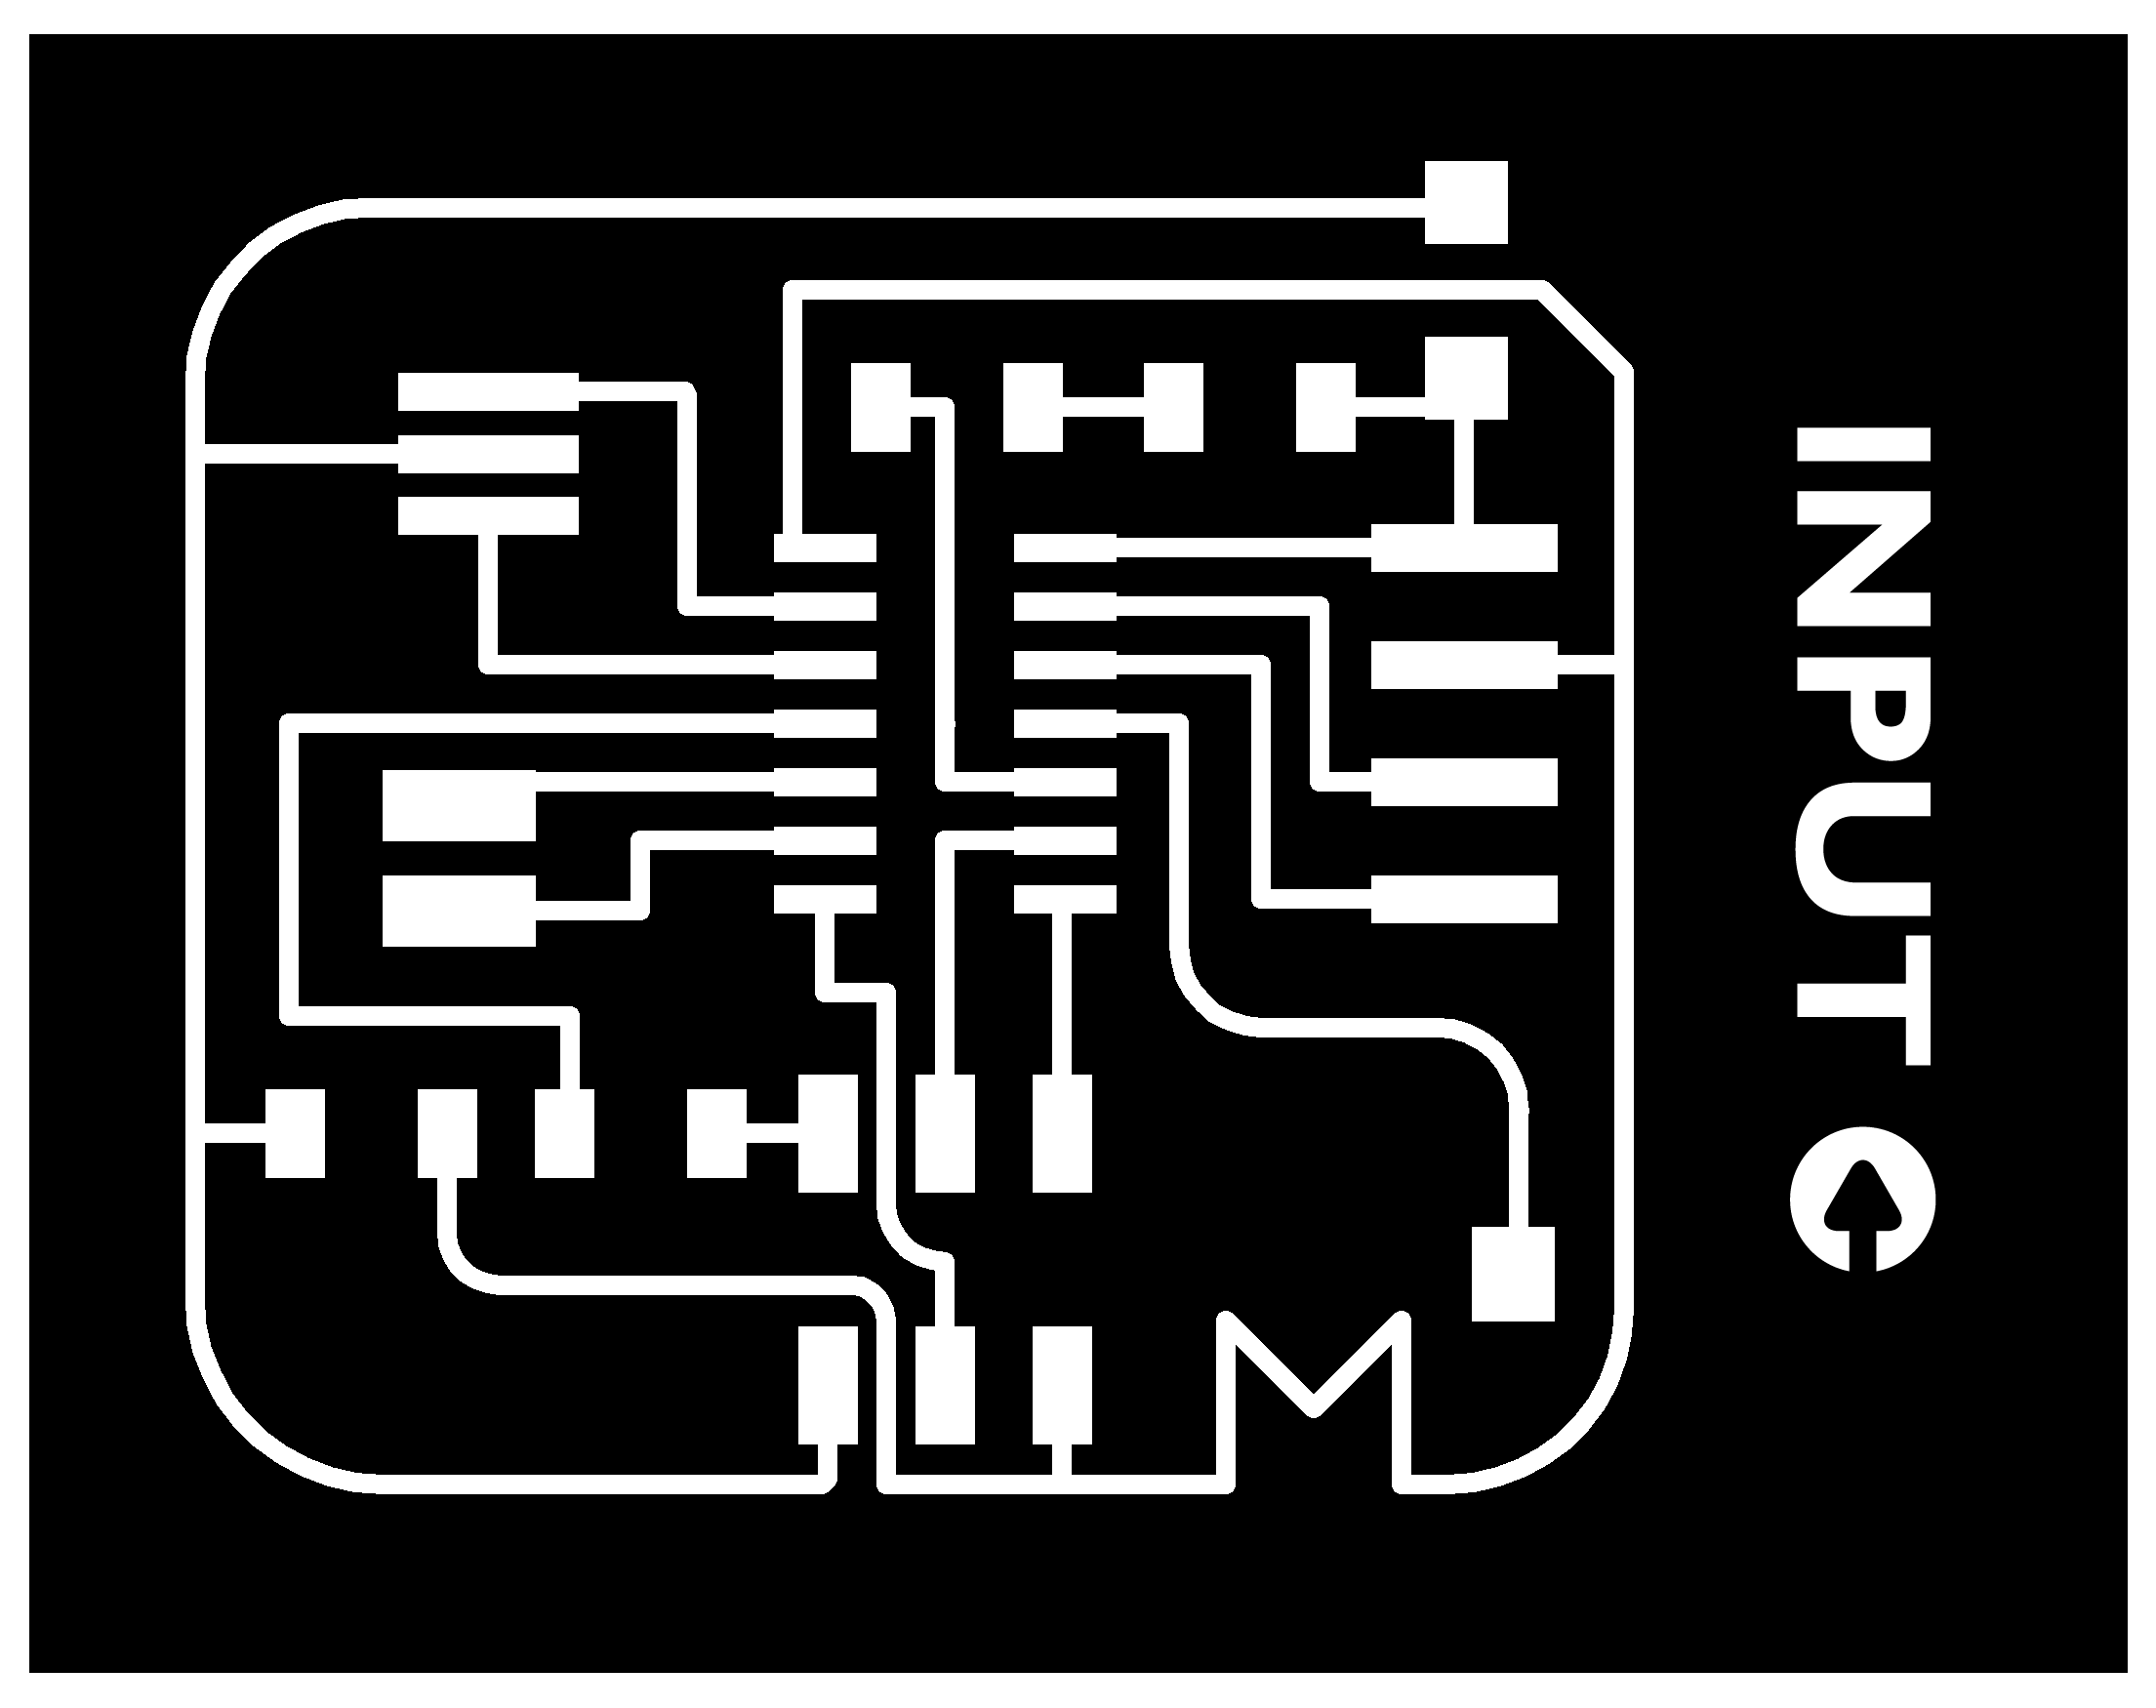
Here is the board layout for my input44 board:
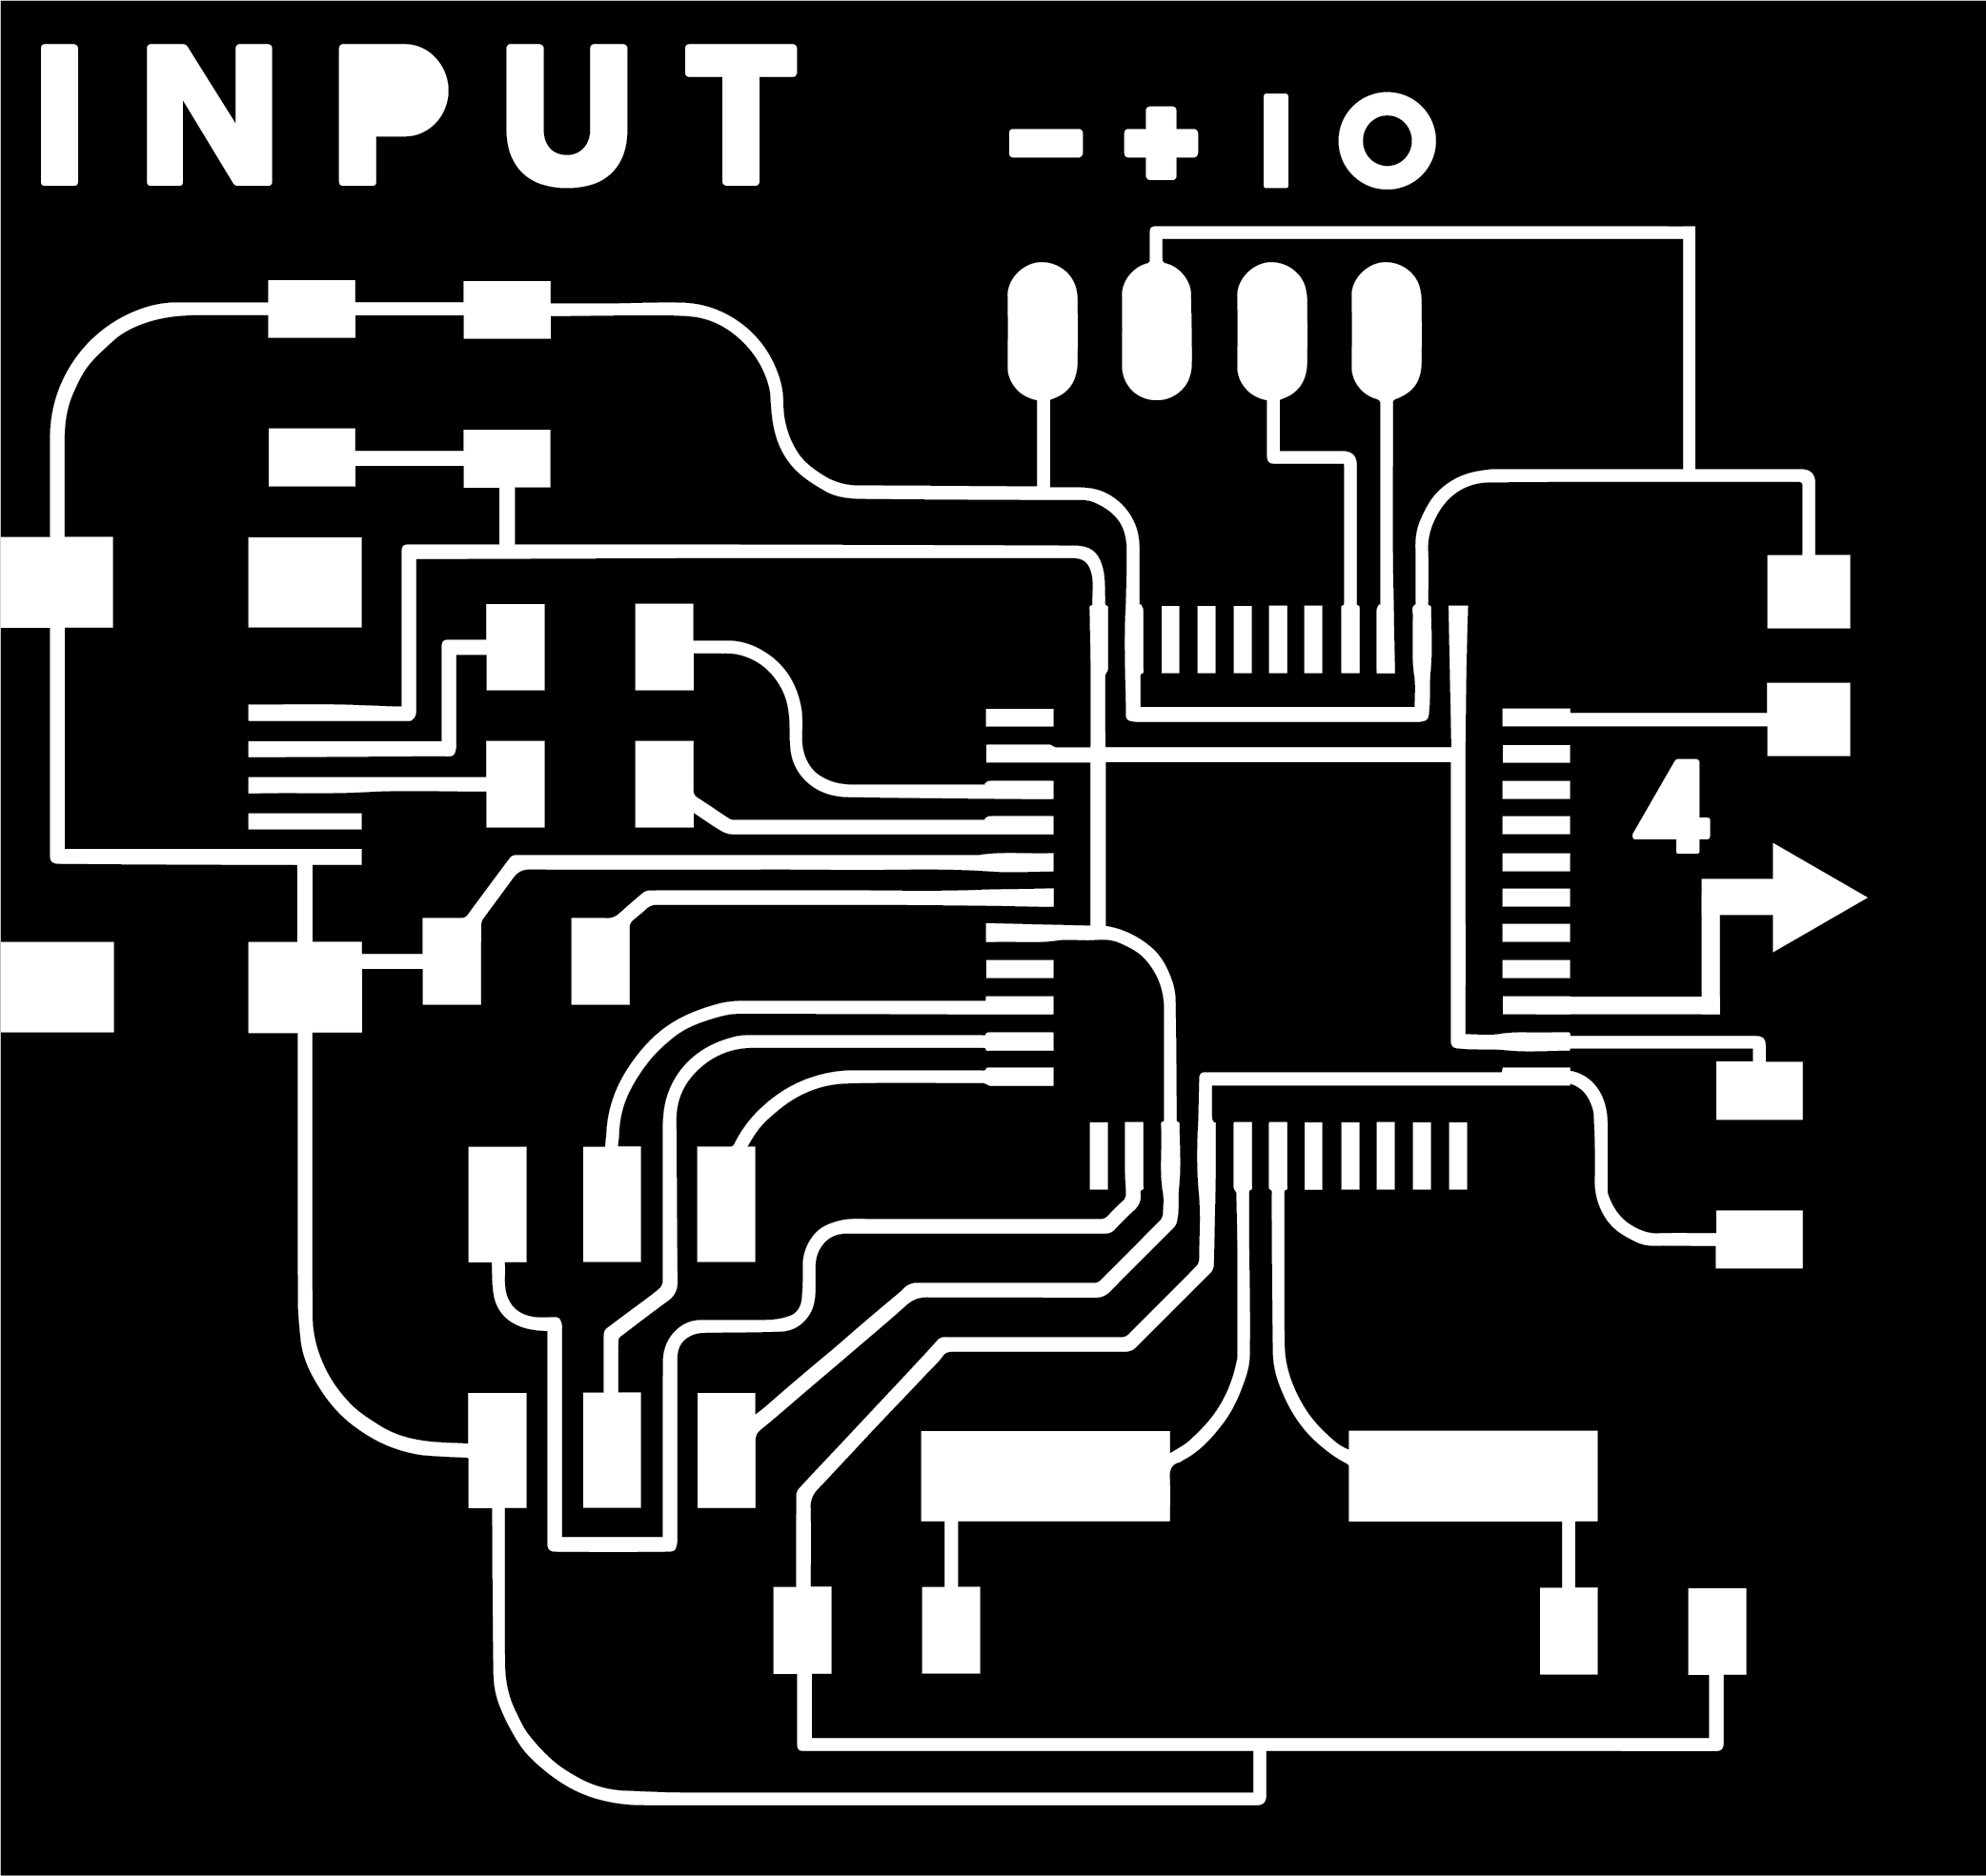
Here is the PNG for the input44, ready to be made into an RML file:
Input Devices
Linear Transducer
For these initial tests I have used an Arduino.
The input device I am going to look at is a linear transducer (linear meaning 'in a line' and transducer meaning 'transform output' in this case transforming linear measurements into an electrical signal). Essentially it is a variable size resistor. There is a resistant material strip wired to ground with a second part touching the strip wired to VCC. Depending on where the two parts touch a different amount of resistance is fed out on the signal line. Using analogRead() we can read the value from the pin. The Analogue to Digital Converter (ADC) will output a number between 0 and 1023. Reading the values at the extremes of travel on the linear transducer will help us calibrate the device. If I take a reading at 0mm, 50mm and 100mm of travel I can work out the relationship between the linear movement and the values read from the pin.
The linear transducer device will be really useful on the machine we are slowly building in the background - more info will be available on Week 18: Machine Design in due course.
The two images below show the metal rod moving and the contact block at the top of the rod making contact further down the resistant strip.
The connection to the Arduino was really simple - the red wire is Vcc, the black is GND and the yellow is the signal. I connected these to the relevant pins on the Arduino. I used pin A0 (analogue input pin 0) as the input pin for the yellow wire.
Serial Connection
The sensor is sending data to the microcontroller all the time, but we can't see what's going on. To be able to see the data and, by extension, do something useful with it we need to enable a serial connection from the Arduino board. The Arduino IDE provides two interfaces:
- A serial monitor which shows the serial data coming from the Arduino and allows you to send data back over serial (user input).
- A serial plotter which plots numeric data over time producing a graph.
Data is sent one byte at a time in the order that it is written (Nussey, 2013, p.112). The baud rate is the speed of the transfer. A baud rate of 9600 means that the board will transfer 9600 bits per second. The serial connection on the Arduino must be started at the same rate that is set in the serial monitor/plotter otherwise the output is gibberish.
Essentially the baud rate is an agreement that both sides understand the timing of the data - if I ask for someone's phone number and they say it too quickly I can't understand. I'm expecting them to say it at a certain speed, the same goes for the serial connection. Send the data two fast or too slowly and the receiver doesn't understand it.
In the Arduino IDE the serial monitor is in the top left hand corner of the interface. The values will cascade (sometimes too fast to read). The autoscroll toggle allows you to pause this cascade. If you get values you are not expecting, check the speed of the serial connection is the same in the sketch and the serial monitor (and that the chip is properly power - more on that later).
The basic code to start a serial connection:
Serial.begin(9600)
To output the value to serial:
Serial.println(variable) // The println function adds a \n newline after the data
Simple input to output code
The following code is extended from the code on the Arduino input example. It reads data from A0 and outputs in over serial with a small delay to slow the output.
int sensorPin = A0;   // select the input pin
int sensorValue = 0;  // variable to store the value coming from the sensor

int rawHigh = 250;
int rawLow = 1023;
int toHigh = 0;
int toLow = 100;

void setup() {
  Serial.begin(2000000); // initialise serial communication at this baud rate
}

void loop() {
  sensorValue = analogRead(sensorPin); // read the value from sensorPin to sensorValue

  //Calibrate the sensor by mapping the raw values to the min/max points
  sensorValue = map(sensorValue, rawLow, rawHigh, toLow, toHigh);
  sensorValue = constrain(sensorValue, 0, 100);

  Serial.println(sensorValue); // print sensorValue
  delay(100); // wait 1/10 of a second
}
I connected the linear transducer, programmed the Uno and the Arduino serial plotter dutifully showed me the input when I moved the transducer rod.
SoftwareSerial
Making it work on my own board
The board I produced is a redesign of the hello.world board with headers for connecting the pins. It uses the ATtiny44 processor which does not have hardware serial capability. The Arduino IDE has a library called SoftwareSerial. In operation it is very similar to 'normal' serial communication.
The official Arduino page on SoftwareSerial is here and more about the function here.
Essentially there are extra steps over using serial. You need to include the library. Then SoftwareSerial requires you to define the pins you want to use as Rx (receive) and Tx (transmit). You then need to create a named serial object (this allows you to have multiple SoftwareSerial connections, but you can only read from one at a time).
#include

const byte rxPin = 2;
const byte txPin = 3;

// set up a new serial object
SoftwareSerial mySerial (rxPin, txPin);
Once the mySerial object has been created, defining the pins, then the usual functions are used to start the serial connection.
// set the data rate for the SoftwareSerial port
mySerial.begin(9600);
At this point I encountered a major problem which I misdiagnosed as being a SoftwareSerial issue. The serial data I was seeing in the Arduino IDE serial monitor was gibberish, ASCII symbols, etc. This was a simple fix to get it looking more like the data I wanted: change the baud rate on the monitor. Tada! Readable data. However, on closer inspection, the data was still doing strange things. Every 10 lines or so it would skip a line completely or miss a line break so that two pieces of data (say "75" and "76" would get joined together as "7576". This caused the serial plotter to change the axis on the graph on the fly and meant that the values ranged from 75 to 7576 and sometimes higher depending on the numbers. There was something wrong, but my program was pretty simple, the chip was doing its thing and as far as I understood it should be working.
It turned out (after my nightly meditation on ATtiny44s) that I was using an FTDI cable that was providing 3.3v to the board. Not enough power to do things properly. I don't know if it's because the chip was running slower or that serial was mistimed because the clock was running slower or what the problem is when you don't provide enough power to the board, but I do know that when I powered the board and the sensor with a power supply and only used the FTDI cable for the serial duty, not power, everything worked fine.
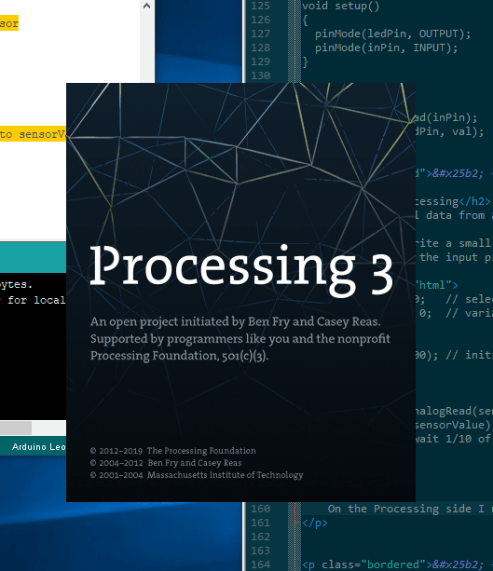
Processing
Reading serial data from an Arduino
Processing is a programming language forked from the Arduino IDE that focuses on the visual arts. It enables you to create programs visualising data very easily. I'm going to follow this tutorial to get the Arduino talking to Processing.
I'm going to write a small program to take data from the Arduino and show it on screen in Processing. On the Arduino I need to read from the input pin and send data to the serial port:
// SENSORSKETCH01 - RUN THIS ON THE ARDUINO

int sensorPin = A0;   // select the input pin
int sensorValue = 0;  // variable to store the value coming from the sensor

void setup() {
  Serial.begin(9600); // initialise serial communication at 9600 baud
}

void loop() {
  sensorValue = analogRead(sensorPin); // read the value from sensorPin to sensorValue
  Serial.println(sensorValue); // print sensorValue
  delay(100); // wait 1/10 of a second
}
On the Processing side I need to import the serial library from Processing > Sketch > Import Library... > Serial.
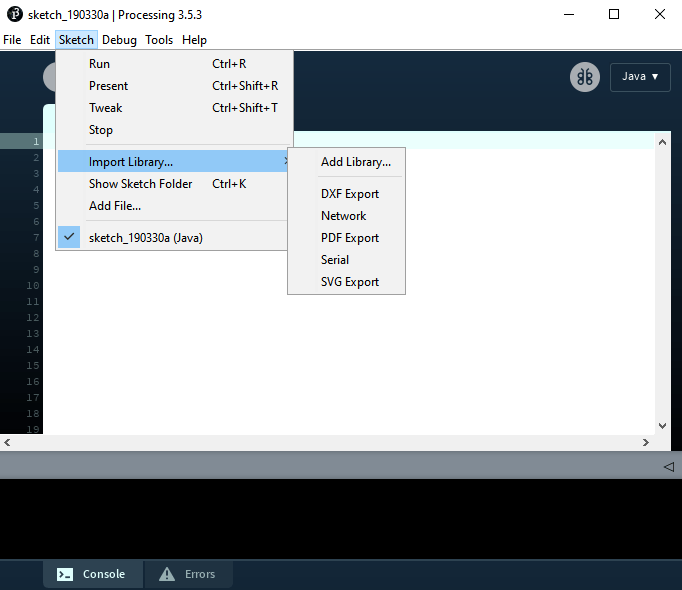
This creates the import processing.serial.*; line at the top of the Processing sketch. I then used println(Serial.list()); to see a list of connected COM ports. At this point I've connected a few different Arduinos to my system, so the Leonardo is on COM 7. This is the only COM port in the list, so Serial.list()[0] will be correct.
// DISPLAYSKETCH02 - RUN THIS ON PROCESSING

import processing.serial.*;

Serial serialPort; // serialPort is an object in the Serial class (can be anything)
String val; // variable to store data from object above

void setup()
{
  String portName = Serial.list()[0];
  serialPort = new Serial(this, portName, 9600); // Setup the serial comms at 9600
}

void draw()
{
  if ( serialPort.available() > 0)
  {
    val = serialPort.readStringUntil('\n');
  }
println(val);
}
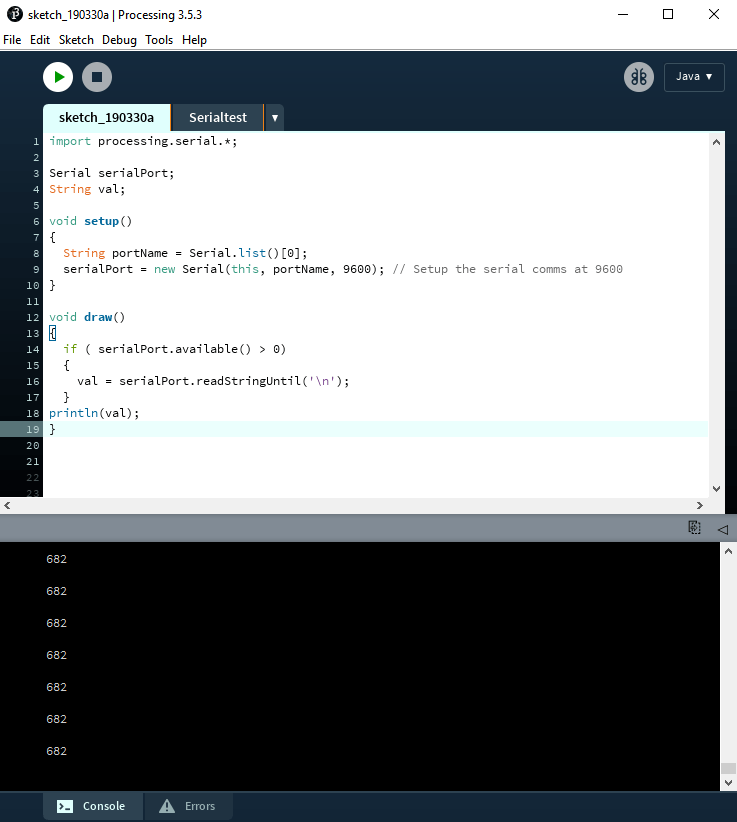
Running the above program with the Arduino sketch above running on the Arduino generates values in the Processing Console window (it also flashes the TX (transmit) LED on the Leonardo):
Making Processing Display the Data
Presenting the serial data
I want to show a line on the screen that moves with the sensor data, like Neil's red/blue examples. I used the Processing tutorials to learn about drawing shapes on the processing canvas.
First of all I added a function called settings to control the size of the canvas:
public void settings() {
    size(800, 800);
}
To draw a rectangle I used rect(a,b,c,d);
| a | x coordinate |
| b | y coordinate |
| c | Rectangle width |
| d | Rectangle height |
I did a bit of conversion on the variable valFloat = float(val); This creates a new variable valFloat and sets it to the outcome of a conversion of the val variable to a float.
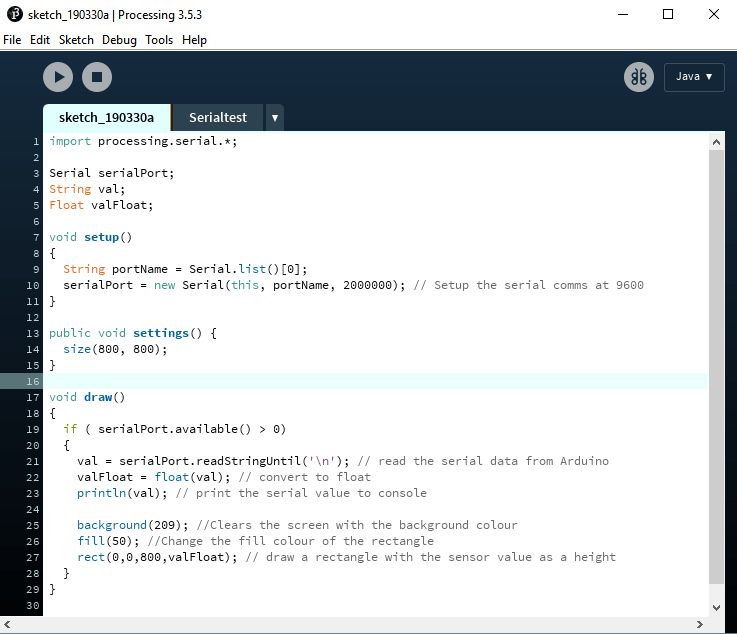
Then using rect(0,0,800,valFloat); for the rectangle, the program draws rectangles on the screen using the sensor values as the height of the rectangle. It works great and draws rectangles on the screen, but the old rectangles are still visible. I need some way of clearing the screen and only presenting the latest value.
Resetting the background does the job for us: background(209); resets the background to the colour 10, 50, 255 (RGB, 0-255). I then also added fill(50); to change the colour of the rectangle.
Here's the whole sketch:
I then added some text to the screen.
Moisture Sensor Testing
I'm using a moisture sensor to test these programs. It is a very cheap, and I suspect highly inaccurate, sensor with a small amplification board. It has a digital and analogue output. The digital output is 0 or 1. The analogue gives readings of between 0 and 1023. The numbers are driving me a bit nuts, I get a reading of ~681 when in the air down to ~270 when in the water. I have so far had the sensor plugged in to 3.3v. I changed it to 5v on the Arduino and the 'dry' reading shot up to 1023. The lower reading is still around ~270.
Back in the Arduino sketch, using the map and constrain functions I was able to tie down the numbers a little more:
// The variables are declared before the setup loop:
int rawHigh = 250;
int rawLow = 1023;
int toHigh = 0;
int toLow = 100;
Then these lines are added to the loop:
sensorValue = map(sensorValue, rawLow, rawHigh, toLow, toHigh);
sensorValue = constrain(sensorValue, 0, 100);
Because the canvas size in the Processing sketch is 800x800 I multiplied the readings by 8 to get a range across the screen.
Sensors Appendix
What are the options?
| Sensor | Notes | |
| Light Dependent Resistor / Photoresistor | Luminosity | Resistance increases when exposed to light. |
| Hall Effect Switch | Magnetic Field | Senses changes in magnetic fields, i.e. if a magnet is nearby. |
| Infrared Sensor | Notes | |
| Sensor | Notes |
Downloads
Arduino
Processing
sketch_111_processing.pde (< 1KB)
References
Online
- Stack Exchange: Tristate [Accessed 04 Apr. 2019]