Video Clip
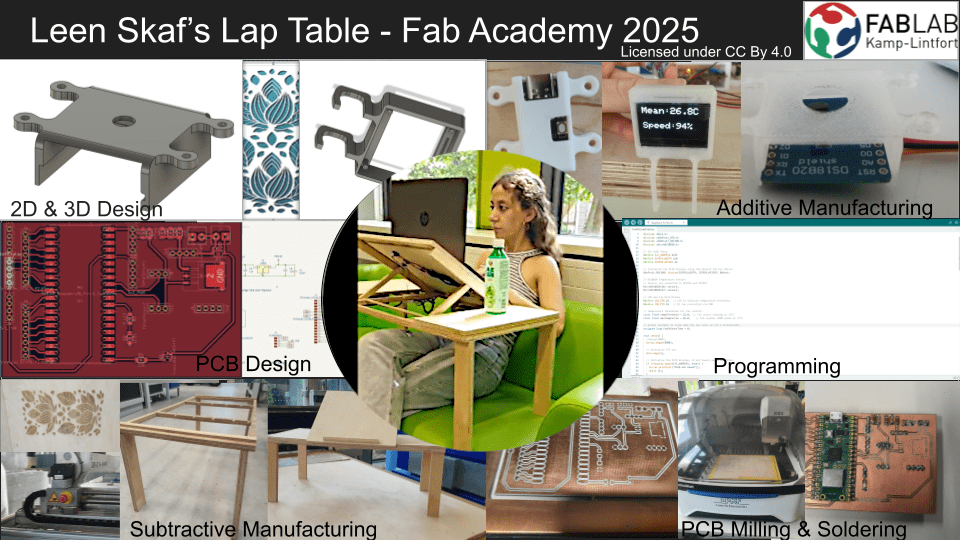
Summary Slide
Principles and Practices
- Plan and sketch a potential final project
This is where I will start defining my final project idea and start to get used to the documentation process.
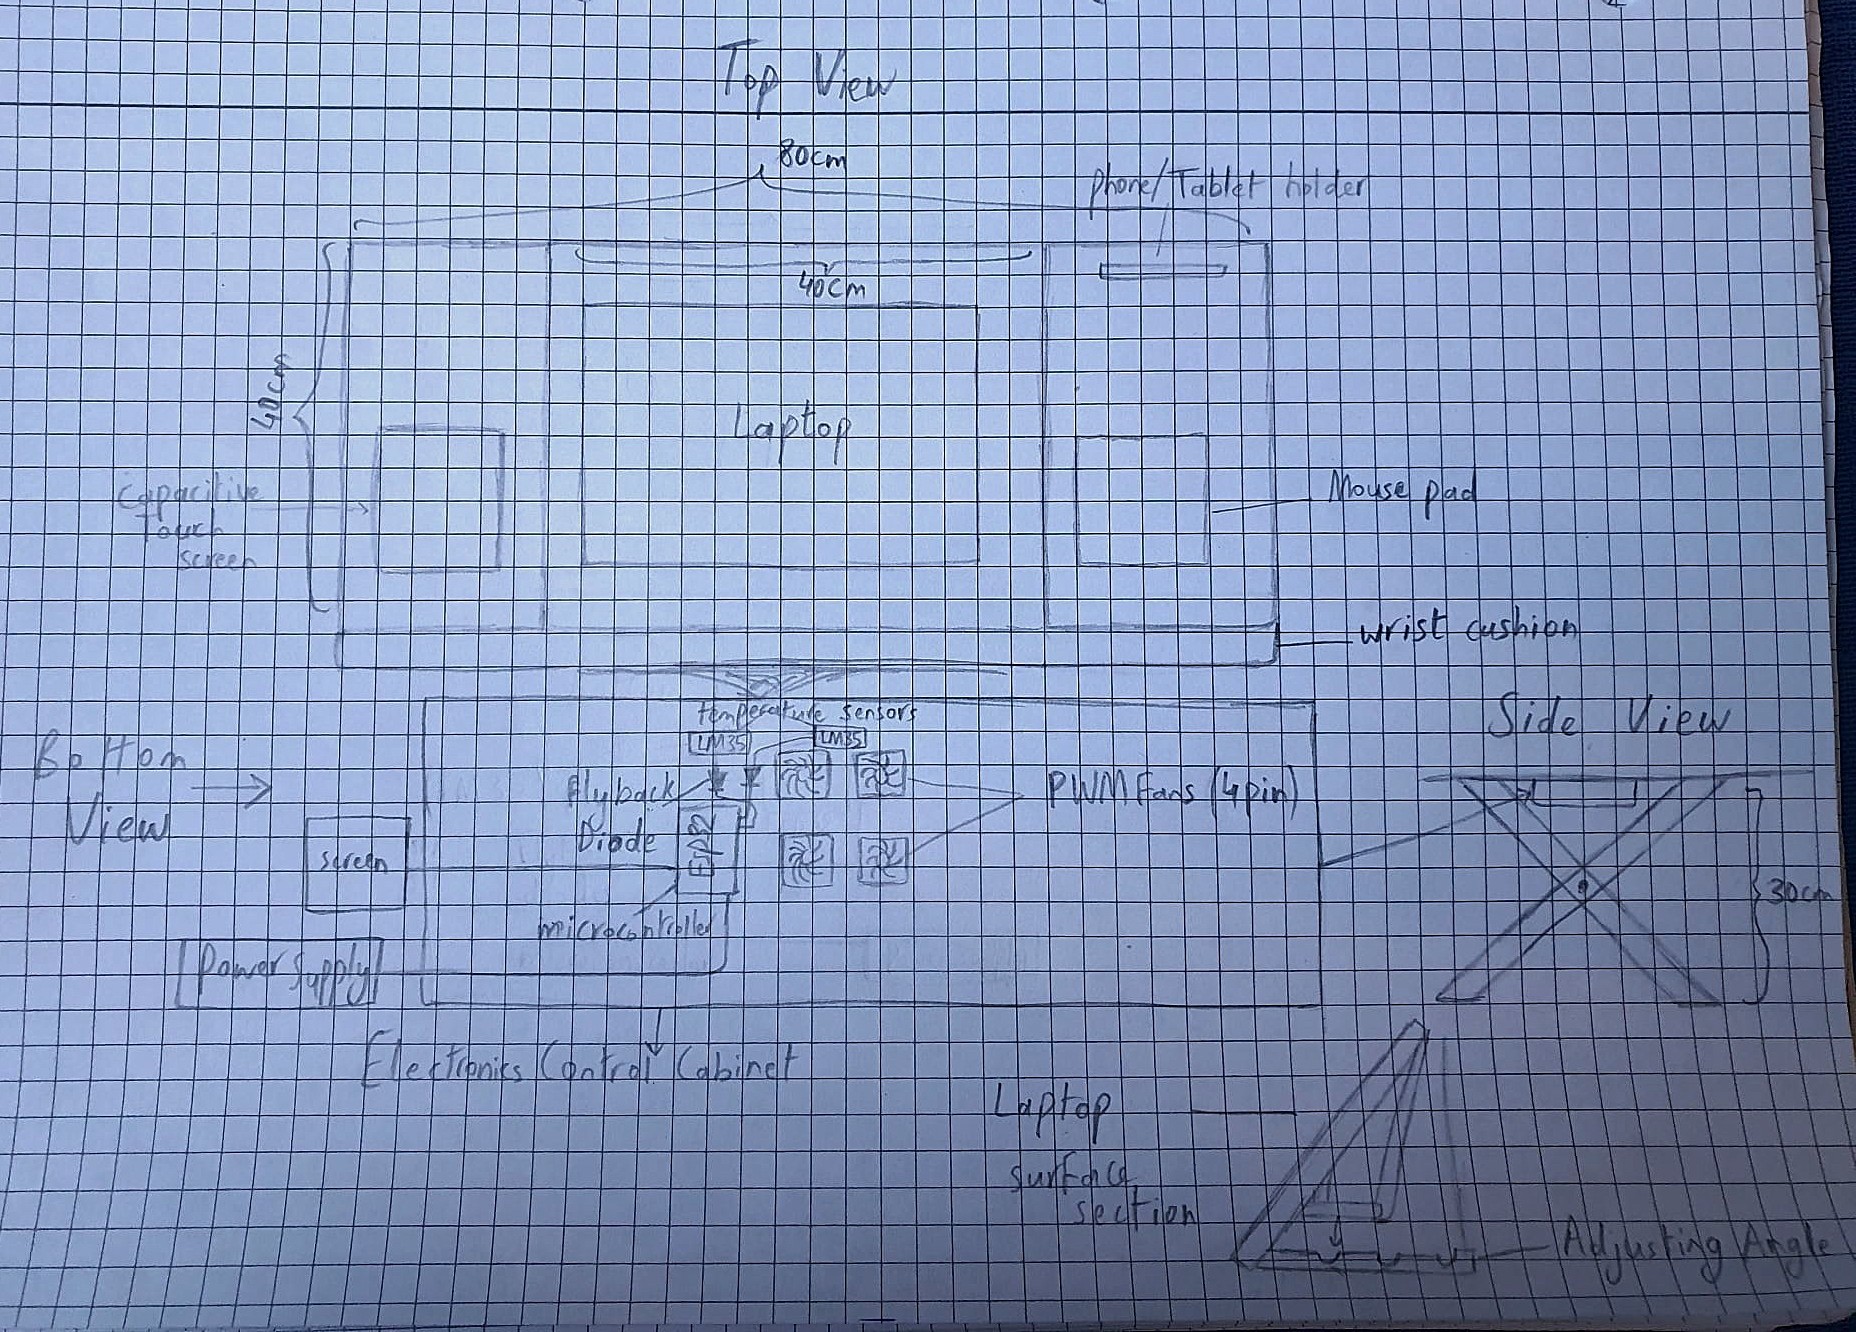
Initial Project Idea - Week 1
Rough Sketch for Project Idea
Initial Research
Research on Hardware possibility - Week 3
A good source to acquire datasheets from: alldatasheet
1. Temperature Monitoring and Control: Create firmware using the Arduino IDE that utilizes an ADC channel to read the LM35
sensor.
Since the ESP32 has a 12-bit ADC (4096 levels) and typically operates
with Vref =
3.3V, the raw ADC reading needs to be converted to a meaningful temperature value.
However, due to the ESP32's non-linear ADC response, the LM35 sensor
may require a
voltage offset correction. A diode-based offset circuit (e.g., two
diodes in series)
is recommended to shift the sensor output voltage into a more linear ADC range.
Corrected Temperature Formula:
Temperature (°C) = ((ADC_Value * Vref) / ADC_Max - V_offset) * 100
Where:
- Vref = 3.3V (ESP32 reference voltage)
- ADC_Max = 4095 (12-bit ADC resolution)
- V_offset ≈ 1.4V (using two diodes in series, if required for correction)
source:
LM35 Sensor Interfacing with ESP32 - Electronic WingsSet a threshold temperature (resource: Normal CPU Temperature); if the measured temperature exceeds this threshold, adjust the PWM duty cycle to increase fan speed automatically and display notification on the display.
Create PWM signals for every fan using the ESP32's PWM capabilities.
To optimize cooling, map the temperature data to a PWM duty cycle. For instance, if the temperature is extremely high, set the duty cycle close to 100%.
Potential Hardware Components
Research on PCB Production - Week 6
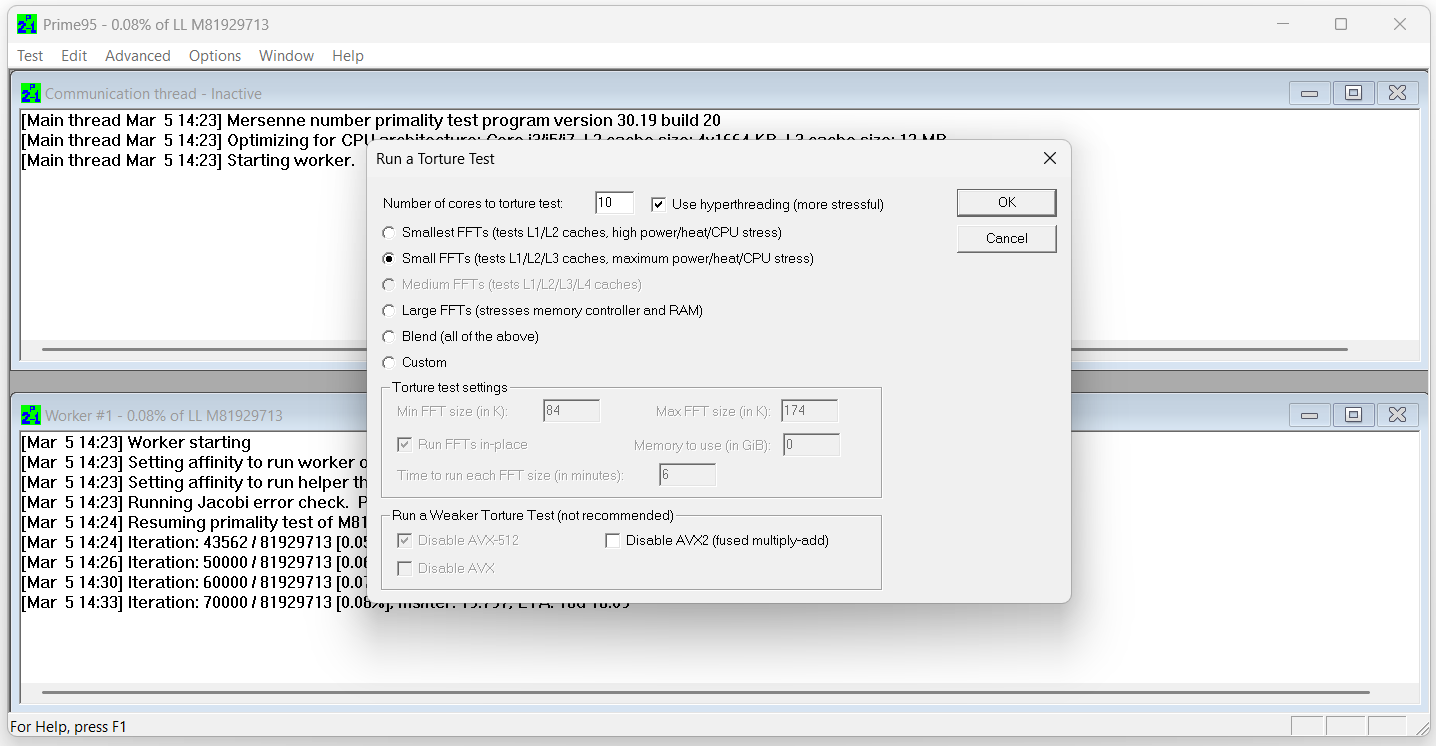
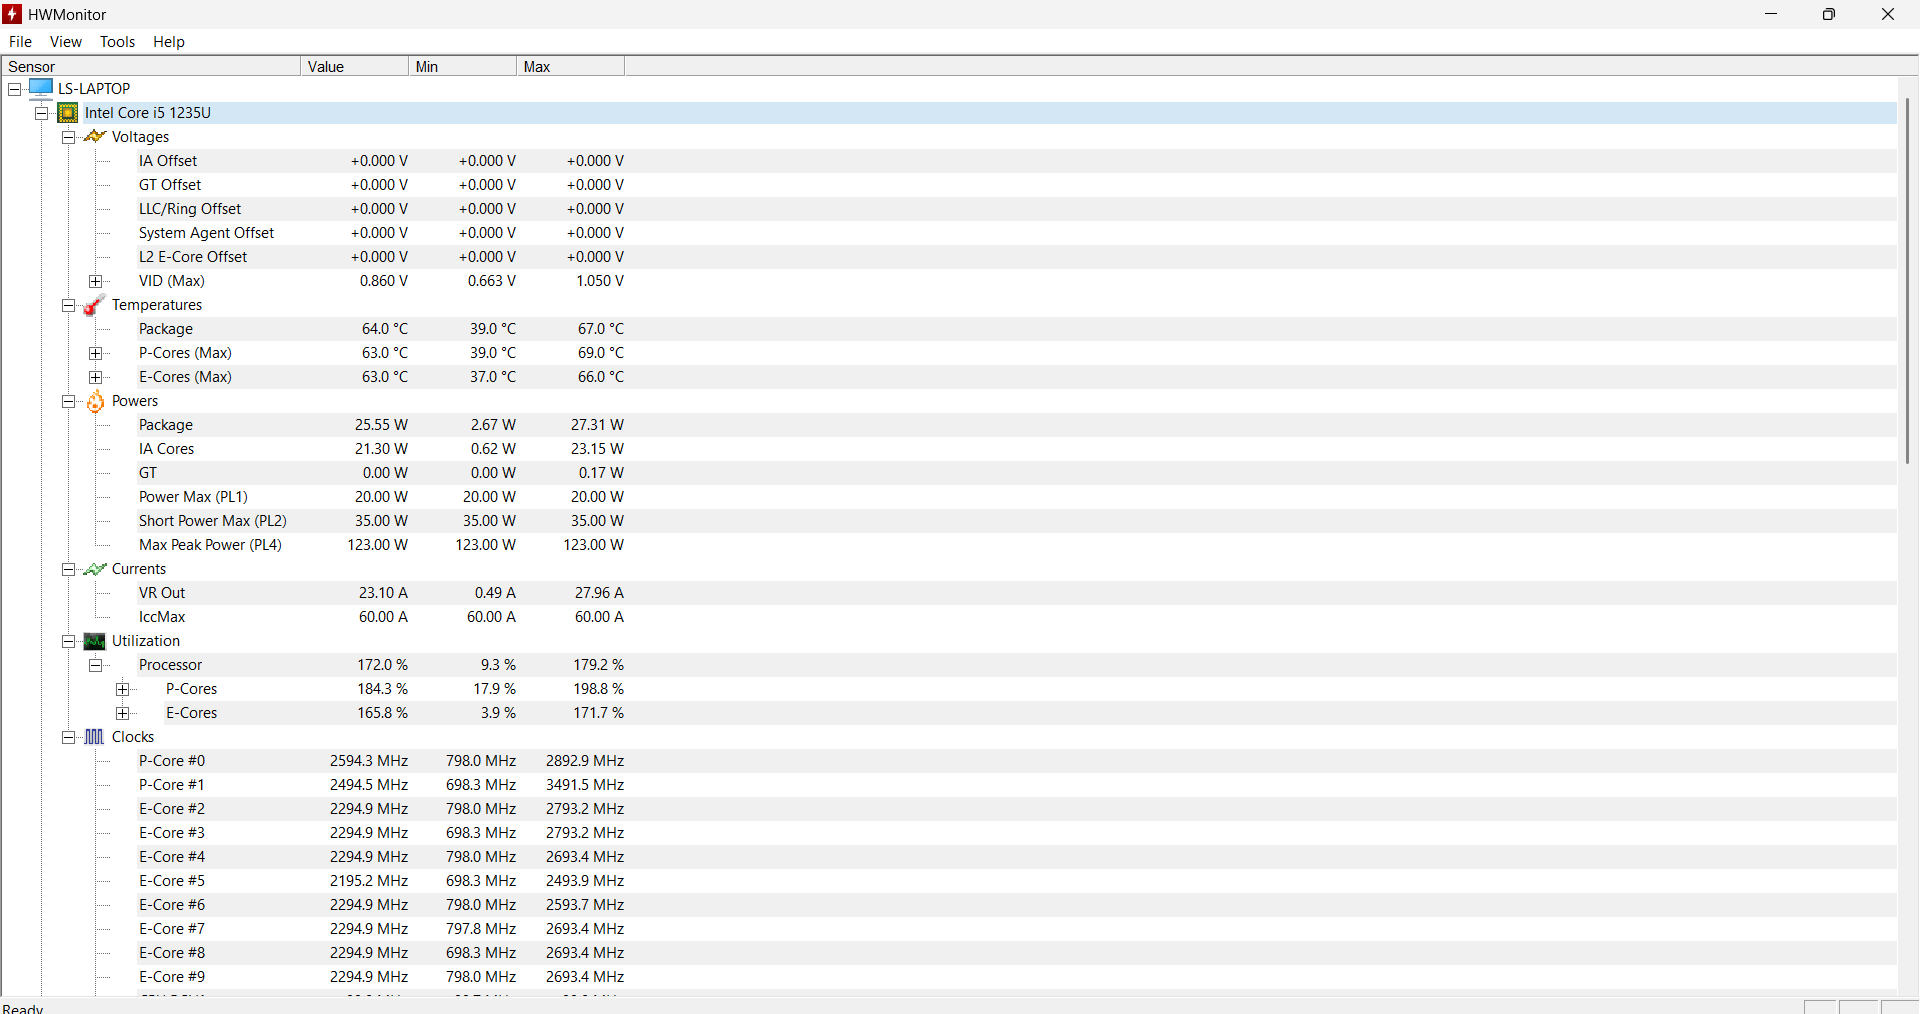
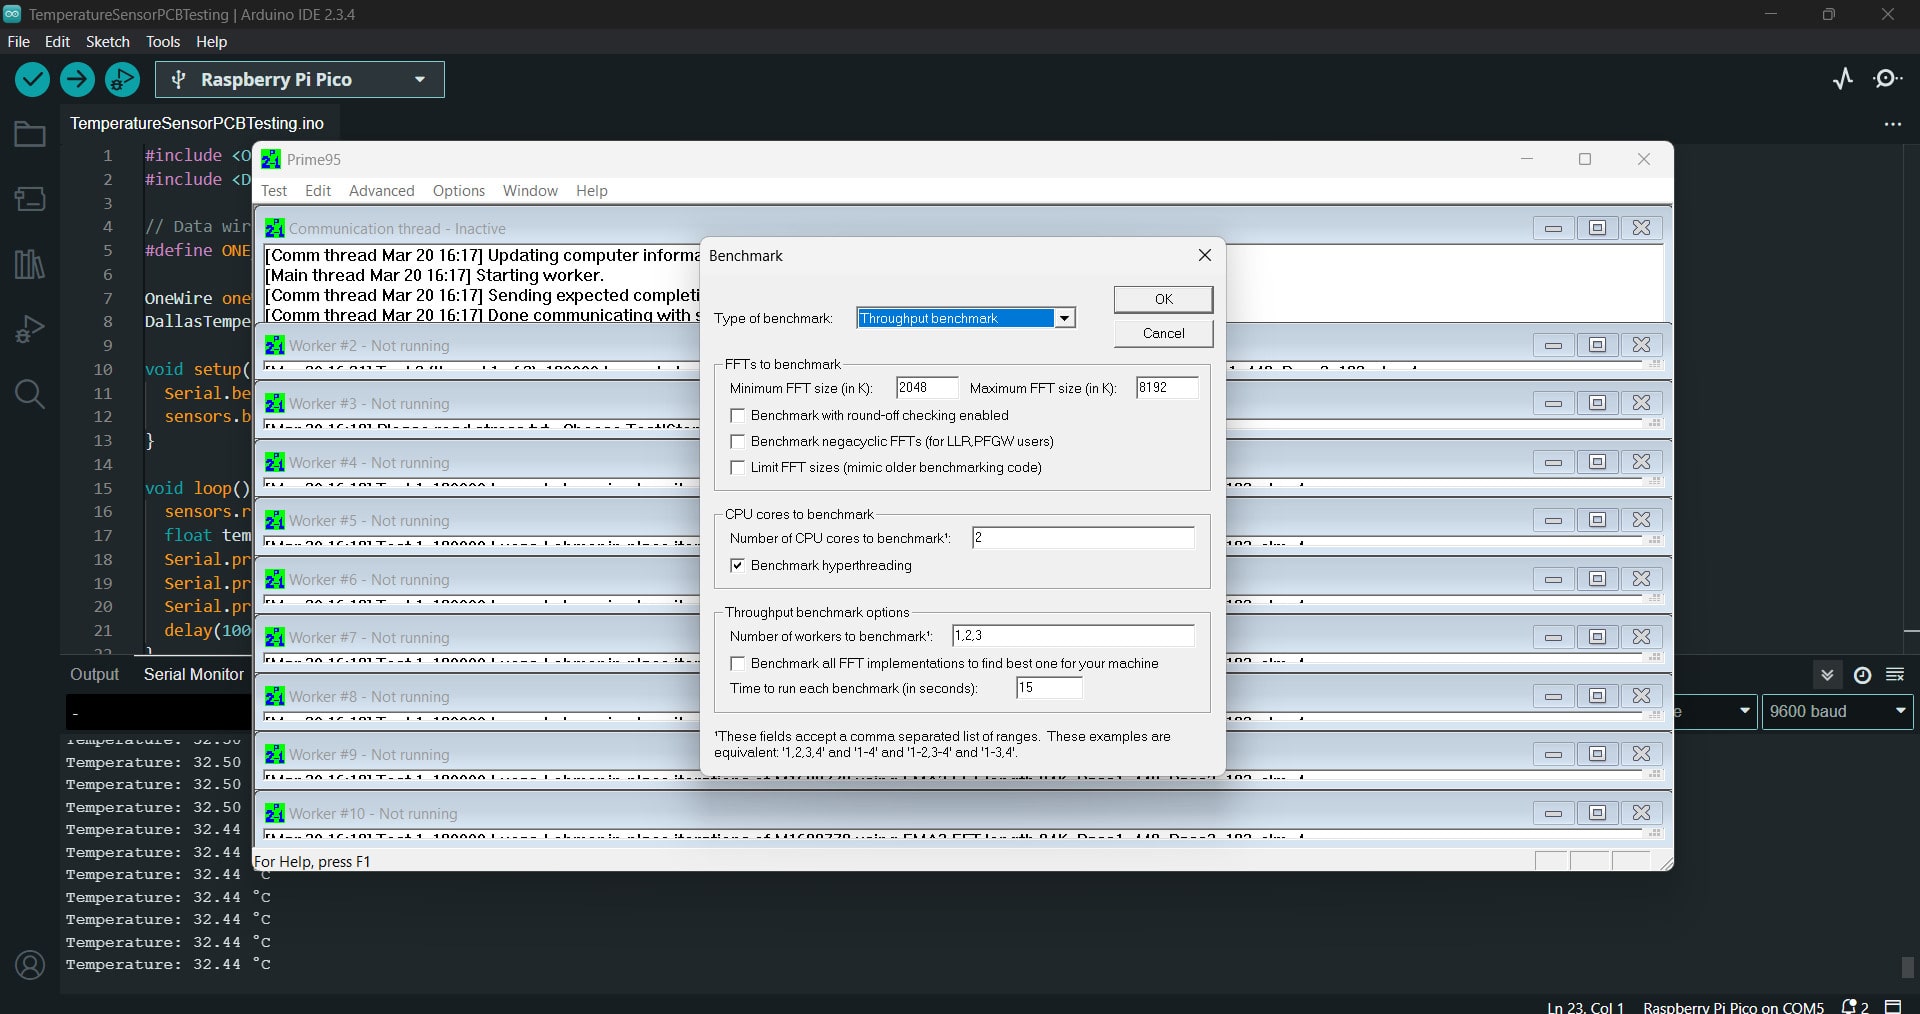
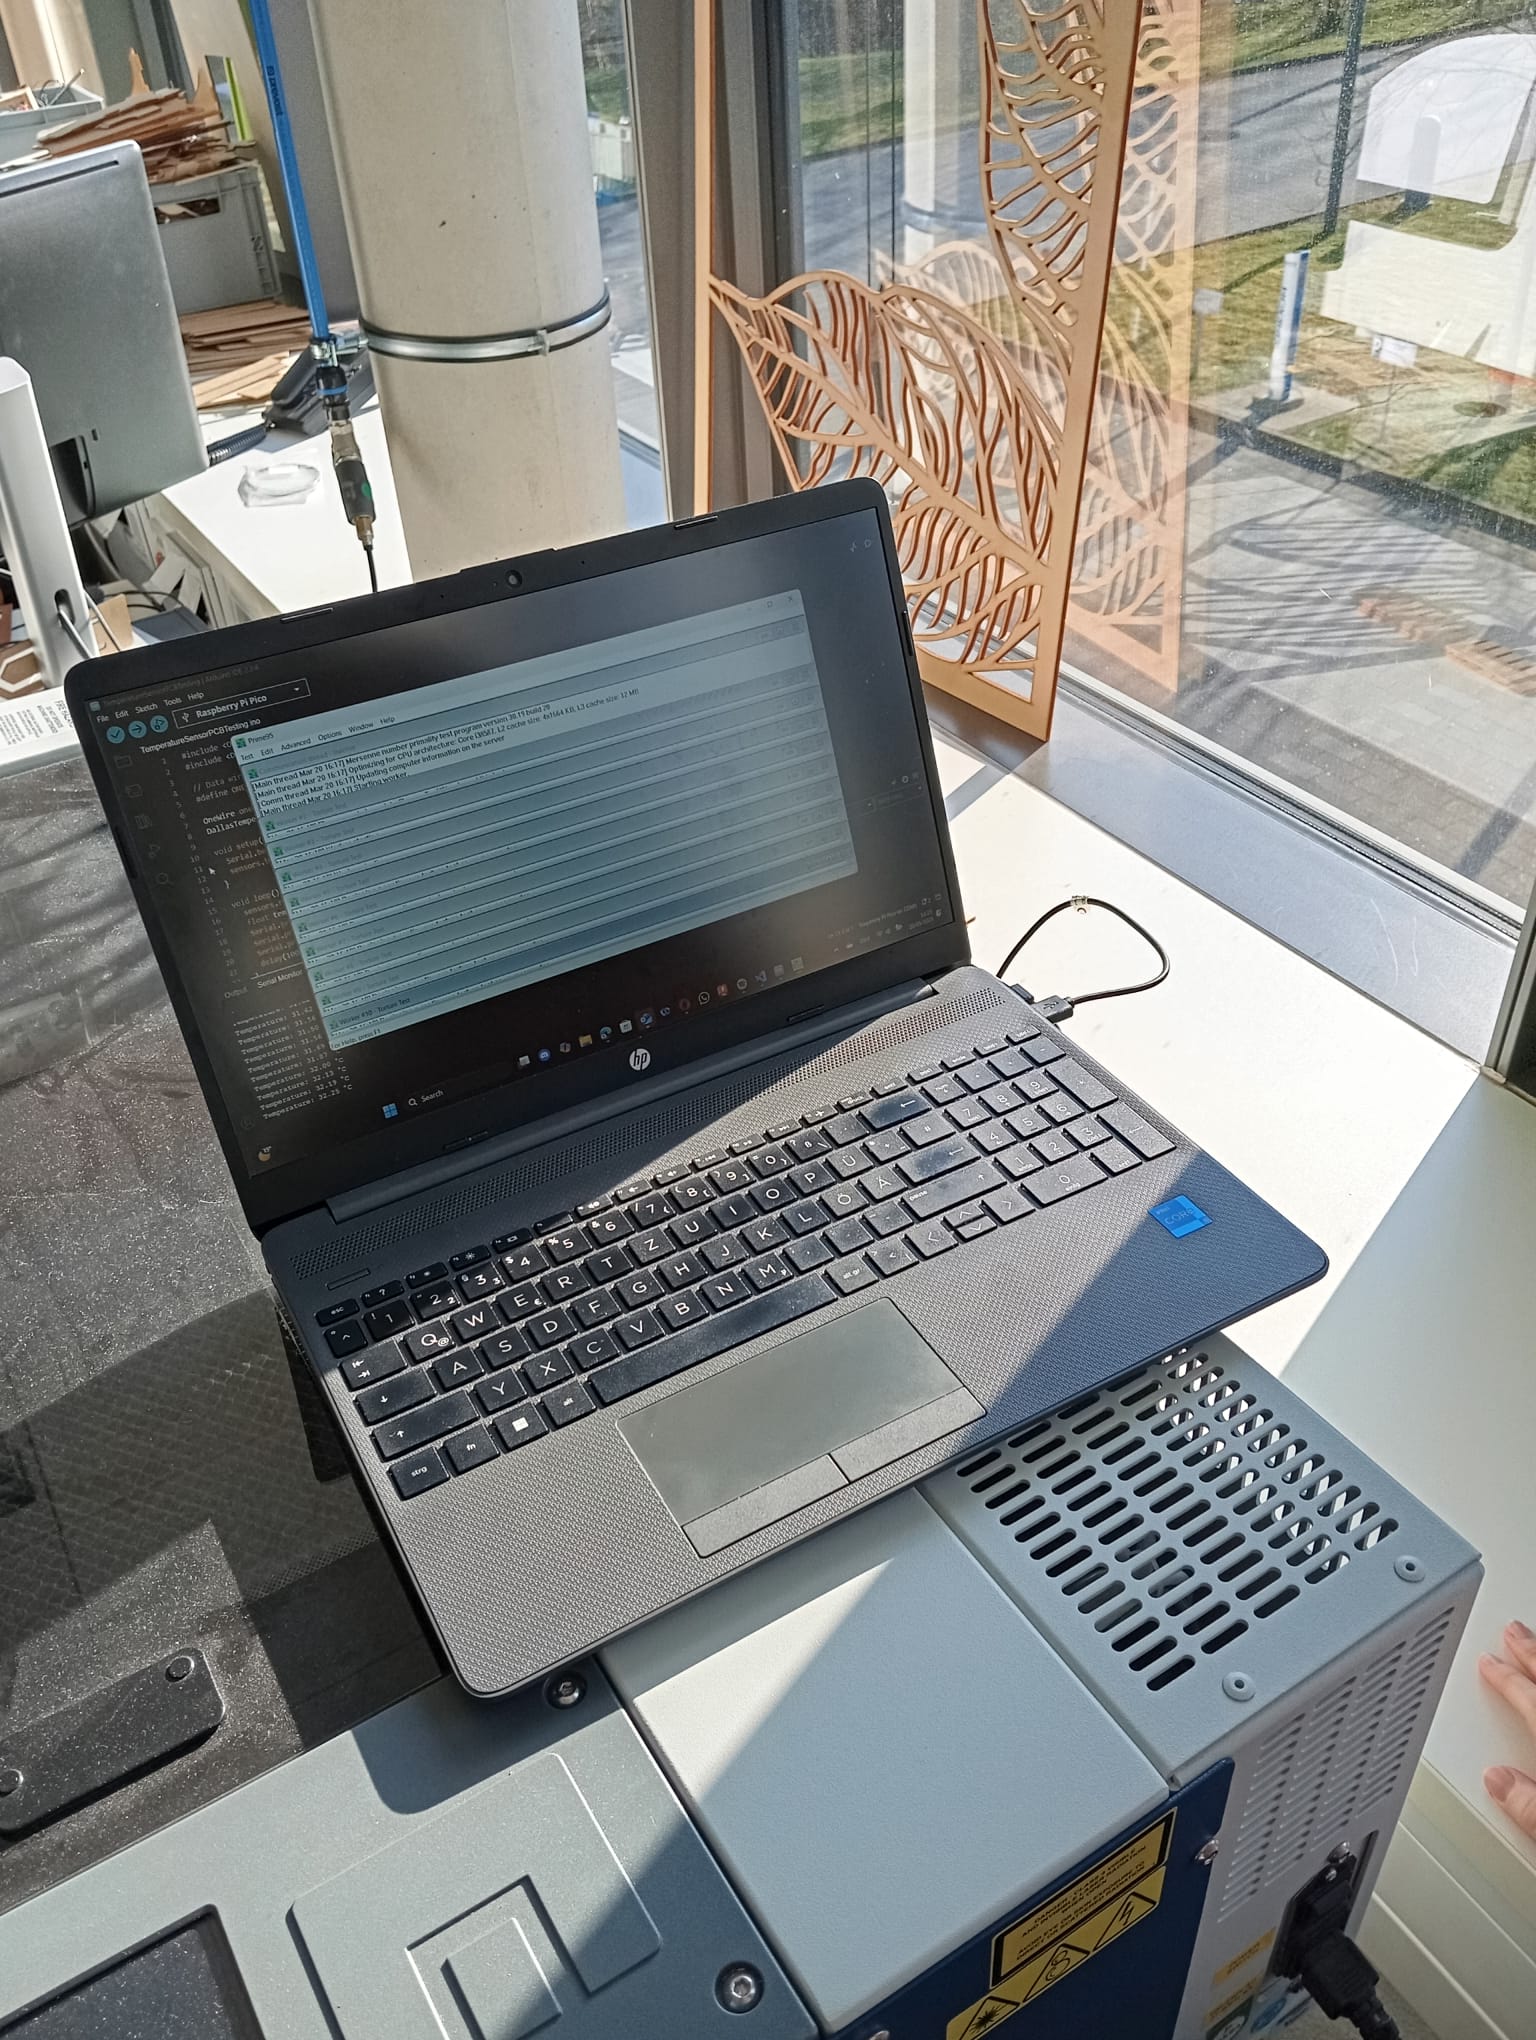
Stress Test Laptop's CPU
Exploring Unified Power Supply with Voltage Regulation
- 12V → Required for the fans.
- 5V → Used for ESP32 or Raspberry Pi Pico microcontrollers.
- 3.3V → Needed for sensors, and the display.
How a Voltage Regulator Works
- Linear Voltage Regulators (e.g., LM317, 7805, 1117-3.3V): simple mechanism where they use a transistor controlled by a negative-feedback circuit to produce a specified output voltage, but less efficient as they dissipate excess energy as heat.
- Switching Voltage Regulators (e.g., Buck Converters, LM2596 ): consist of a power switch, an inductor, and a diode to transfer energy from input to output. They are highly efficient since they convert energy with minimal heat loss. This is usually done by storing and releasing energy through an inductor.
Example Circuit Design
-
12V Power Input
- 12V DC Fan (Direct Connection)
- Step-Down Regulator LM2596 (Buck Converter) → 5V (Microcontroller and sensors)
- From the Pi Pico W → 3.3V (OLED display)
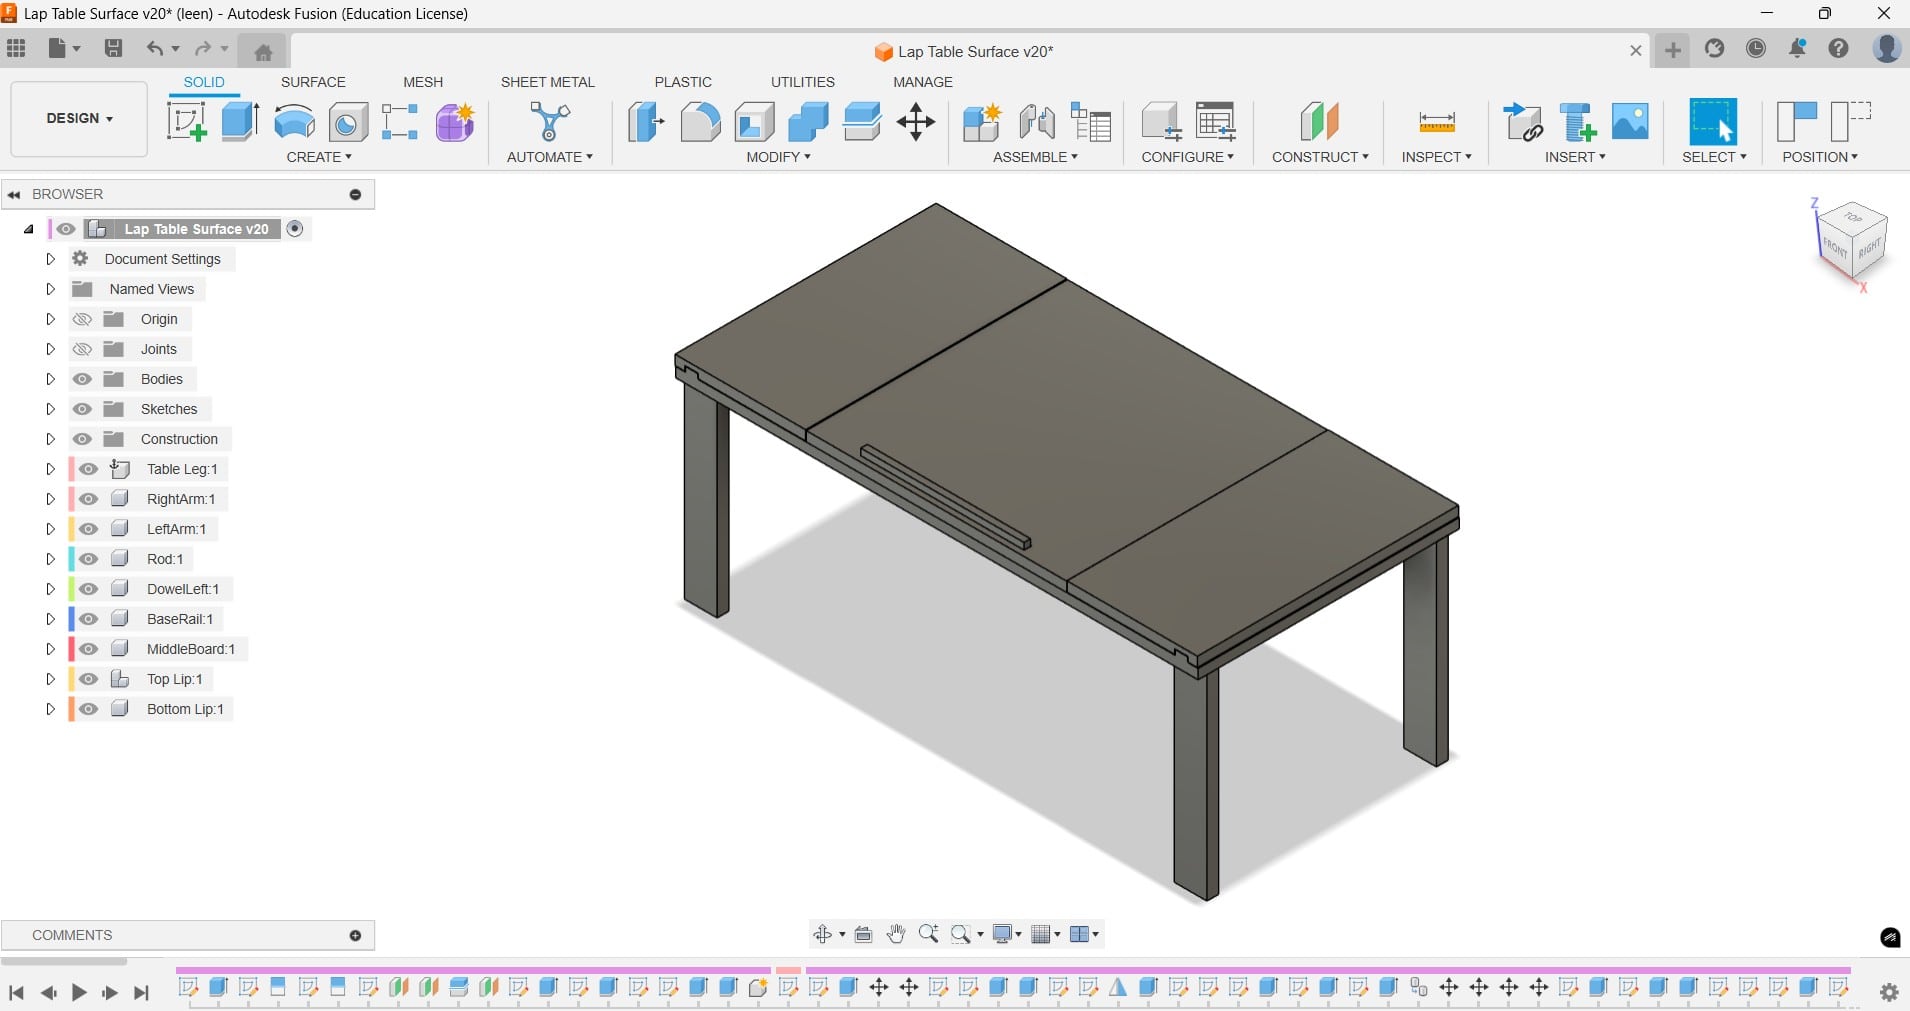
2D and 3D Modeling
Designing LapTable Prototype for CNCing - Week 7
Electronics Production - Week 8
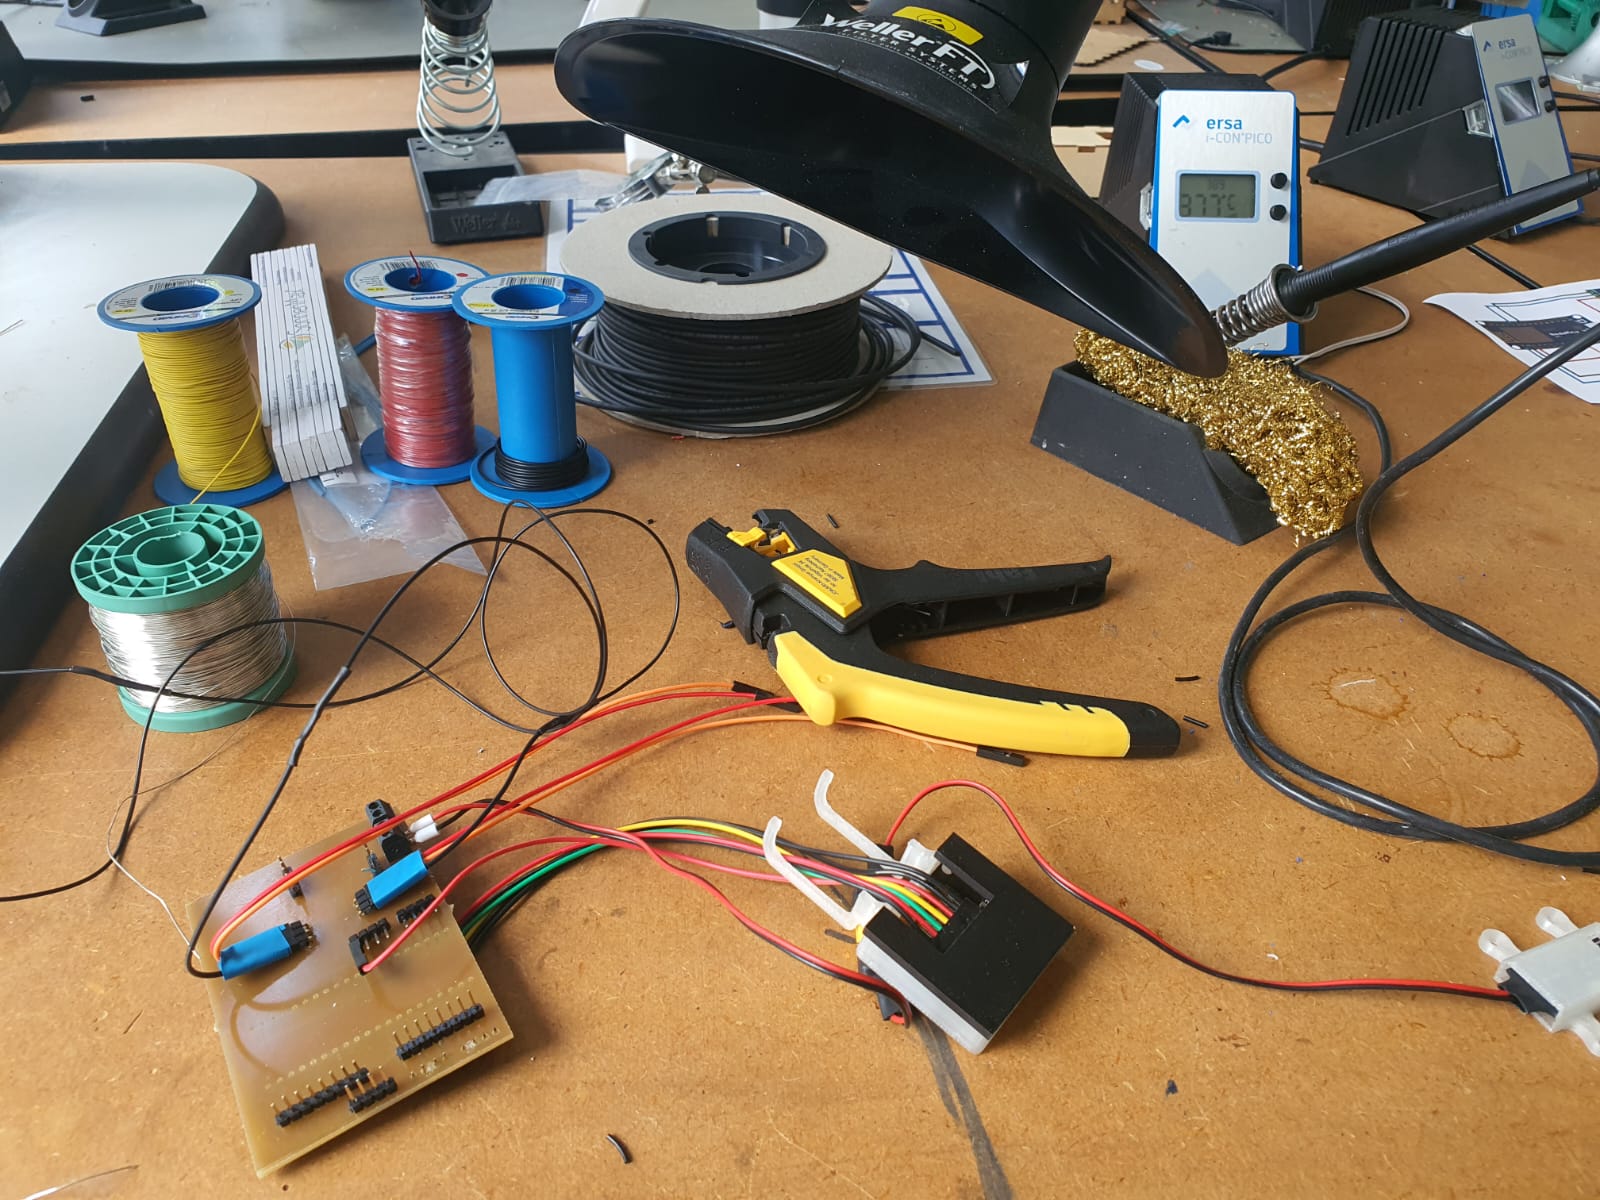
For this week, I produced the PCB that I am planning to implement in my final project. As a microcontroller I am using the Raspberry Pi Pico:. I added few extra pinheaders in case I decide later to integrate few hardware components onto my PCB. Furthermore, I soldered the capacitors that will be necessary to regulate the voltage using Linear Voltage Regulator DPAK. This will ensure providing stable power to the fan (12V), as well as the microcontroller (5V). However, I still need to procure the temperature sensors LM35 temperature sensor, the MOSFET and the diode for the PWM control of the fan. Moreover, the fan and the OLED display still have to be ordered in order to test the functionality of the circuit as a first step before adding any modifications onto it.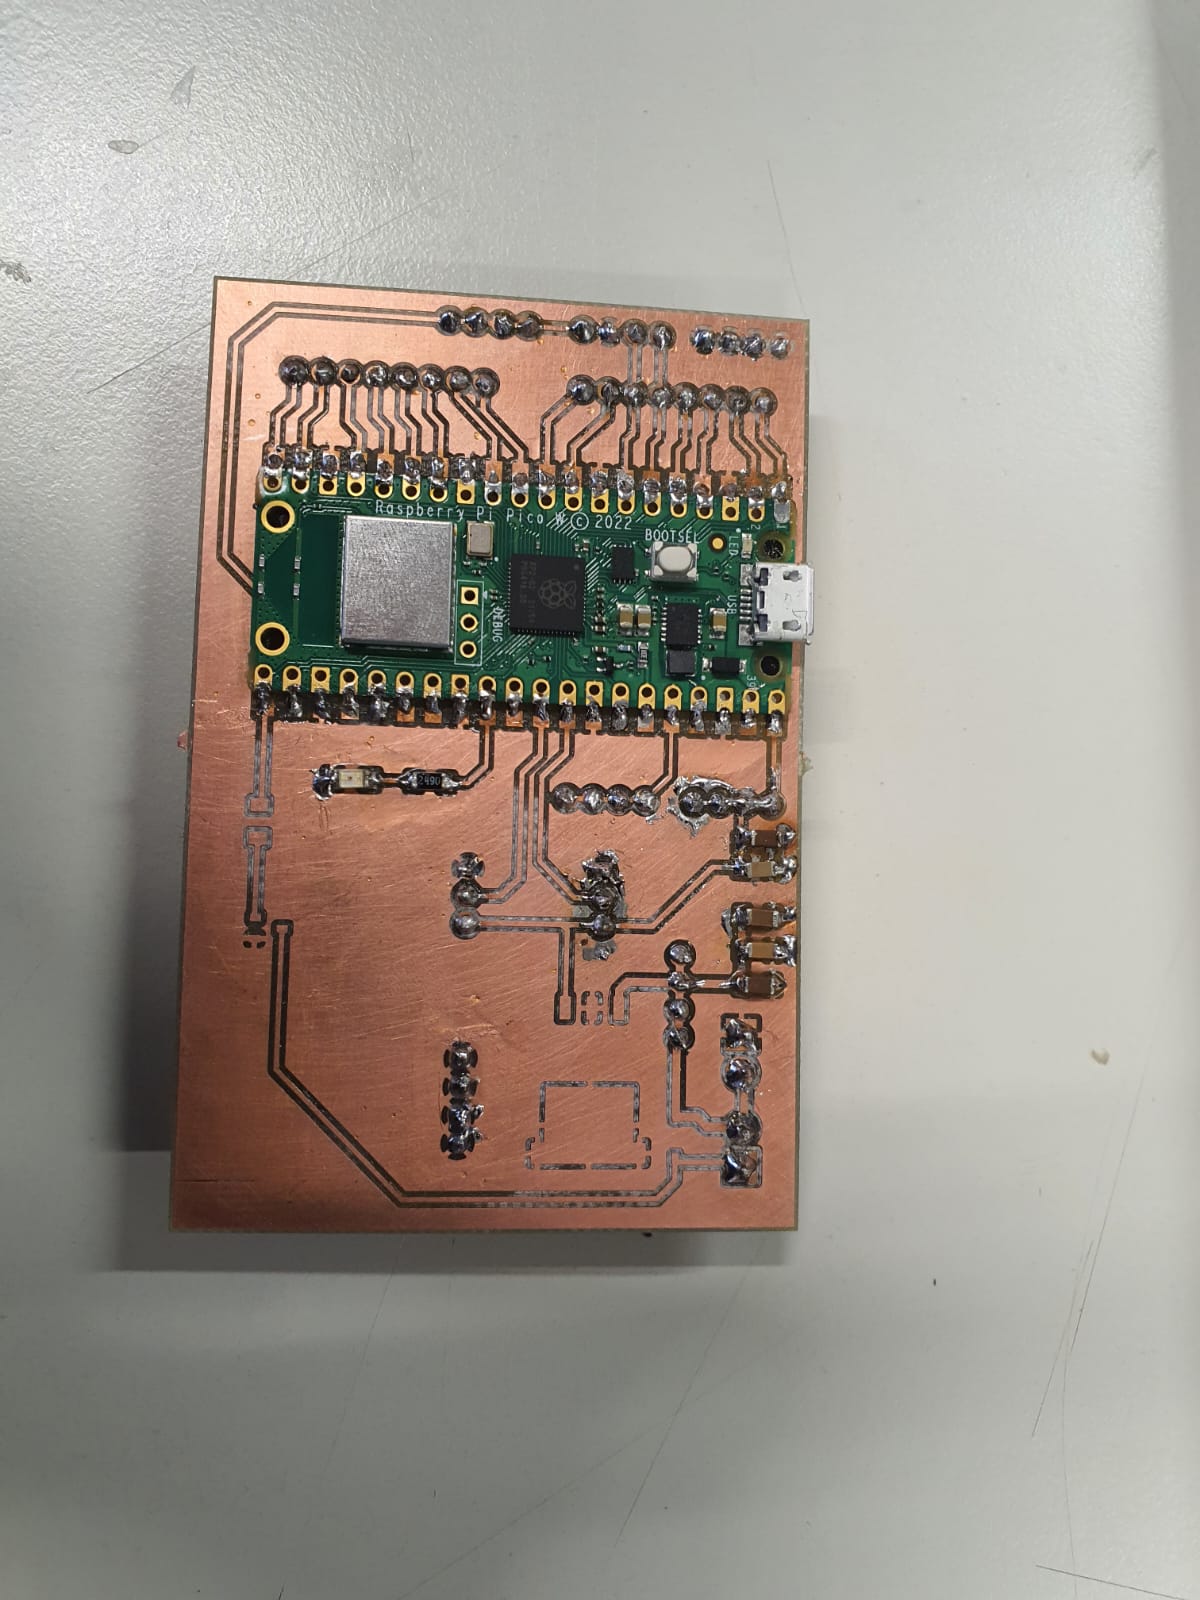
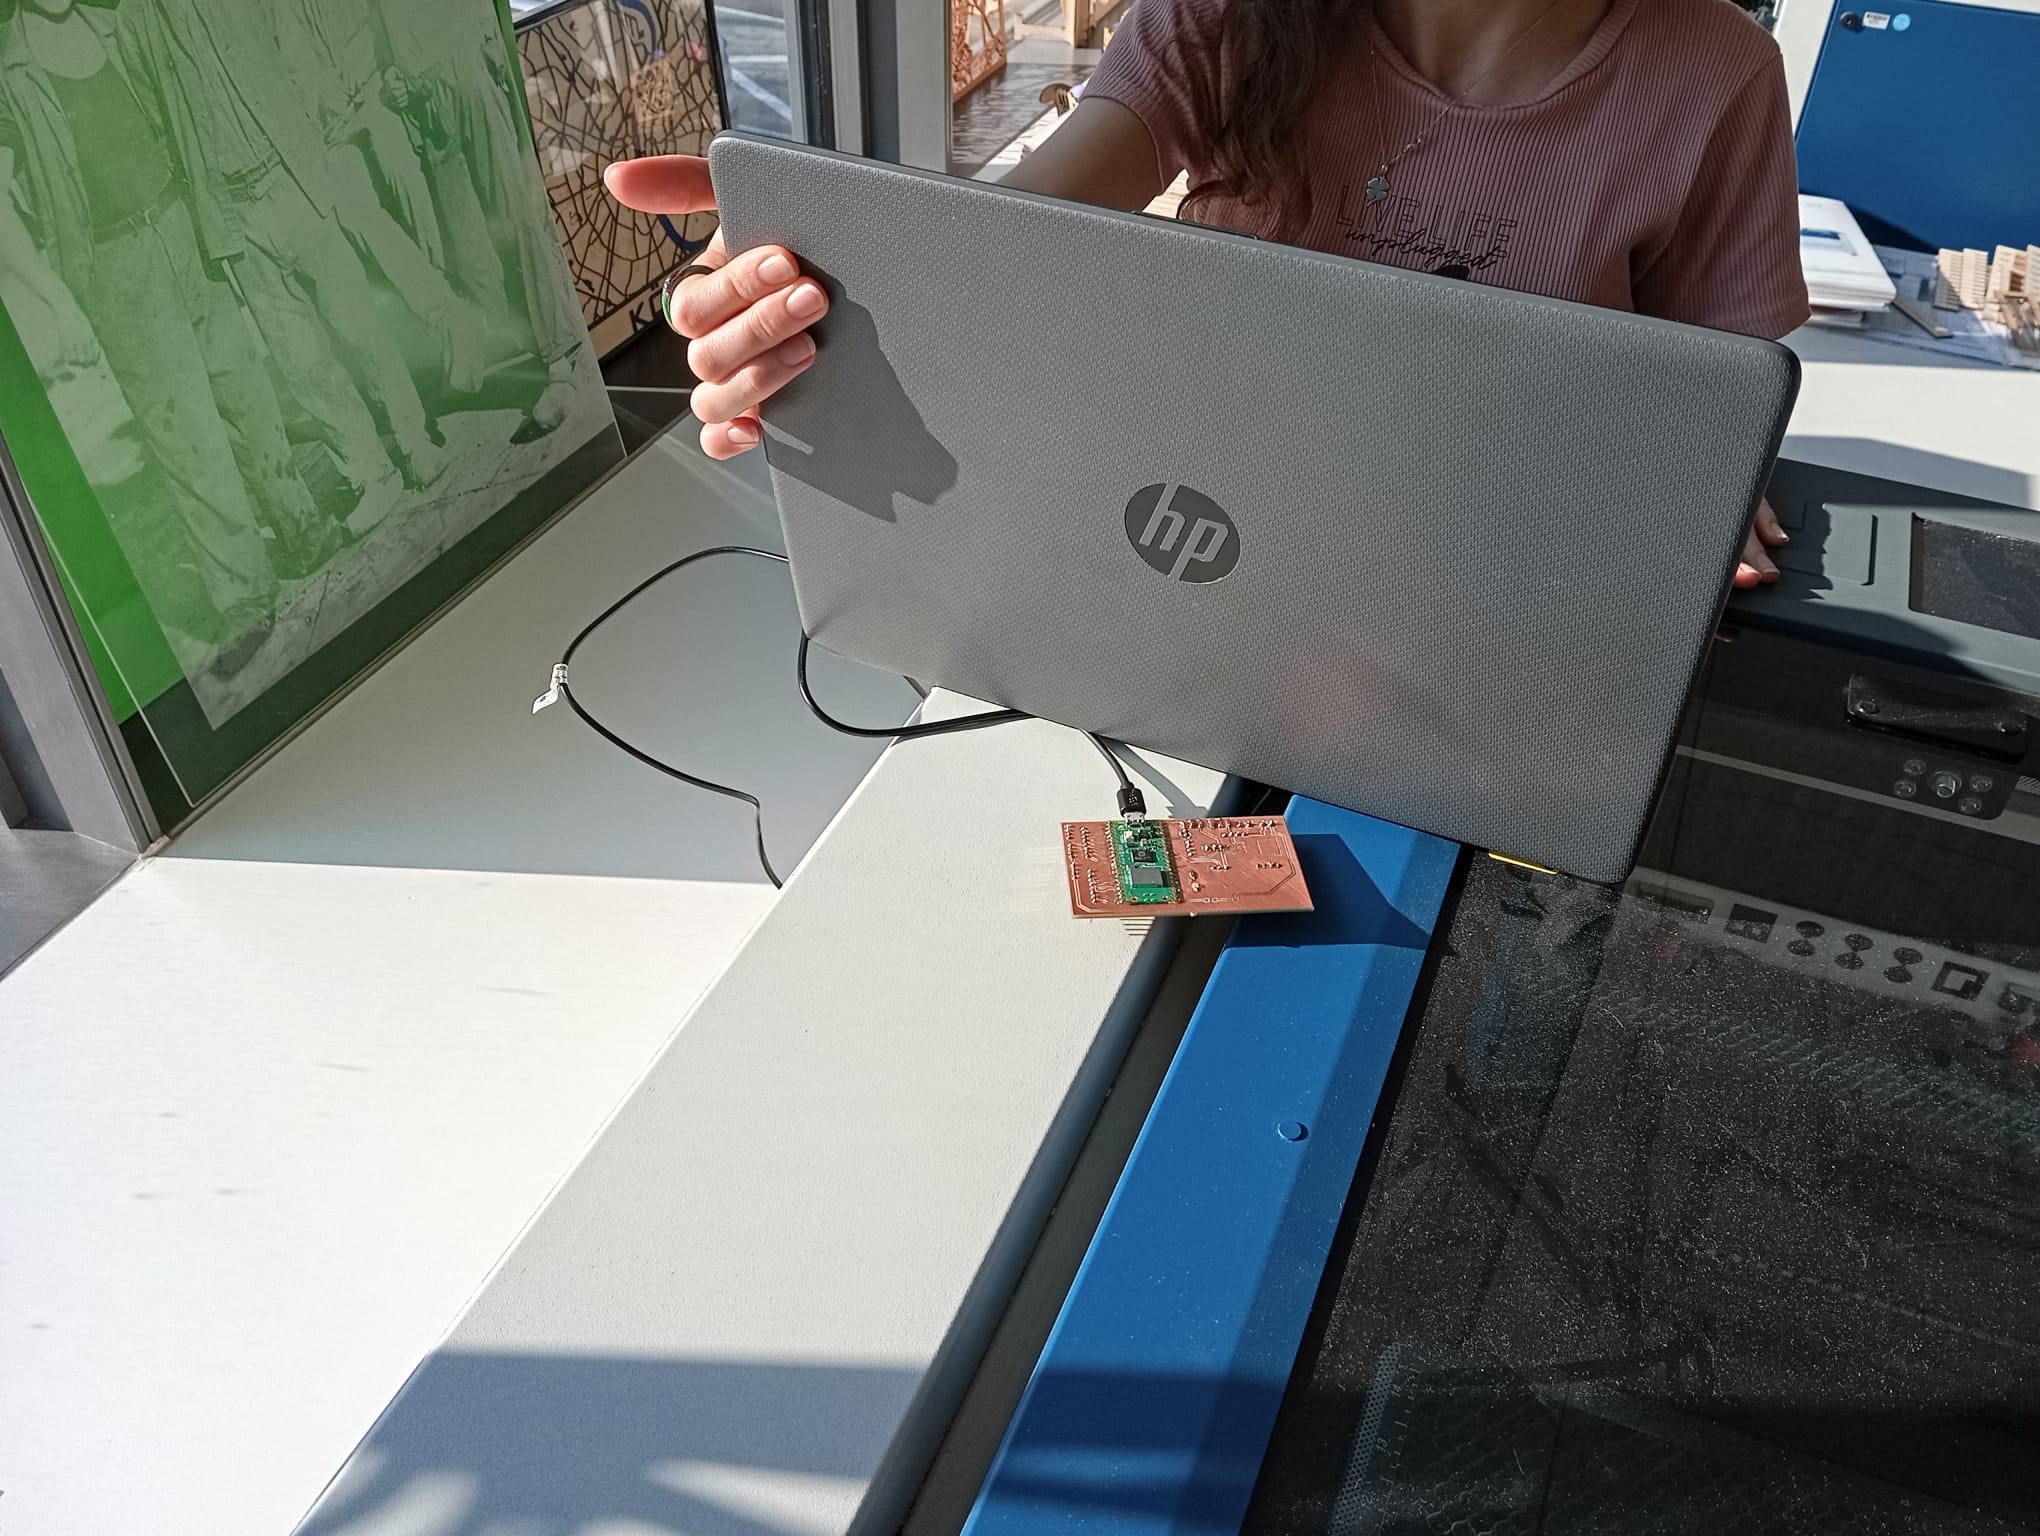
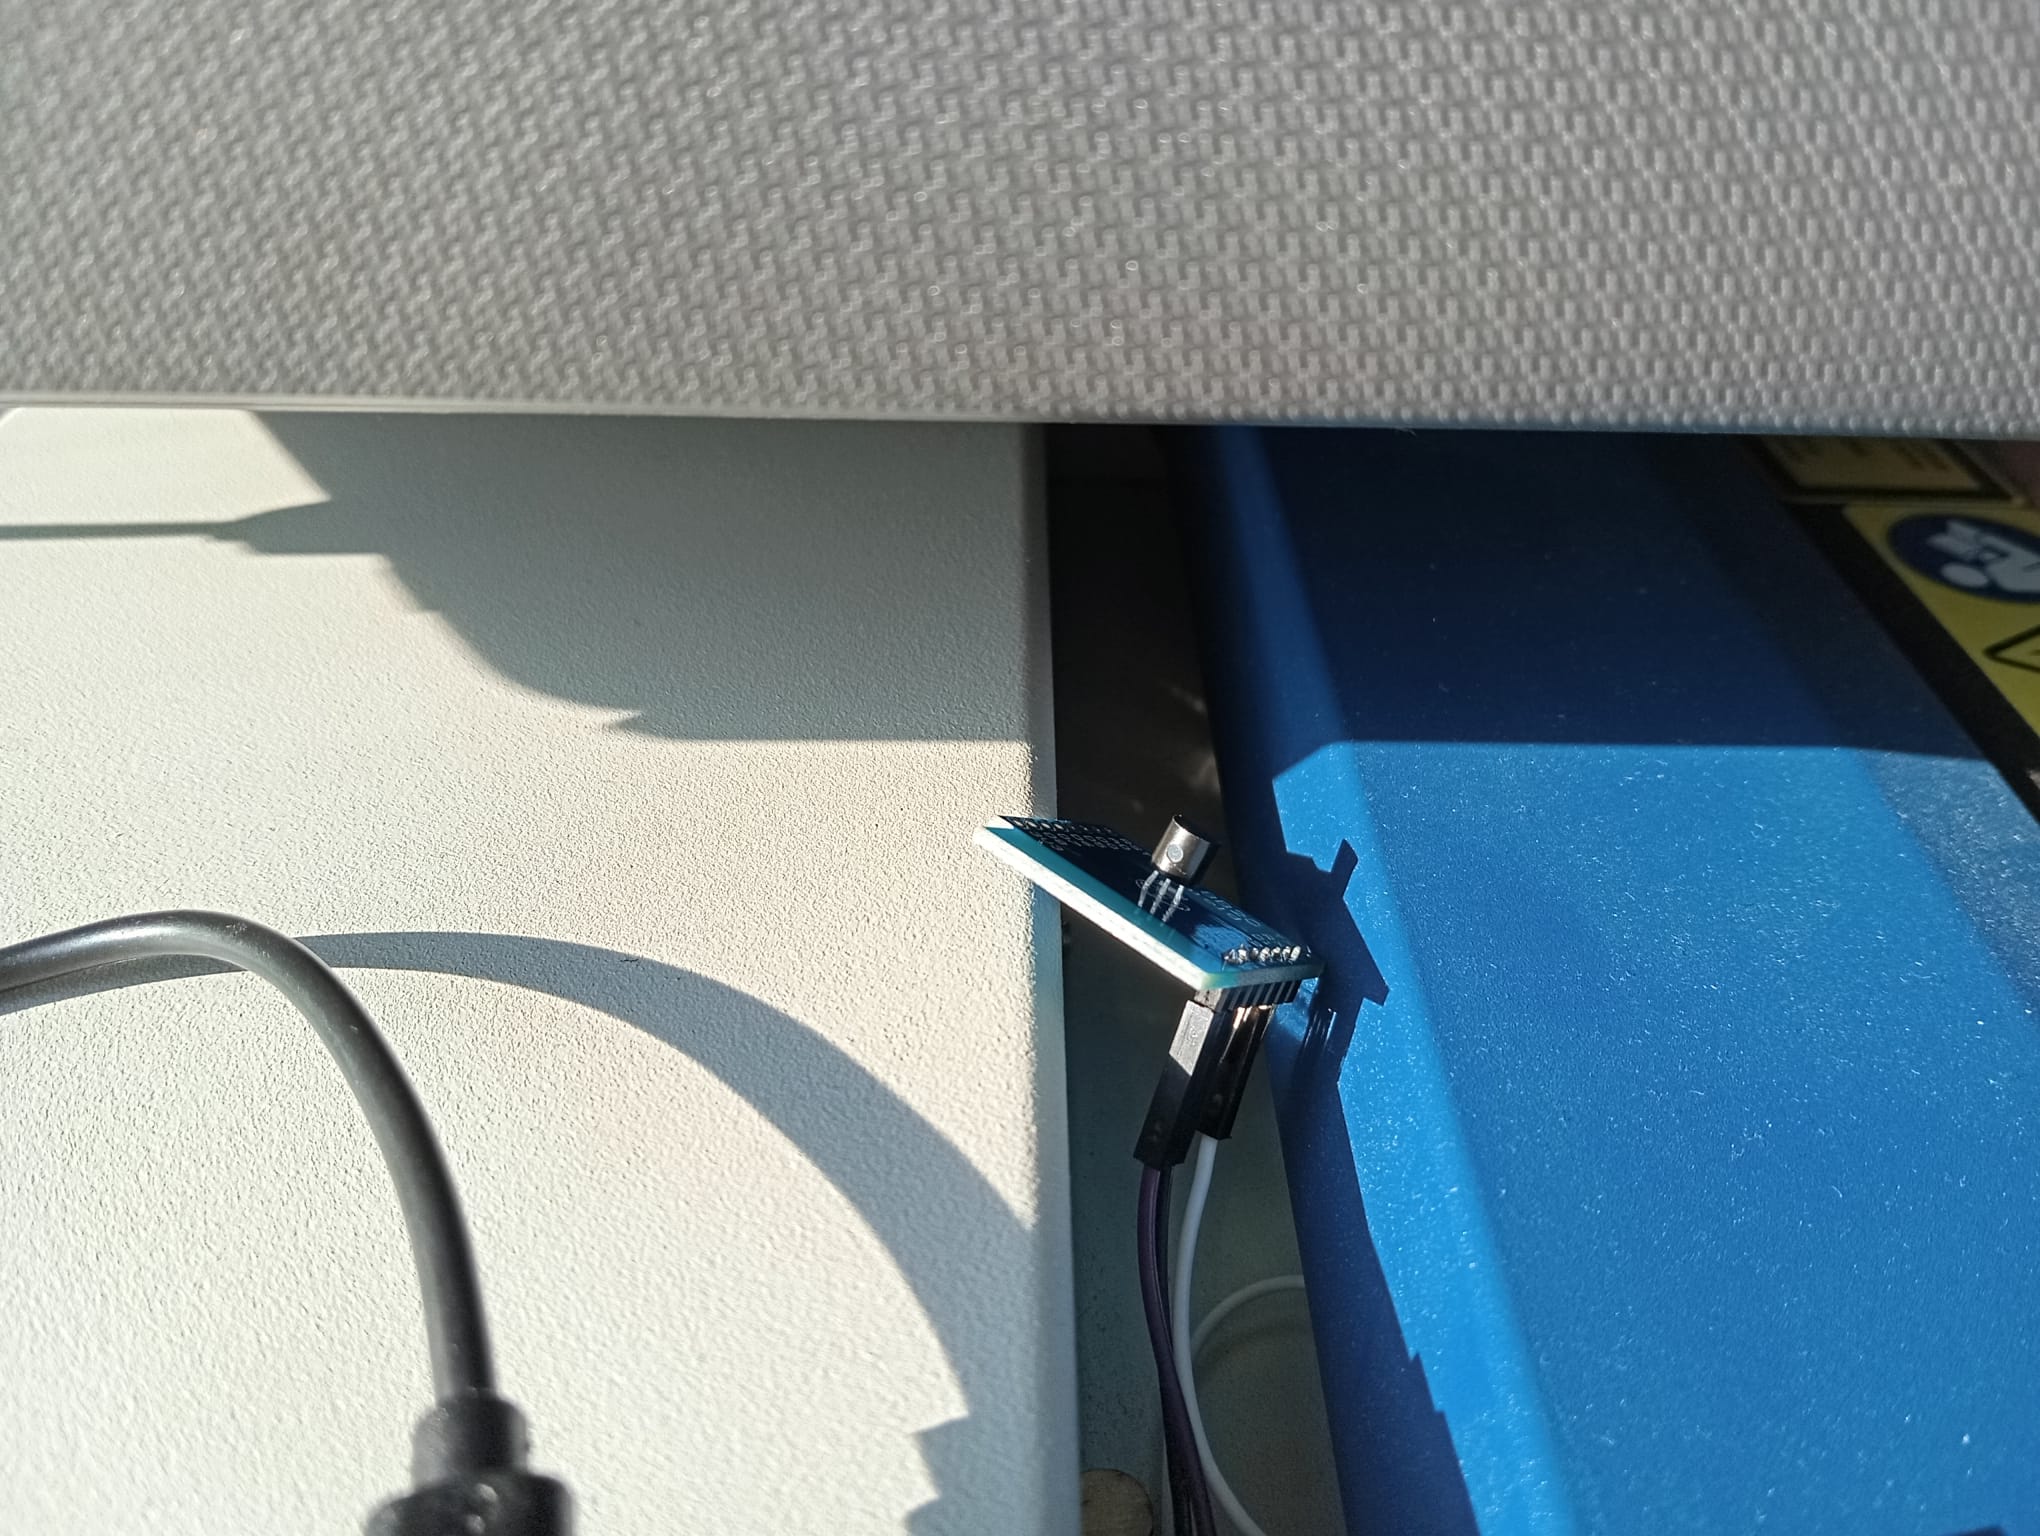
PCB Soldered and Tested - Week 9
Input Device
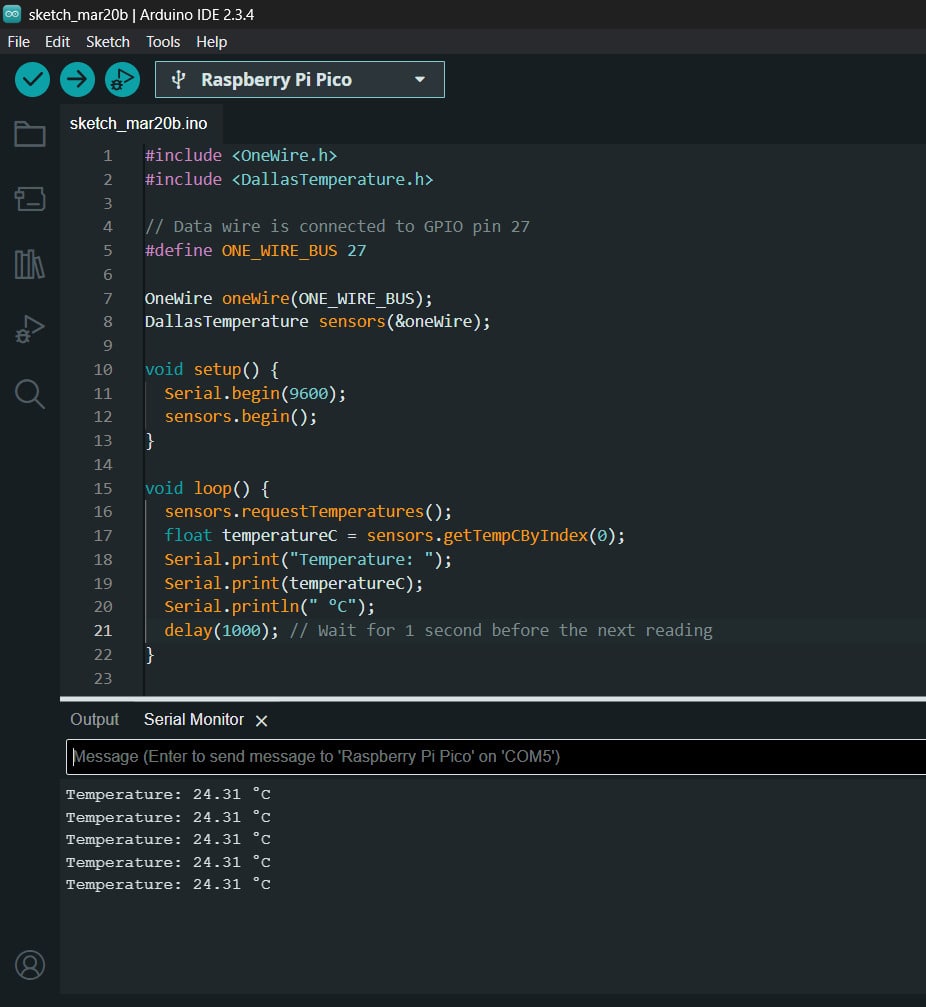
DS18B20 Sensor Test with my personal PCB
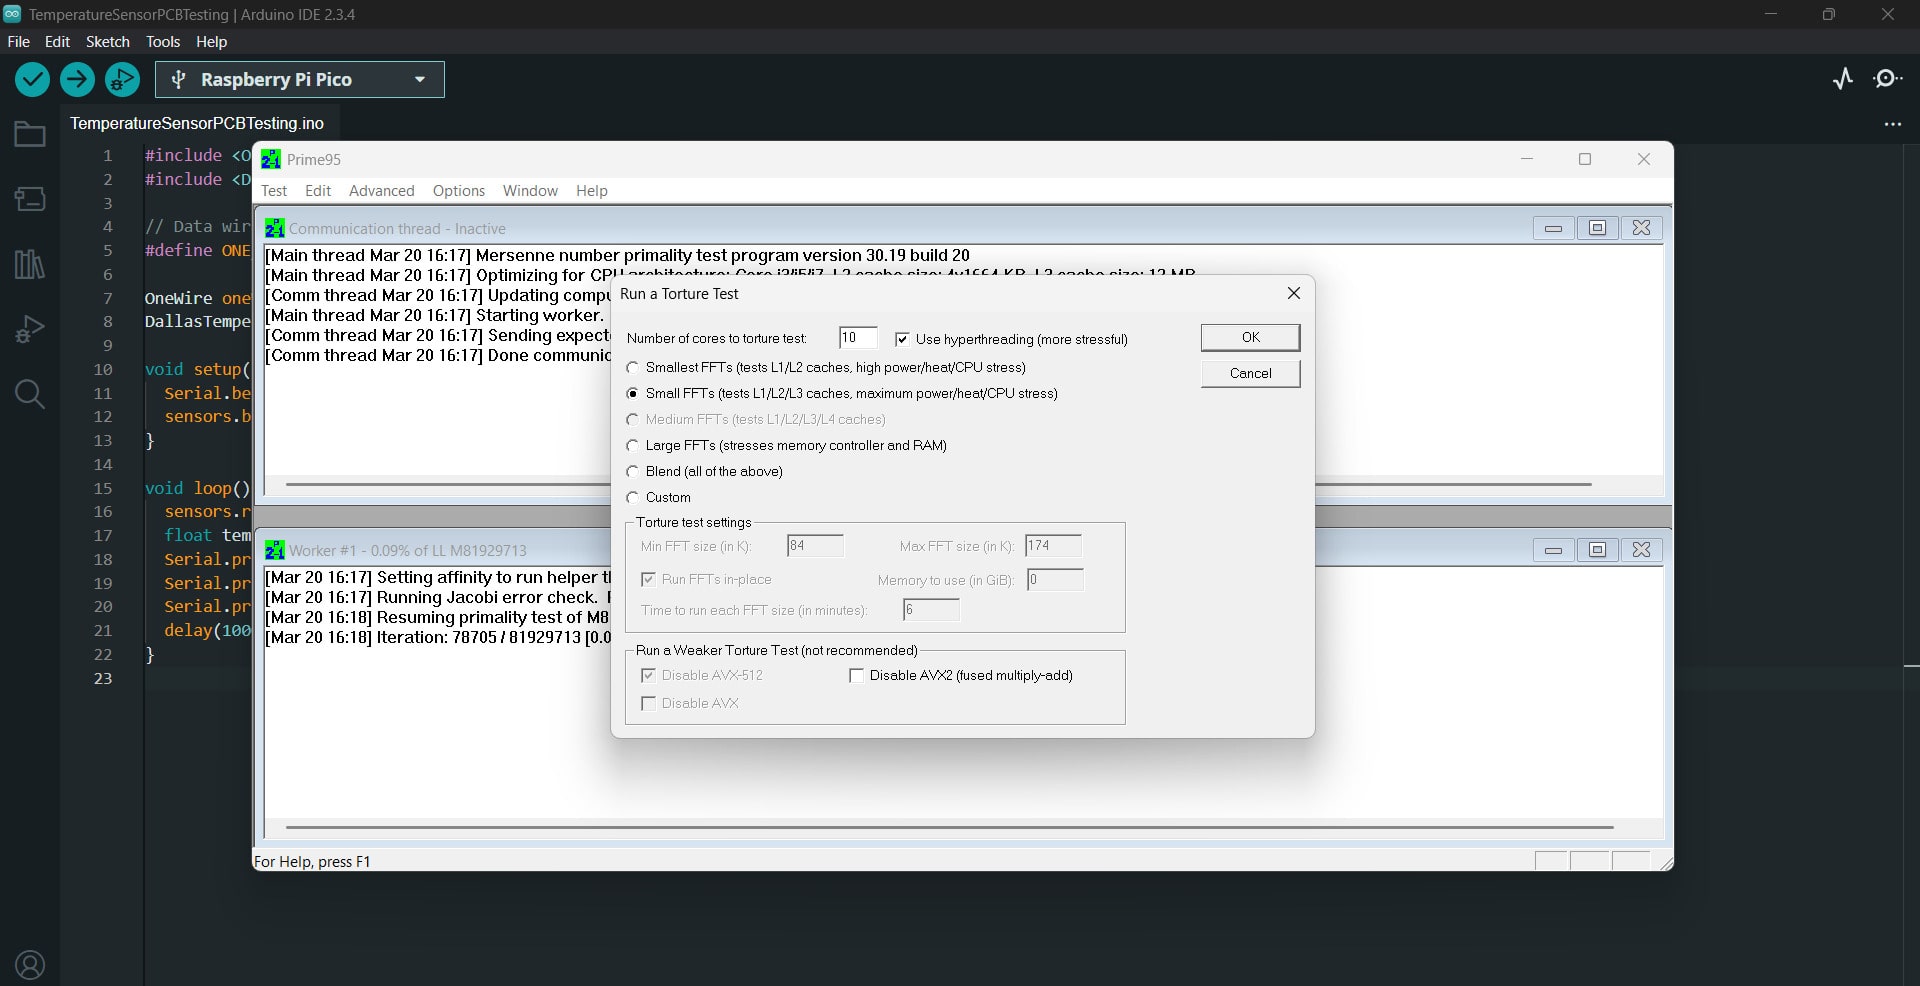
Stress and Benchmark Test
Output Device - Week 10
Testing with DC 12V fan and the Voltage Regulator
Progress on Final Arduino Code - Week 11
Testing the Fan's Threshold for PWM Duty Cycle
                                    /*
  Analog input, analog output, serial output - Modified

  Reads an analog input pin, maps the result to a range from 0 to 255 and uses
  the result to set the pulse width modulation (PWM) of an output pin.
  Also prints the results to the Serial Monitor.

  The circuit:
  - potentiometer connected to analog pin 0.
    Center pin of the potentiometer goes to the analog pin.
    side pins of the potentiometer go to +5V and ground
  - LED connected from digital pin 9 to ground through 220 ohm resistor

  created 29 Dec. 2008
  modified 9 Apr 2012
  by Tom Igoe

  This example code is in the public domain.

  https://docs.arduino.cc/built-in-examples/analog/AnalogInOutSerial/
*/

// These constants won't change. They're used to give names to the pins used:
const int analogInPin = A1;  // Analog input pin that the potentiometer is attached to
const int analogOutPin = 16;  // Analog output pin that the MOSFET is attached to

int sensorValue = 0;  // value read from the pot
int outputValue = 0;  // value output to the PWM (analog out)

void setup() {
  // initialize serial communications at 9600 bps:
  Serial.begin(9600);
}

void loop() {
  // read the analog in value:
  sensorValue = analogRead(analogInPin);
  // map it to the range of the analog out:
 // outputValue = map(sensorValue, 0, 1023, 0, 255);
  outputValue =230; // to test the Fan's threshold for PWM

  // change the analog out value:
  analogWrite(analogOutPin, outputValue);

  // print the results to the Serial Monitor:
  Serial.print("sensor = ");
  Serial.print(sensorValue);
  Serial.print("\t output = ");
  Serial.println(outputValue);

  // wait 2 milliseconds before the next loop for the analog-to-digital
  // converter to settle after the last reading:
  delay(2);
}
Final Code Draft Explanation
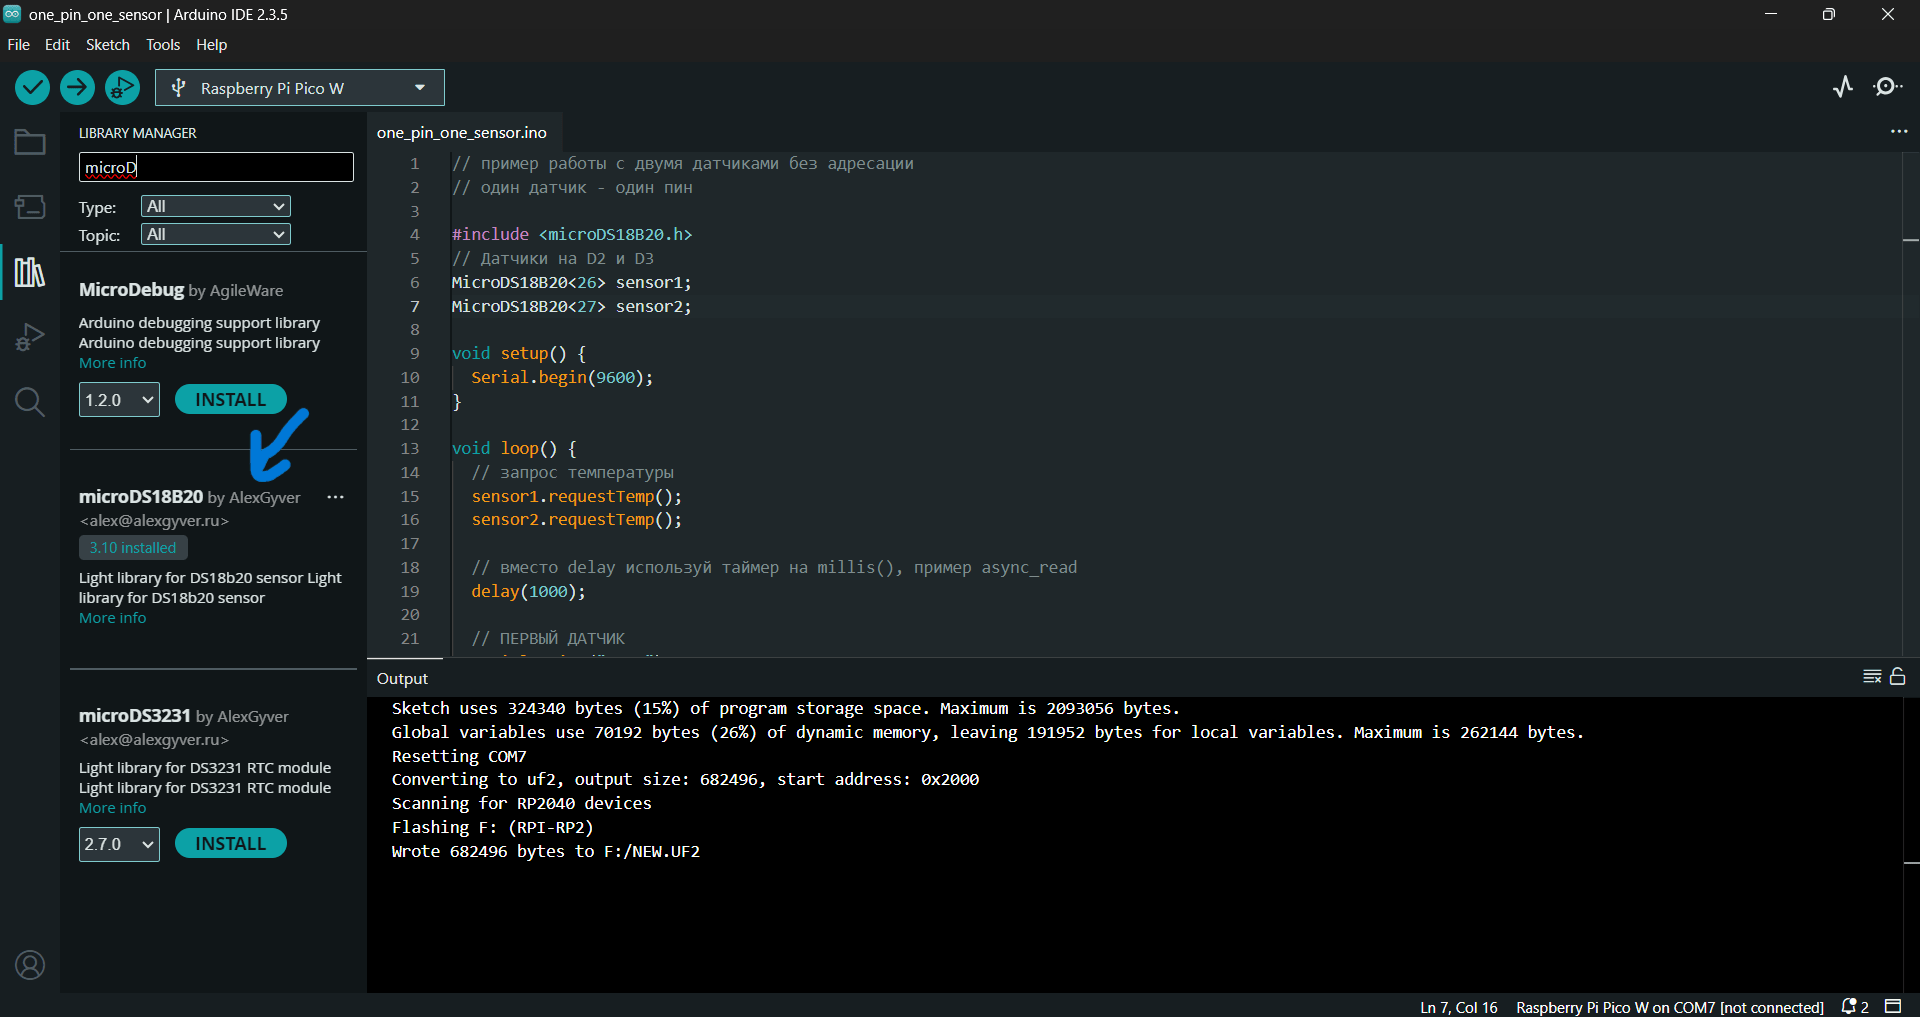
/*
The following code is a draft for my final project:
- Drive a fan based on the mean temperature recorded by two DS18B20 temperature sensors
- To control the speed of the fan, it is mapped to the PWM range of 230 to 255, where a minimum temperature threshold is set and an increment of 20% speed increase corresponds to 1°C temperature increased
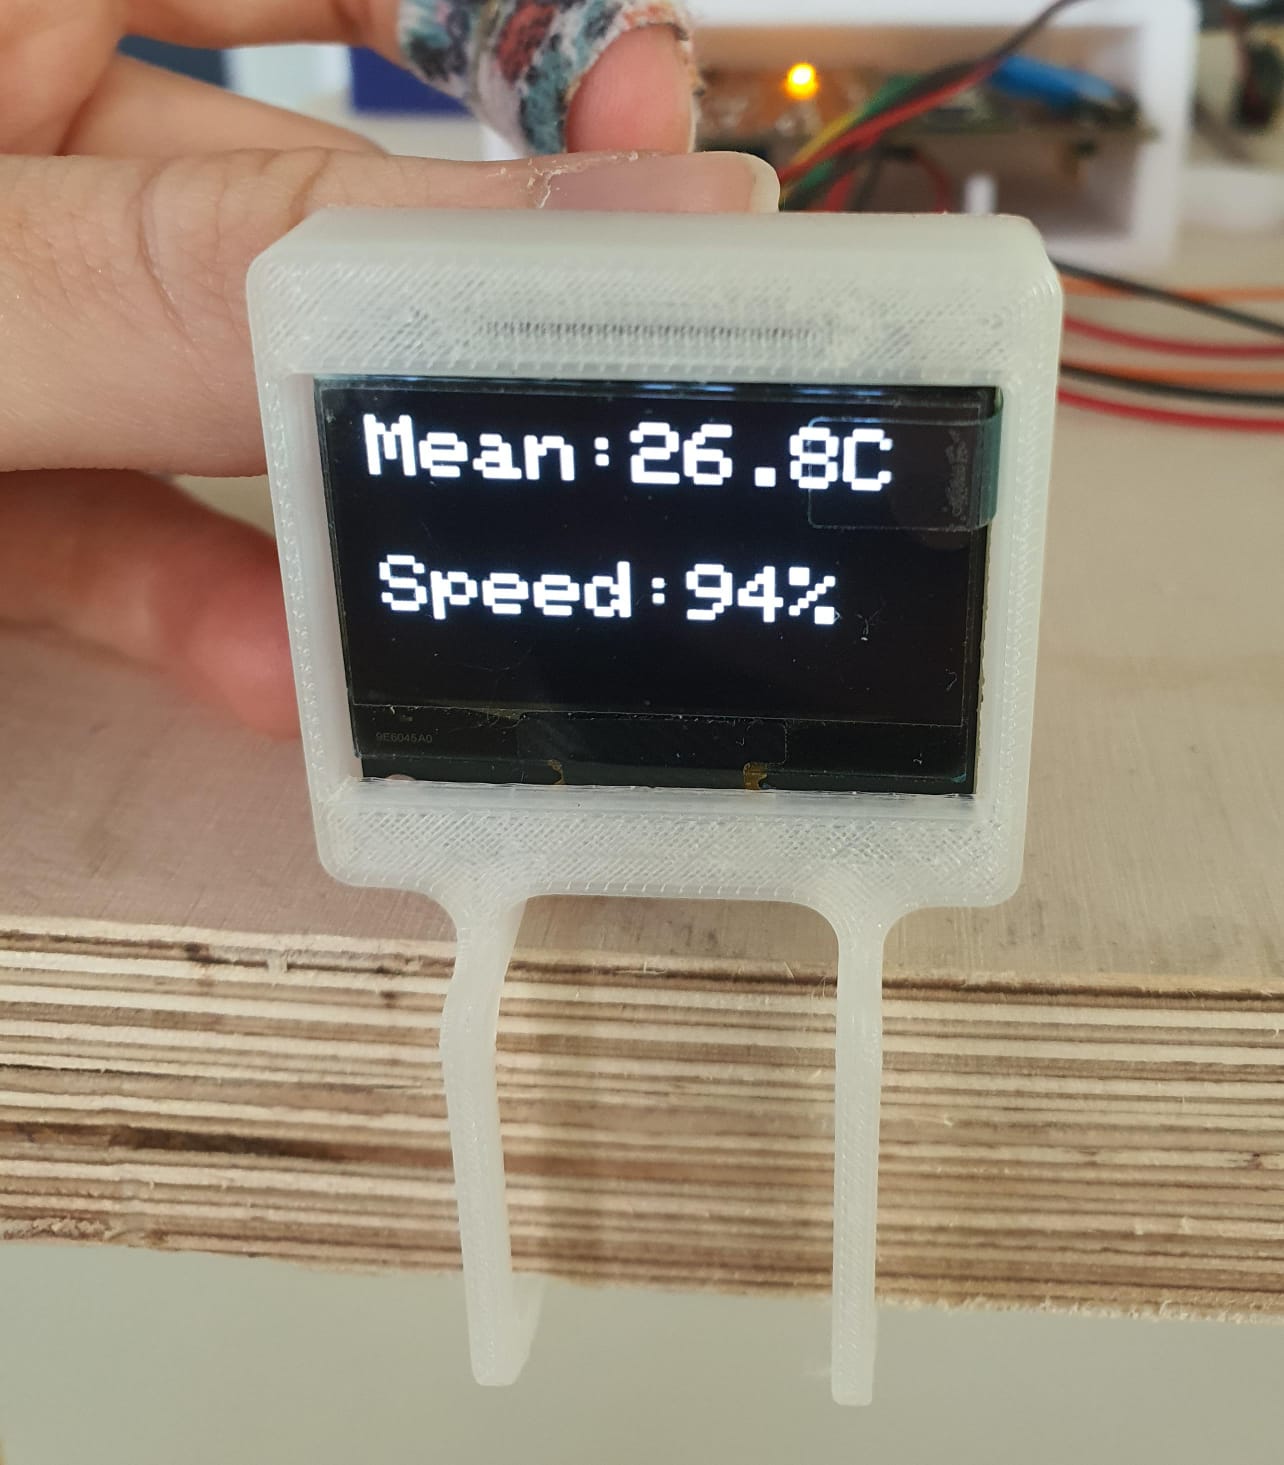
- Information about fan status and mean temperature is shown on an OLED01.3 display
*/
#include
#include
#include
#include
// I2C OLED Setup
#define I2C_ADDRESS 0x3C
#define SCREEN_WIDTH 128
#define SCREEN_HEIGHT 64
// Initialize the OLED display using the default I2C bus (Wire)
Adafruit_SH1106G display(SCREEN_WIDTH, SCREEN_HEIGHT, &Wire);
// DS18B20 Temperature Sensors
// Sensors are connected to GPIO26 and GPIO27
MicroDS18B20<26> sensor1;
MicroDS18B20<27> sensor2;
// LED and Fan Definitions
#define LED_PIN 22 // LED to indicate temperature threshold
#define FAN_PIN 16 // DC fan controlled via PWM
// Temperature thresholds for fan control
const float tempThreshold = 22.0; // Fan starts running at 22°C
const float maxTempForFan = 26.0; // Fan reaches 100% speed at 26°C
// Global variable to track when the fan turns on (in milliseconds)
unsigned long fanOnStartTime = 0;
void setup() {
Serial.begin(9600);
// Initialize I2C bus
Wire.begin();
// Initialize the OLED display; if not found, pause execution
if (!display.begin(I2C_ADDRESS, true)) {
Serial.println(F("OLED not found"));
while (1);
}
// Configure the LED and Fan pins as outputs
pinMode(LED_PIN, OUTPUT);
pinMode(FAN_PIN, OUTPUT);
// Display a startup message
display.clearDisplay();
display.setTextSize(2);
display.setTextColor(SH110X_WHITE);
display.setCursor(0, 10);
display.println("Starting...");
display.display();
delay(2000);
}
void loop() {
// Request temperature readings from both sensors
sensor1.requestTemp();
sensor2.requestTemp();
// Wait for conversion.
delay(1000);
// Variables to hold temperature values and sensor status
float temp1 = 0, temp2 = 0;
bool sensor1_ok = false, sensor2_ok = false;
// Read sensor1
if (sensor1.readTemp()) {
temp1 = sensor1.getTemp();
sensor1_ok = true;
} else {
Serial.println("Error reading sensor1");
}
// Read sensor2
if (sensor2.readTemp()) {
temp2 = sensor2.getTemp();
sensor2_ok = true;
} else {
Serial.println("Error reading sensor2");
}
// Validate sensor data
bool validData = sensor1_ok && sensor2_ok;
float meanTemp = 0;
if (validData) {
meanTemp = (temp1 + temp2) / 2.0;
Serial.print("t1: ");
Serial.print(temp1);
Serial.print(" C, t2: ");
Serial.print(temp2);
Serial.print(" C, Mean: ");
Serial.print(meanTemp);
Serial.println(" C");
} else {
Serial.println("Cannot compute mean: one or more sensor readings failed");
}
// Variables for fan control
bool fanOn = false;
int fanSpeedPercent = 0;
int pwmValue = 0; // PWM value (0 - 255)
// Only control the fan if sensor data is valid
if (validData && (meanTemp >= tempThreshold)) {
digitalWrite(LED_PIN, HIGH); // Turn on LED
// Calculate fan speed percentage based on temperature between threshold and maxTempForFan
if (meanTemp >= maxTempForFan) {
fanSpeedPercent = 100;
} else {
fanSpeedPercent = (int)(((meanTemp - tempThreshold) / (maxTempForFan - tempThreshold)) * 100);
}
// Map the fan speed percentage to PWM value in the range 170 to 255
pwmValue = map(fanSpeedPercent, 0, 100, 170, 255);
analogWrite(FAN_PIN, pwmValue);
fanOn = true;
// Record fan activation time if it just started
if (fanOnStartTime == 0) {
fanOnStartTime = millis();
}
} else {
digitalWrite(LED_PIN, LOW); // Turn off LED
analogWrite(FAN_PIN, 0); // Turn off fan
fanSpeedPercent = 0;
fanOnStartTime = 0;
}
// Update the OLED display
display.clearDisplay();
display.setTextSize(2);
display.setCursor(0, 0);
if (validData) {
// First line: Mean temperature with unit Celcius degrees
display.print("Mean:");
display.print(meanTemp, 1);
display.print("C");
// Second line: Fan status/speed
display.setTextSize(2);
display.setCursor(0, 35);
if (fanOn) {
// For the first 2 seconds, display "Fan: ON"
if (millis() - fanOnStartTime < 2000) {
display.println("Fan: ON");
} else {
display.print("Speed:"); //Afterwards, show the fan speed percentage
display.print(fanSpeedPercent);
display.println("%");
}
} else {
display.println("Fan: OFF");
}
} else {
display.println("Sensor error");
}
display.display();
delay(1000);
}
Reflection and Struggles - Week 11
Assembling LapTable 1.0 Prototype - Week 12
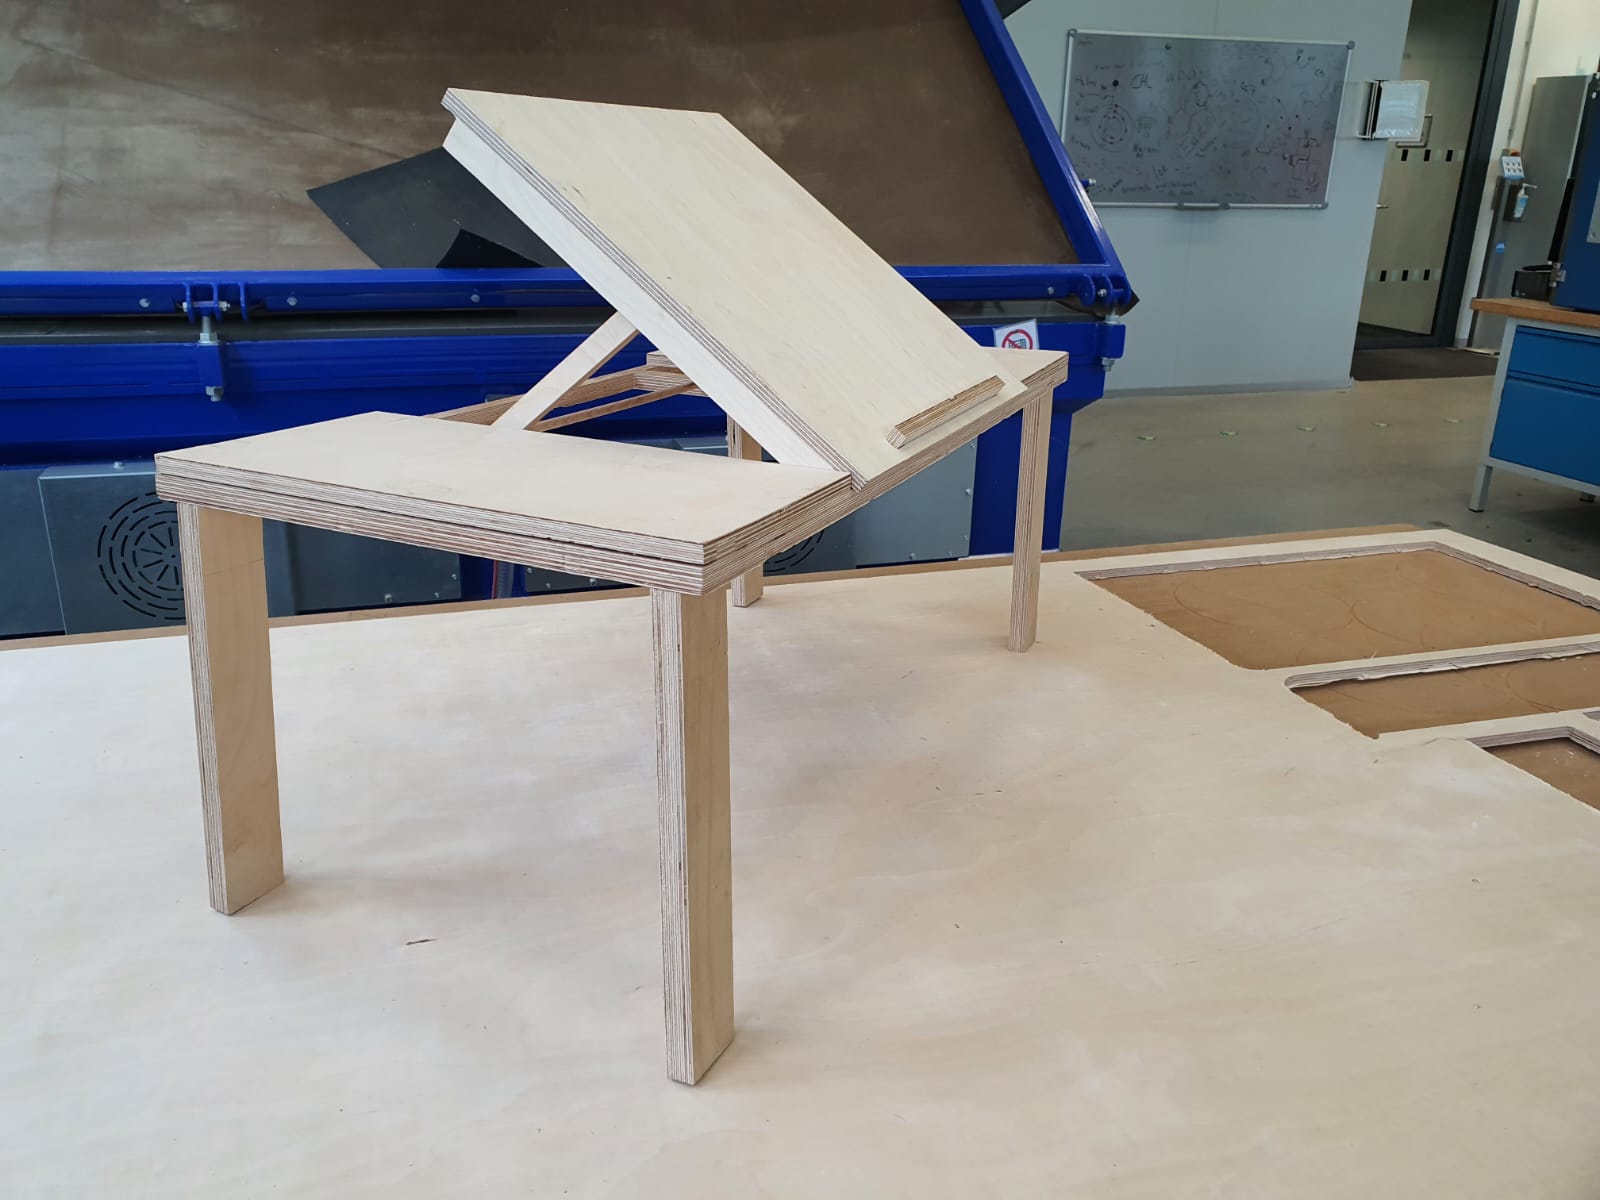
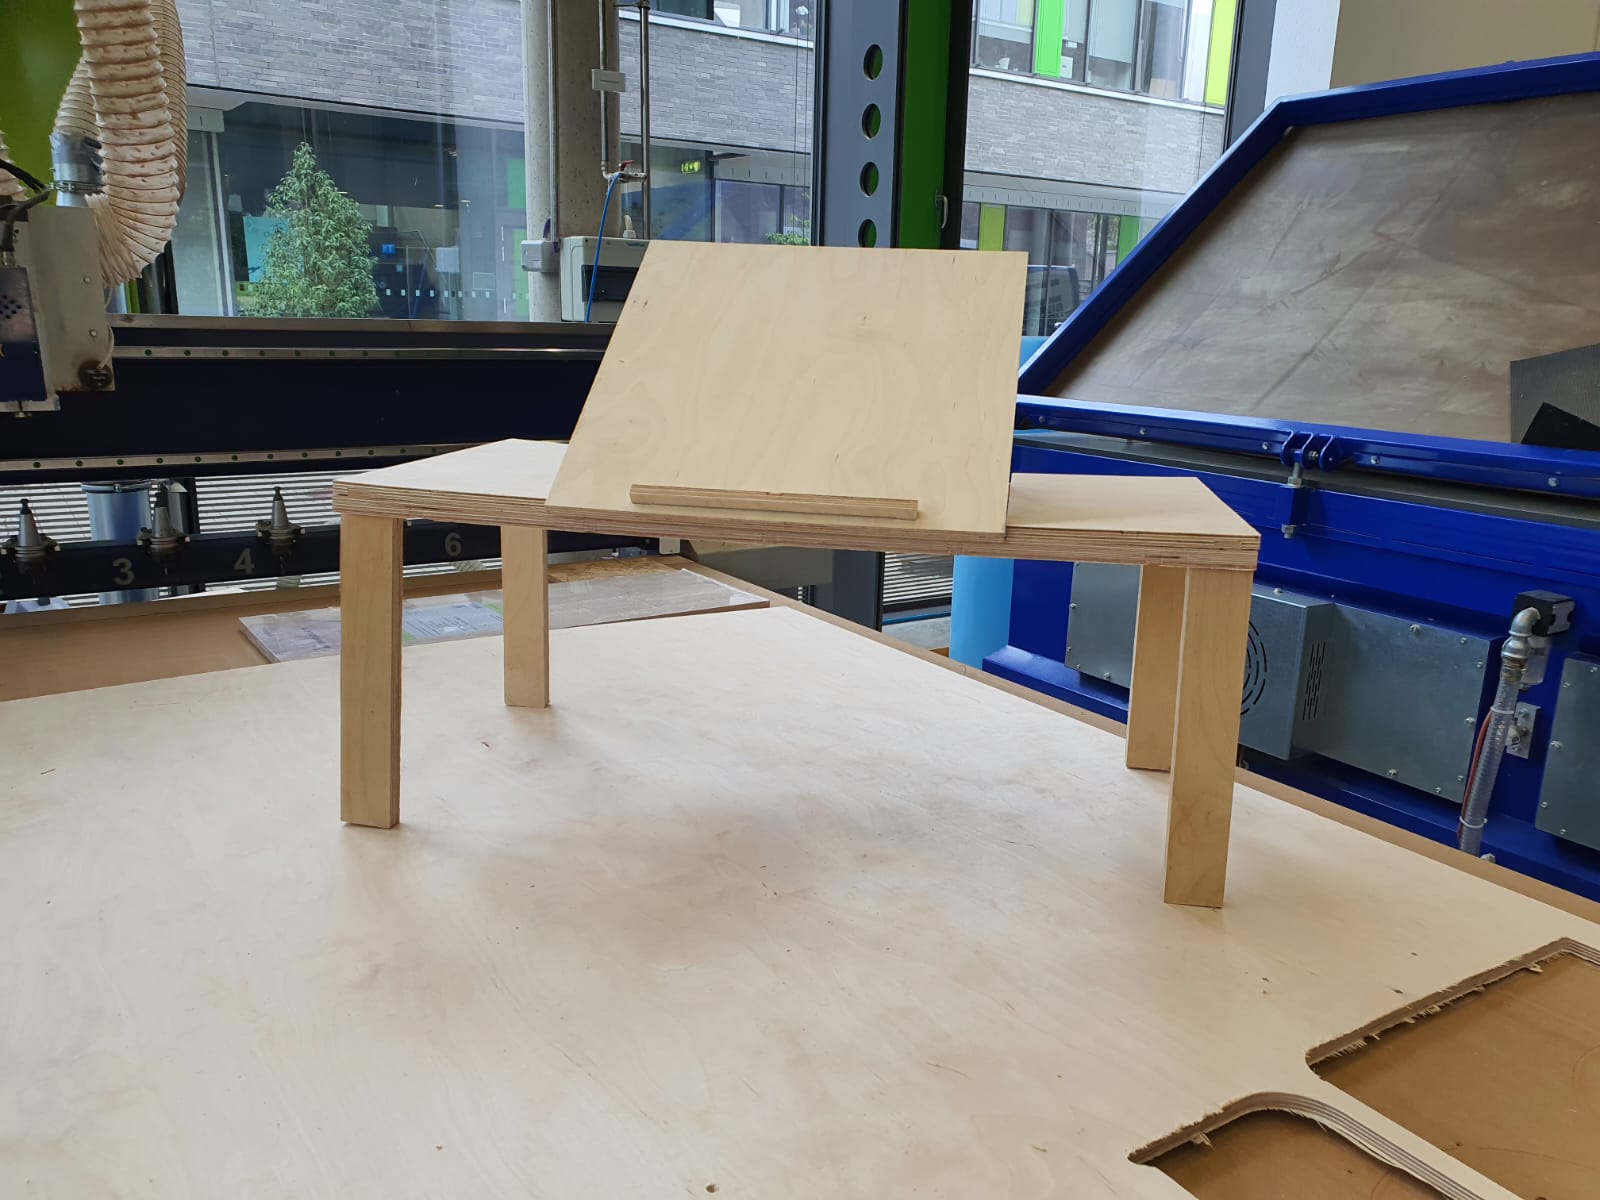
Work Completed Up to the Midterm
I tested and experimented with the following aspects of my Lap Table:
- PCB design and production: created a board to control the fan (output device) using temperature-sensor readings (input device).
- Lap Table prototype 1.0: cut the first design and evaluated it.
- Temperature-benchmark tests: determined the threshold for driving the fan in Arduino IDE.
- DS18B20 sensor tests: verified the temperature sensor with a test fan.
- PWM mapping: mapped temperature values to the fan-speed range.
Work Remaining After the Midterm
I still need to complete the following tasks for my Lap Table:
- Redesign the Lap Table: improve stability and add new features.
- Real-fan testing: map PWM values from the DS18B20 sensor to the speed of my 12 V DC fan.
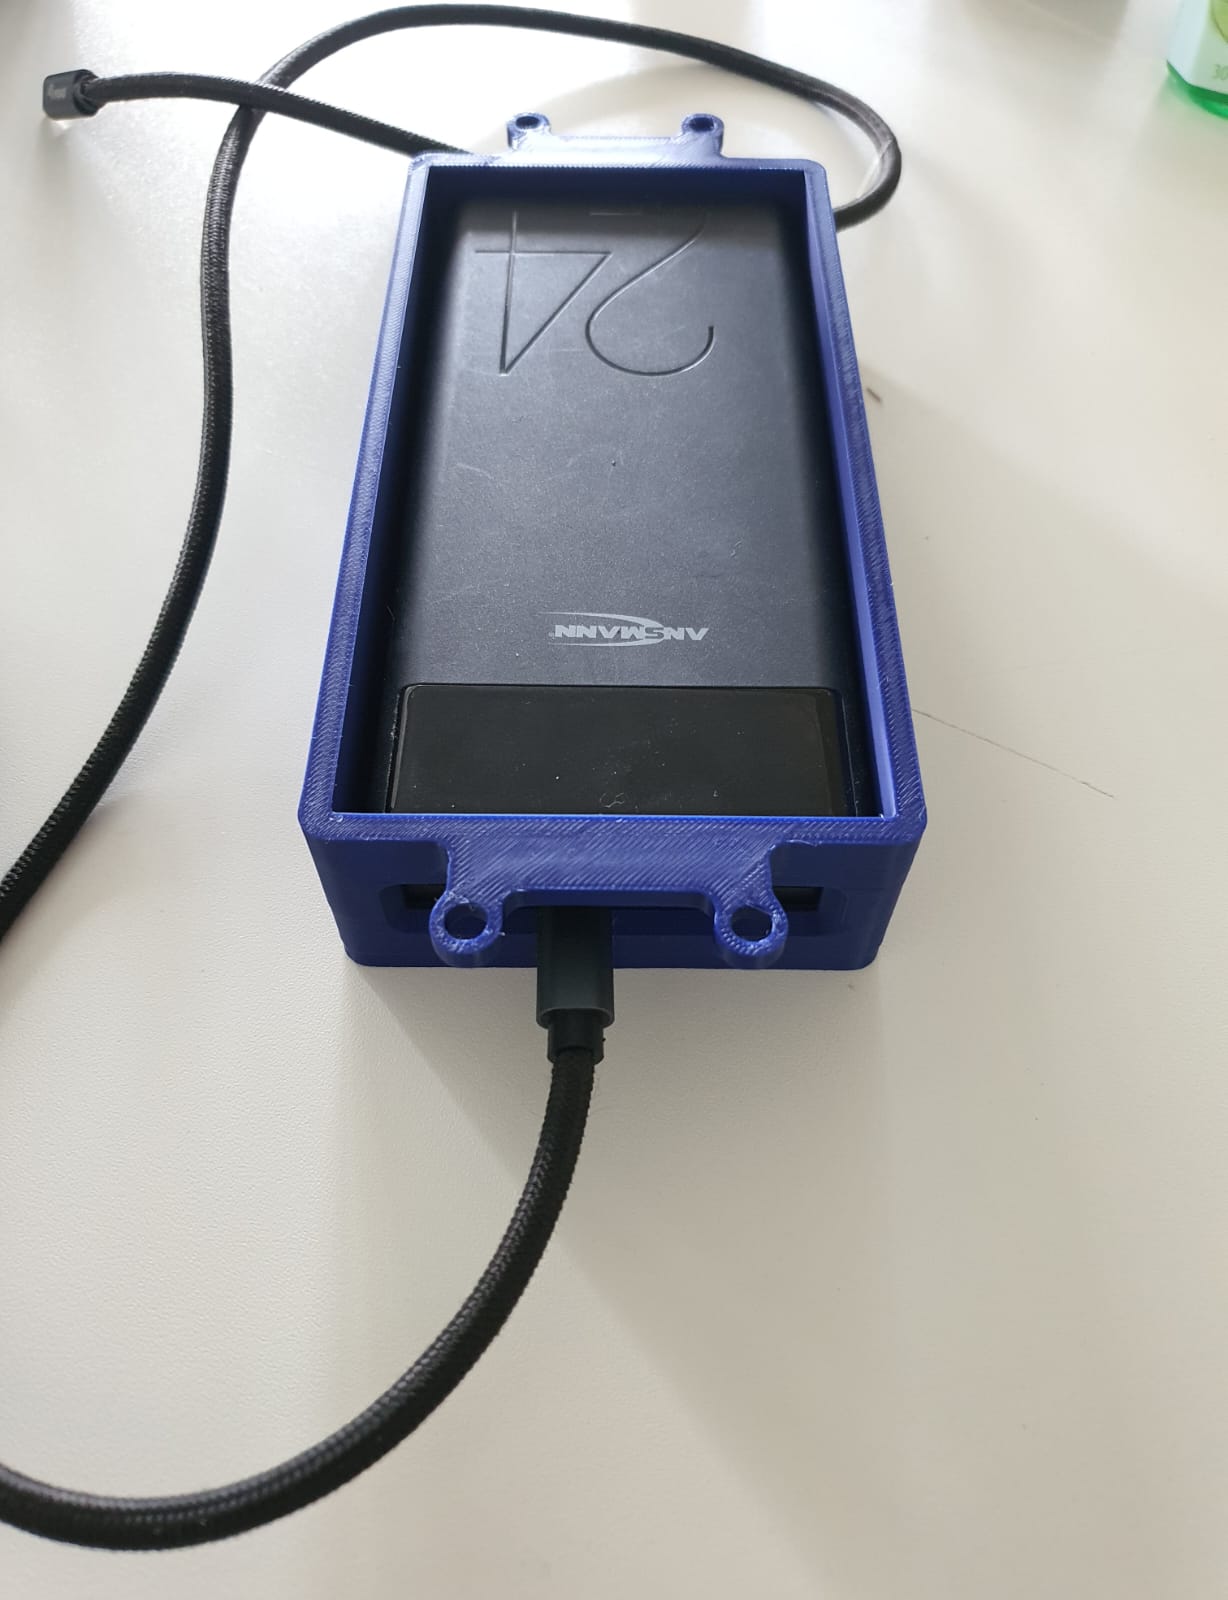
- Power-supply testing: evaluate a USB-PD (Power Delivery) trigger module with the electronics setup.
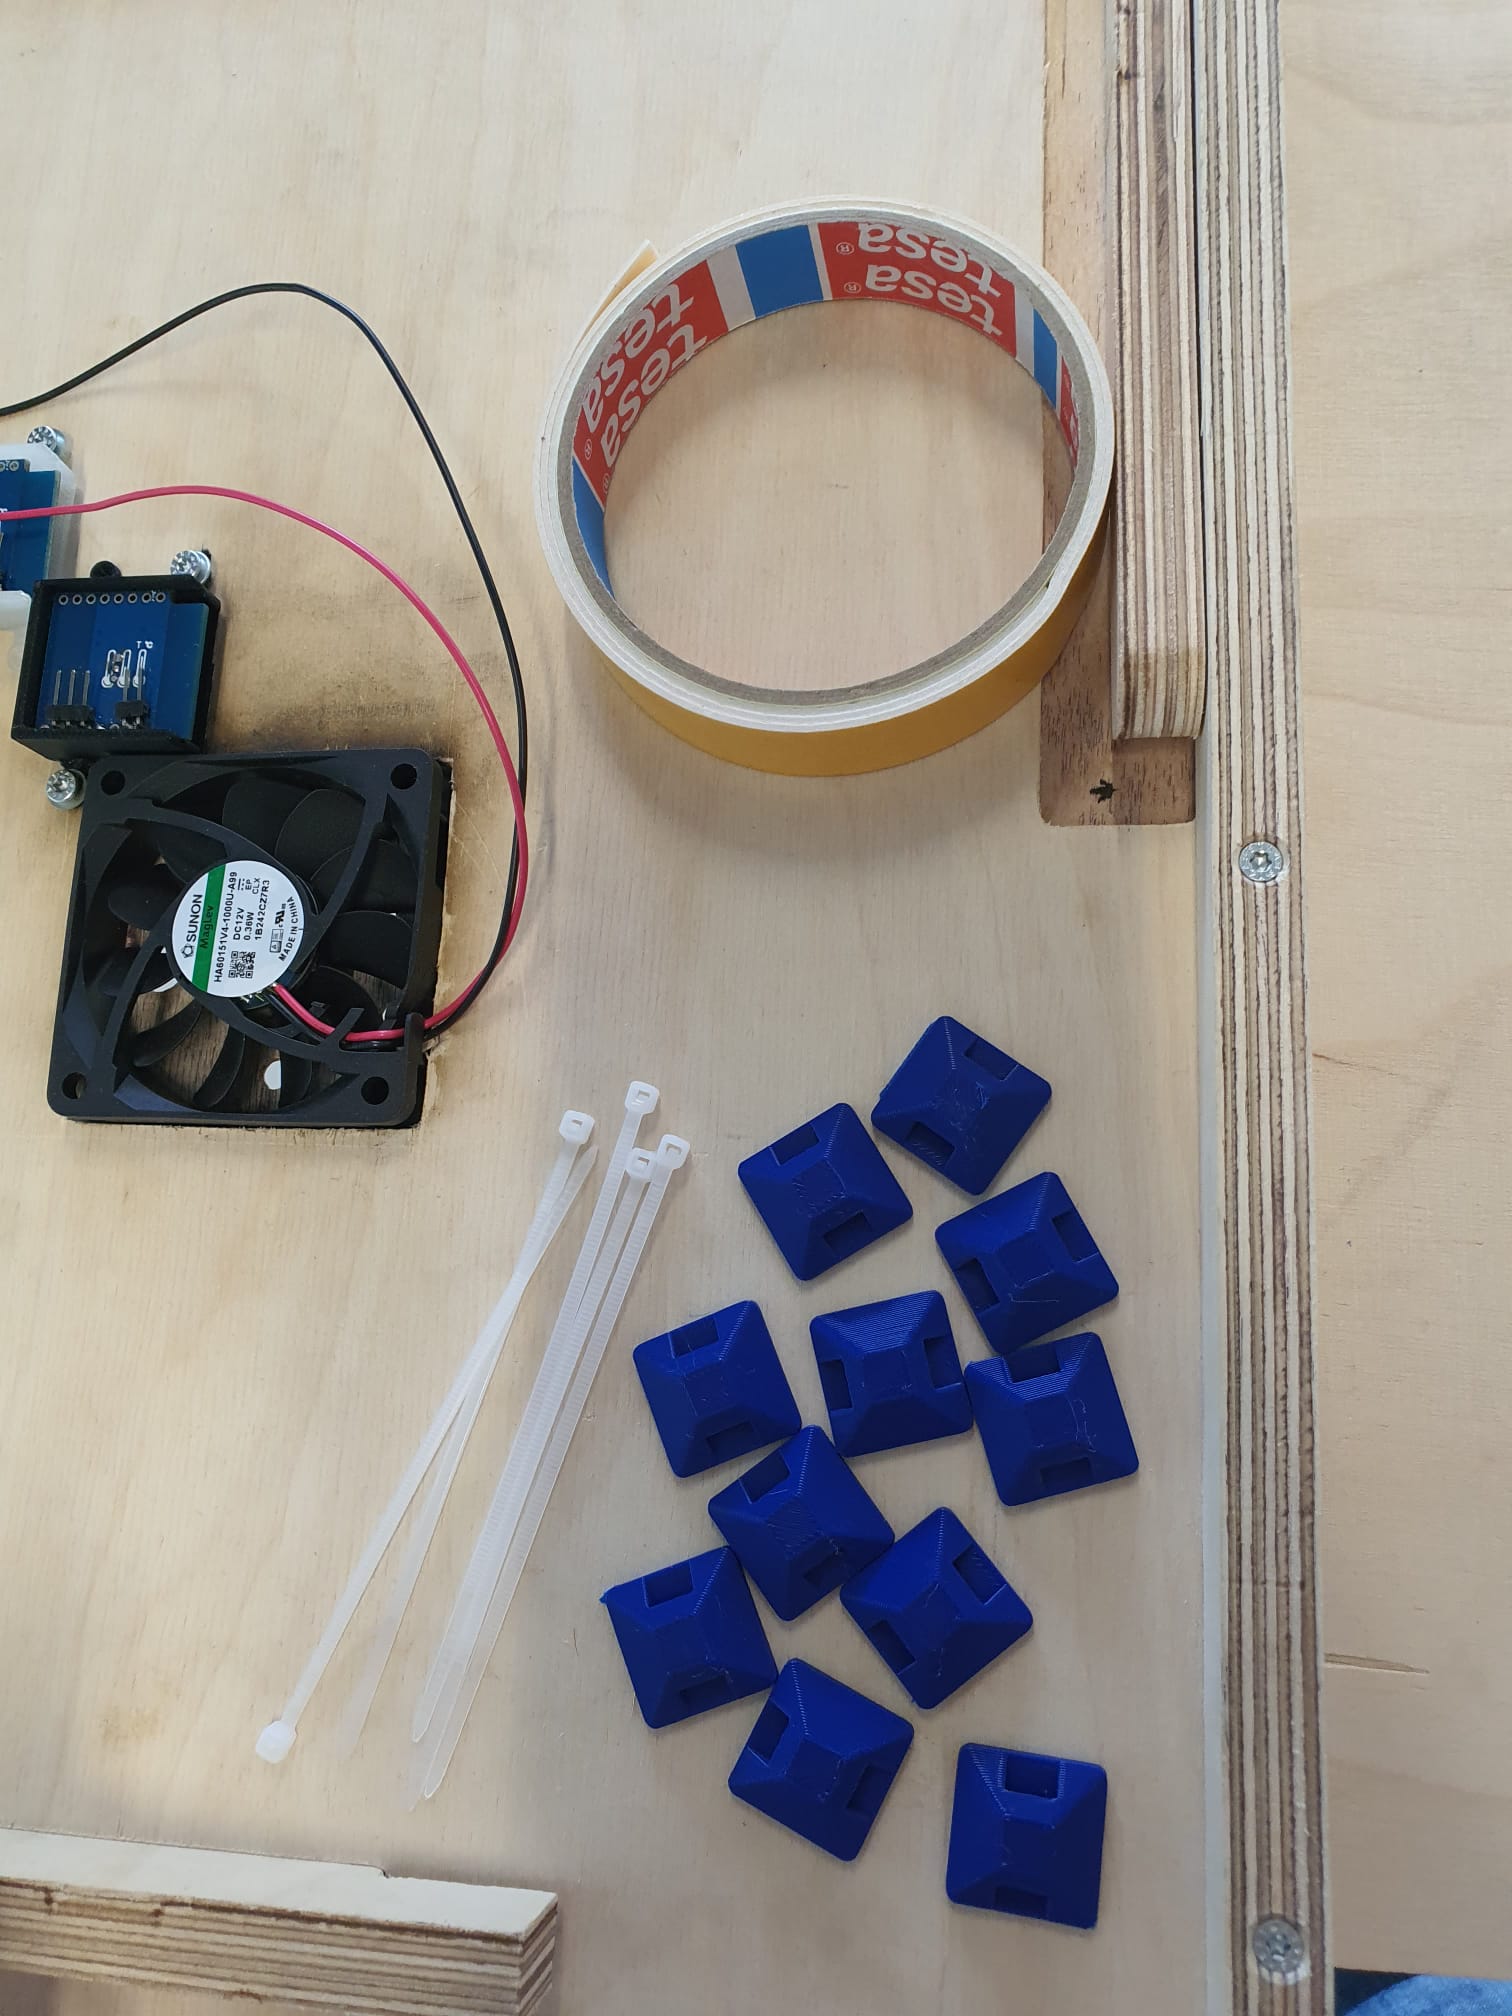
- Cable management and electronics organizer: design and 3-D-print pieces to be integrated into the table, keeping ergonomics in mind.
- Final evaluation: critically assess strengths and weaknesses to inform future projects.
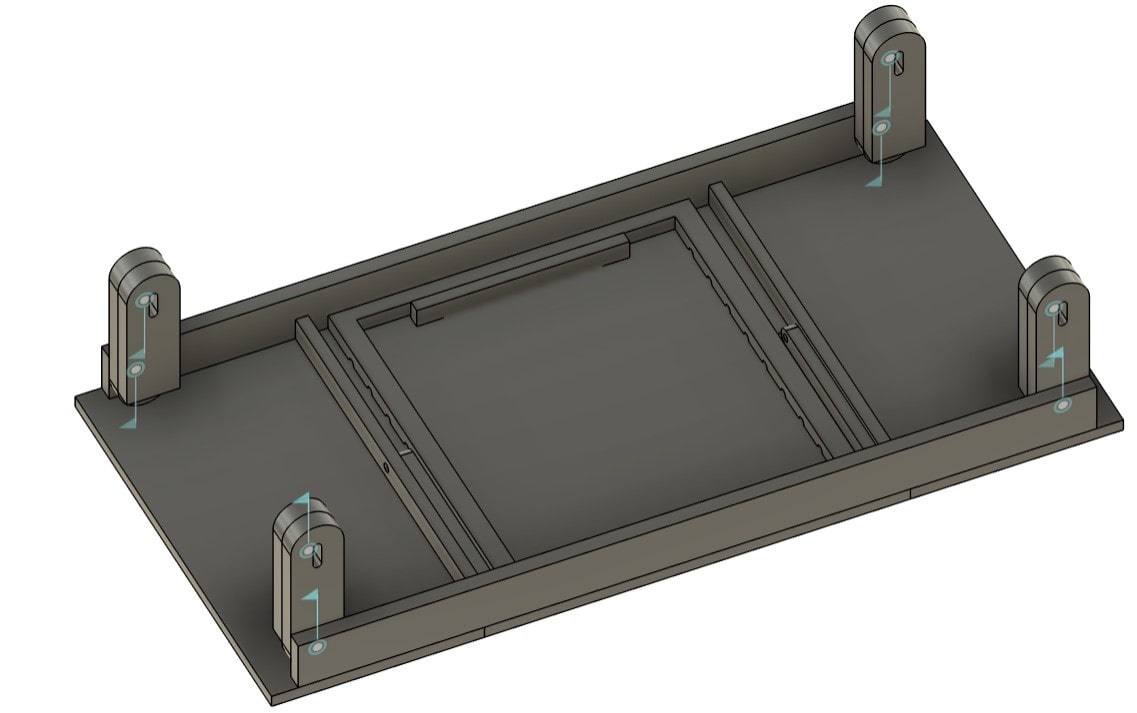
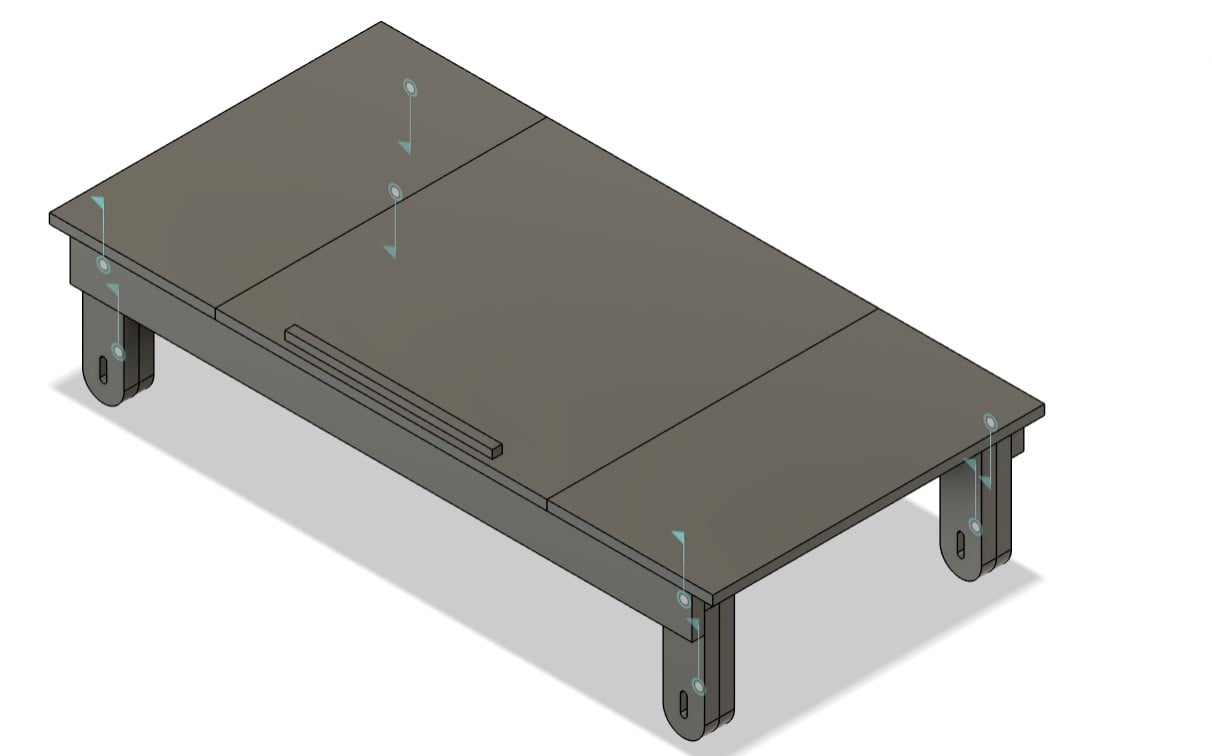
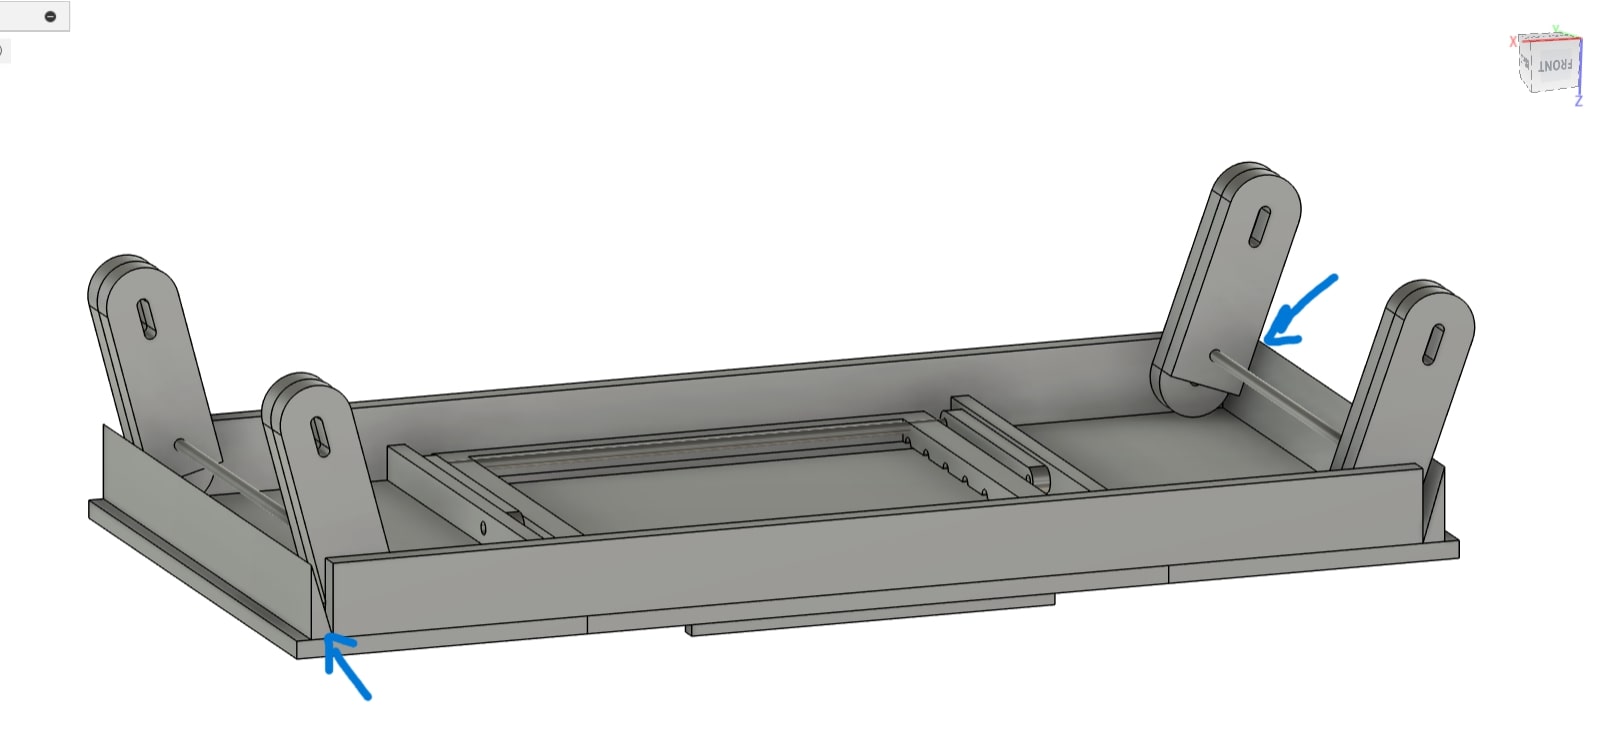
Redesigning my Lap Table: Version 2.0 - Week 14
Determining PWM range for my Actual Fan - Week 15
                                        /*
This code is to find out the PWM mapping range (min, max) for my fan
*/

const int FAN_PIN    = 16;    // PWM pin to fan MOSFET/gate

void setup() {
  Serial.begin(9600);
  pinMode(FAN_PIN, OUTPUT);
}
void loop() {
  for (int p = 0; p <= 255; p++) {
    analogWrite(FAN_PIN, p);
    Serial.print("PWM = "); Serial.println(p);
    delay(500);         // give the fan time to respond
  }
  while(1);            // stop after one loop
}
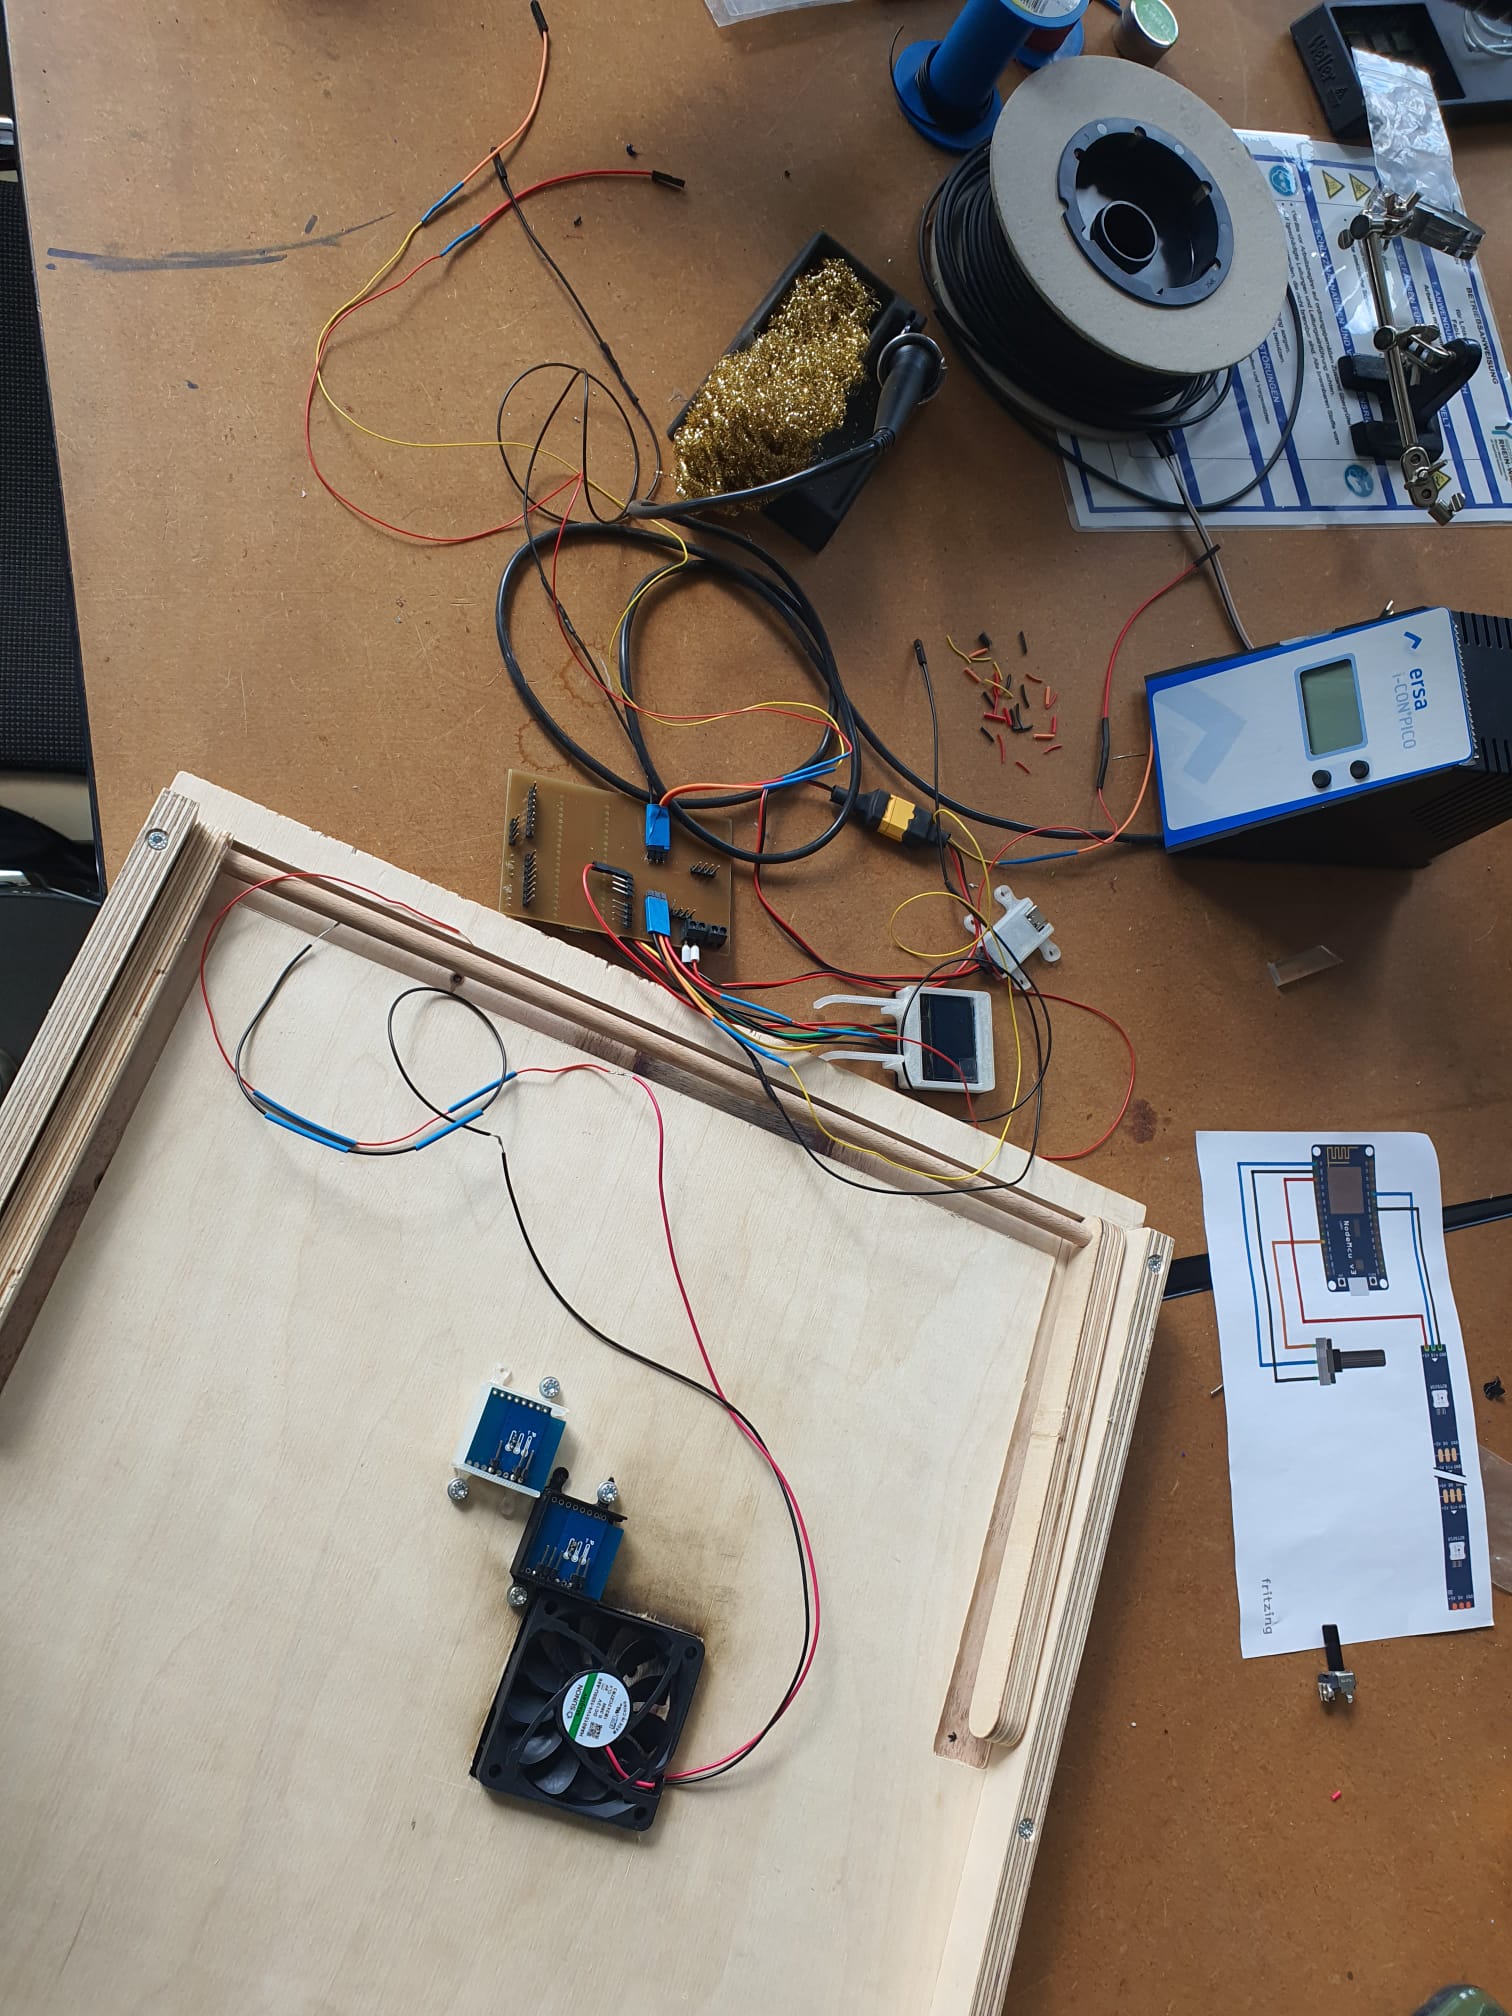
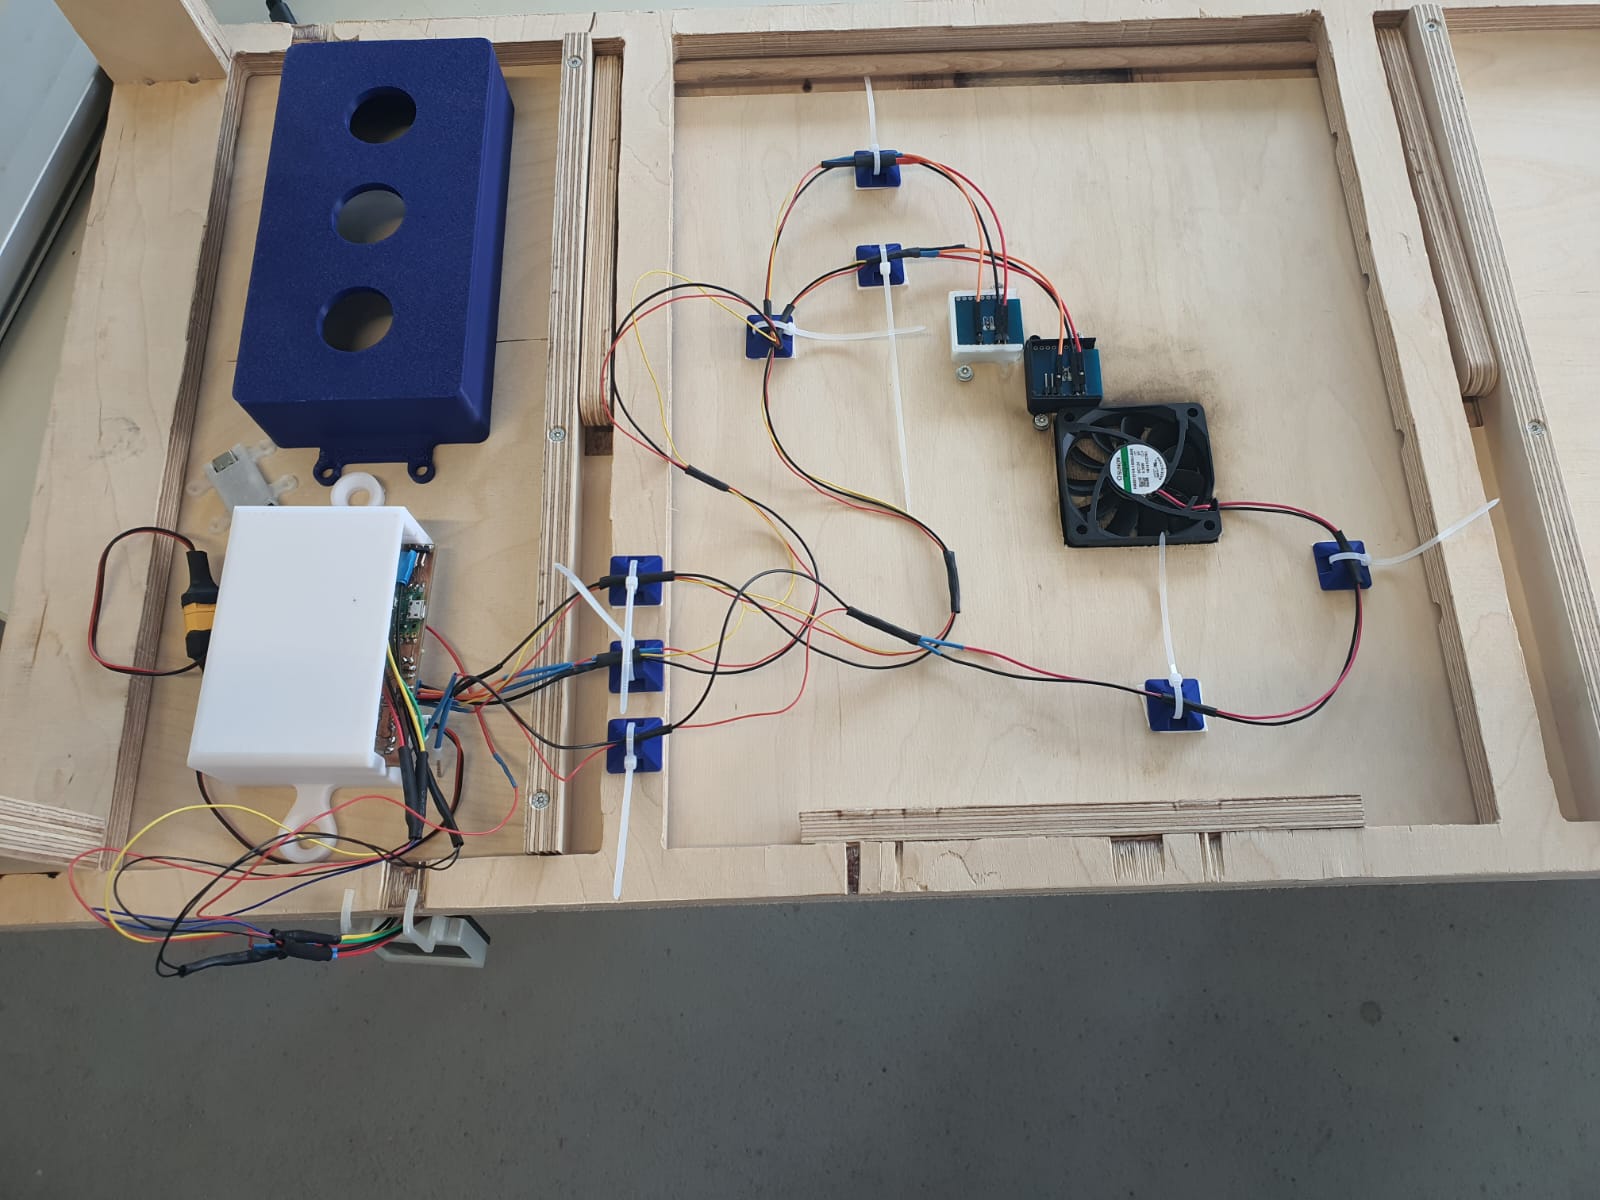
Progress on System Integration - Week 15
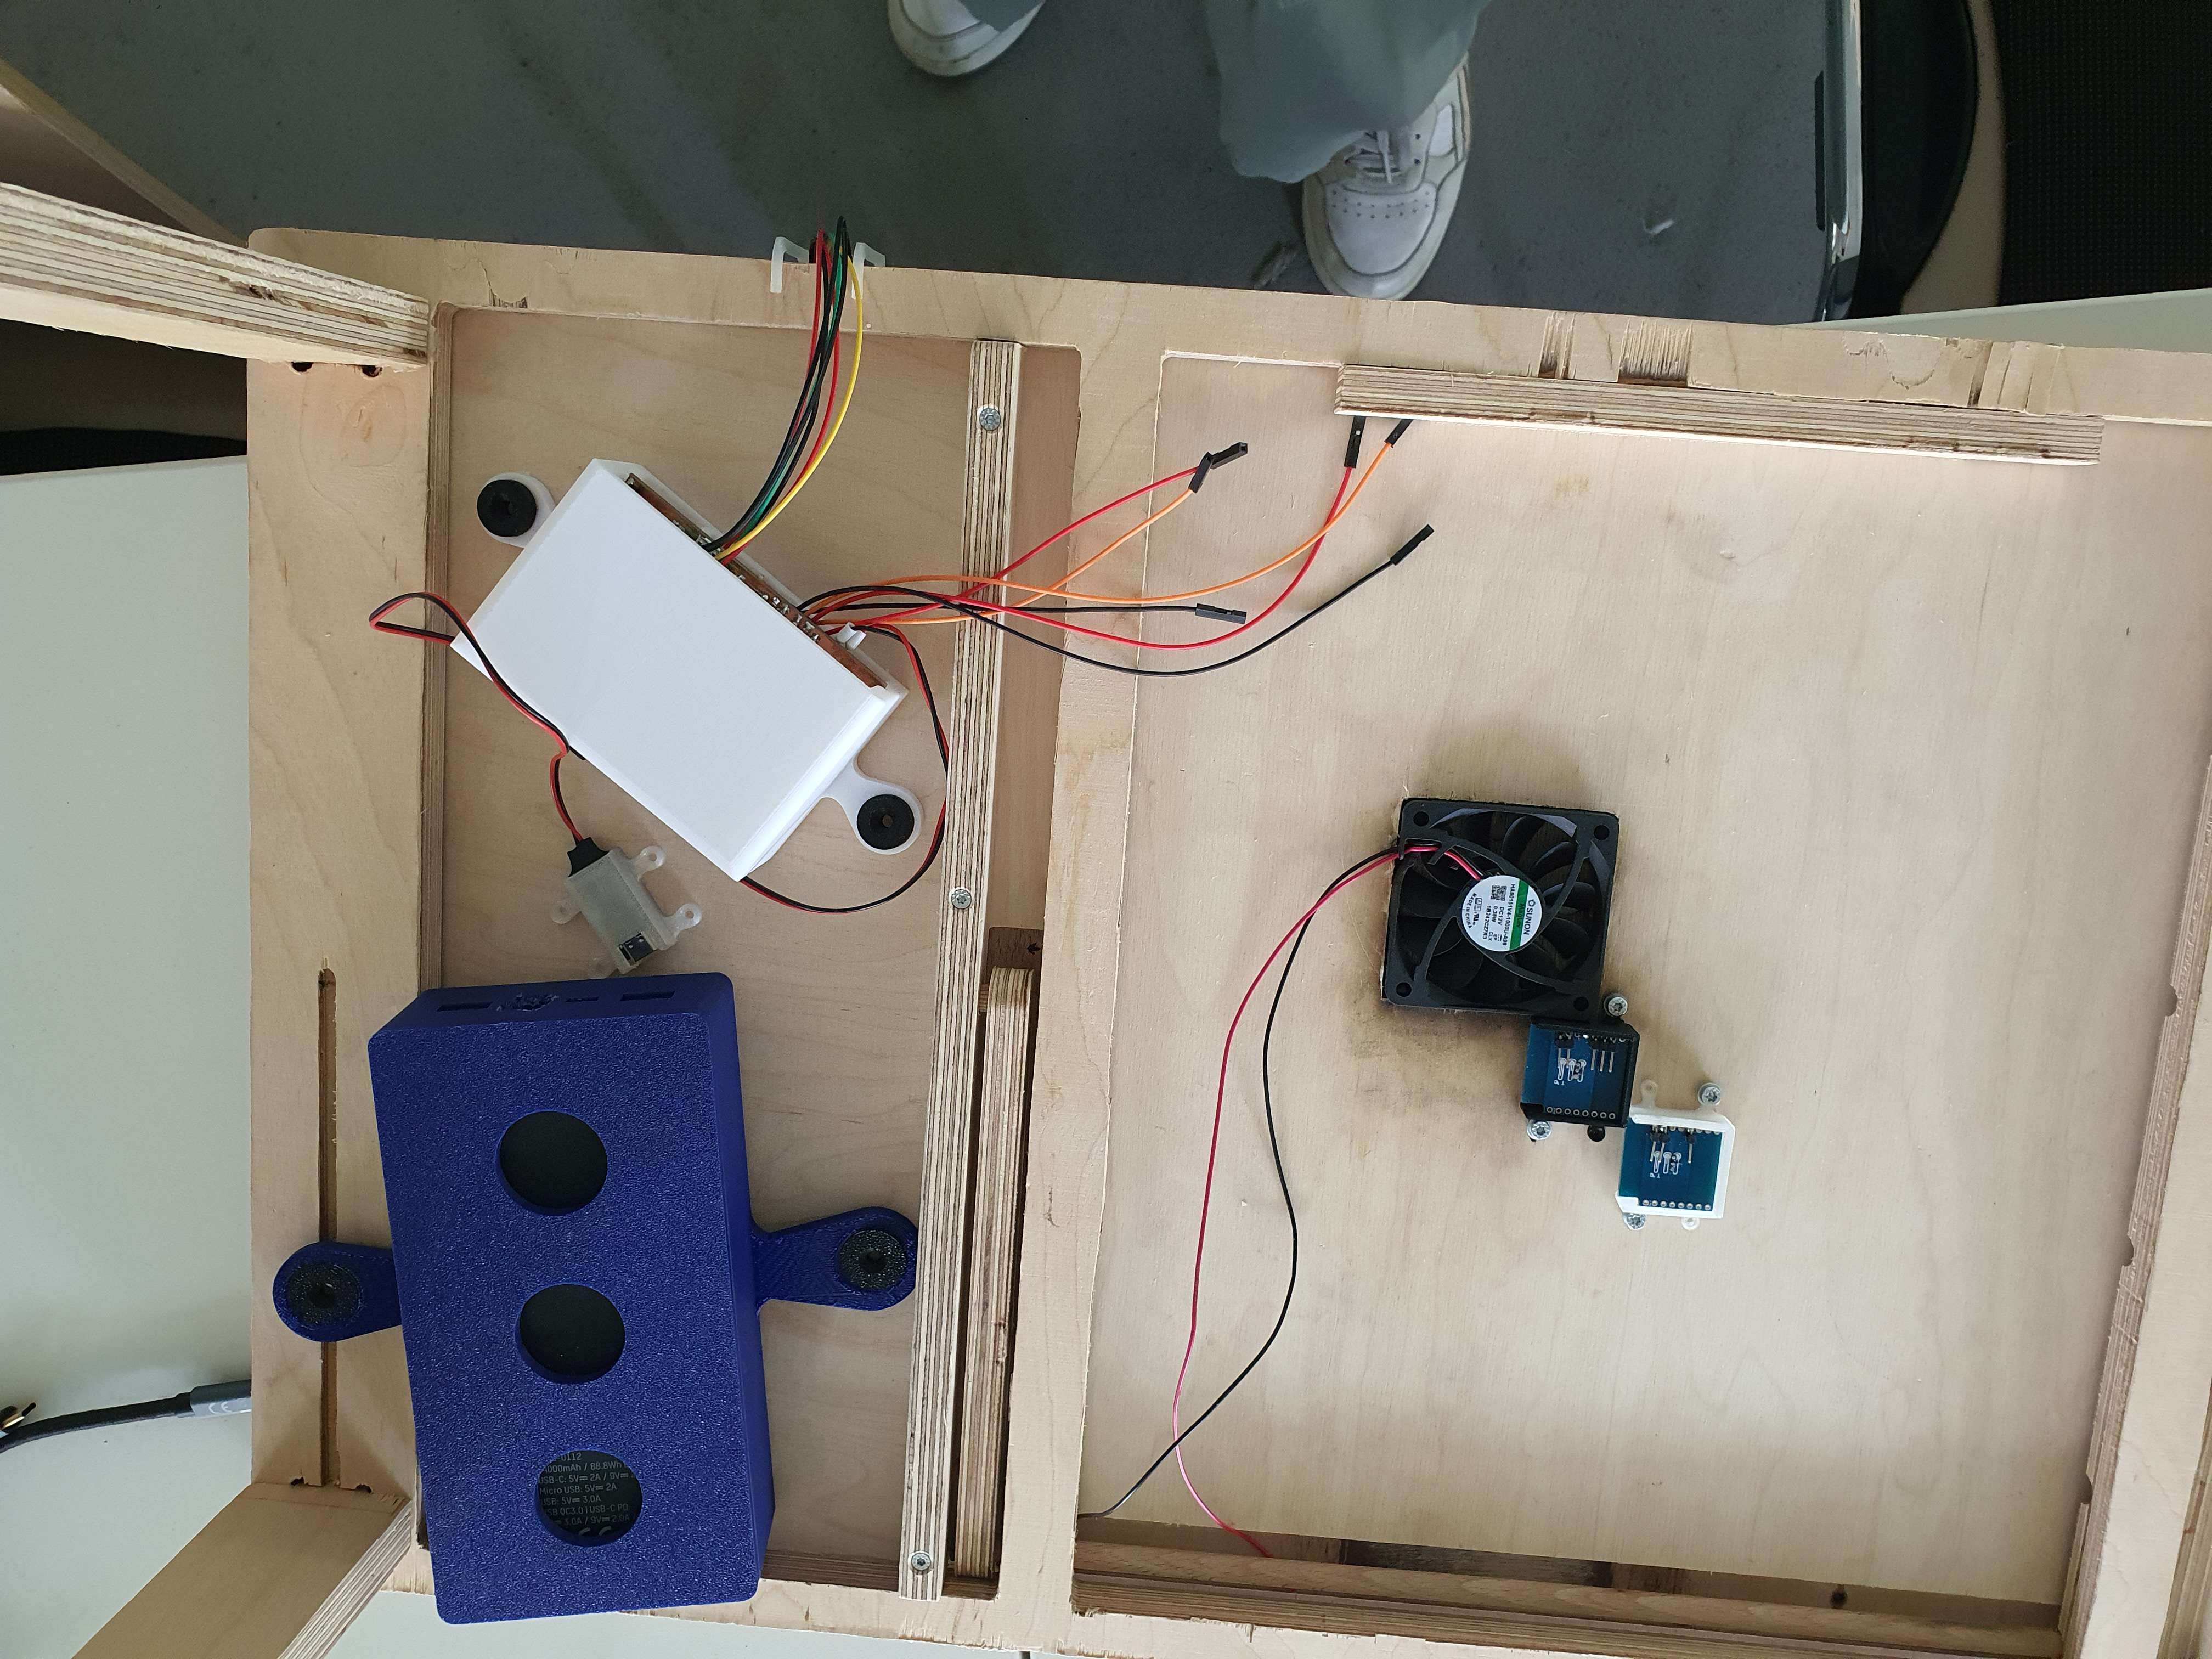
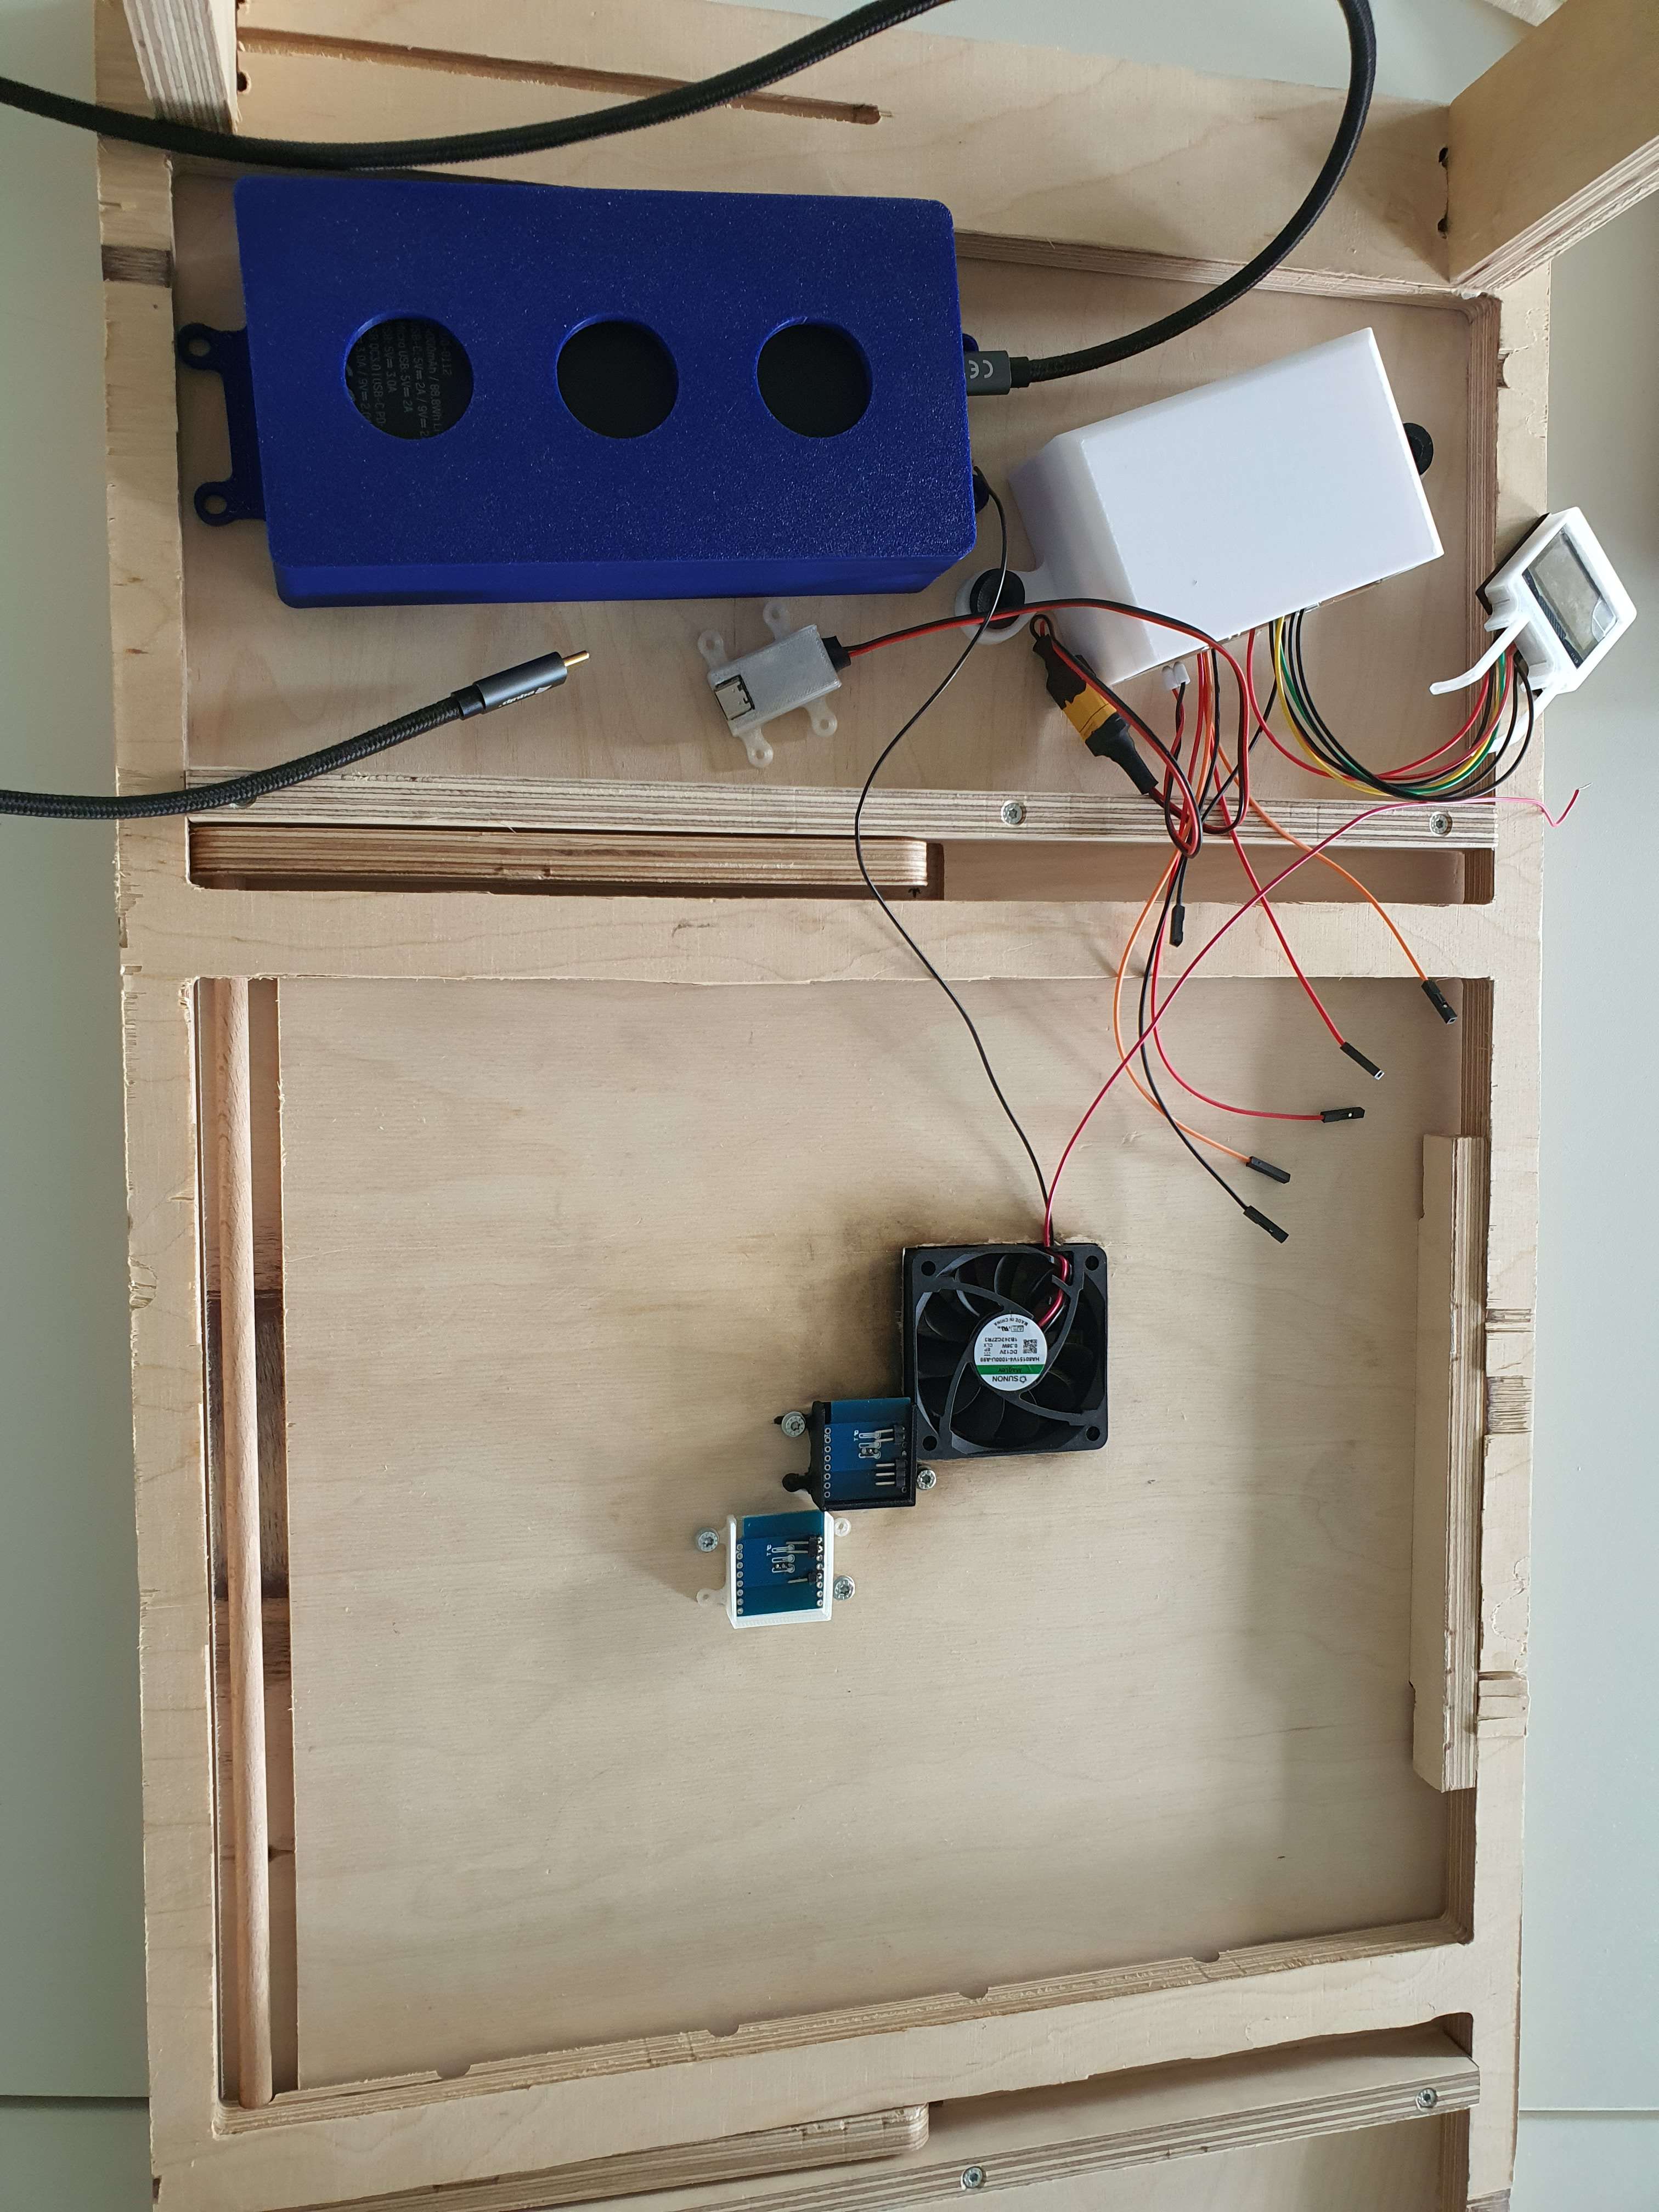
System Integration Overview
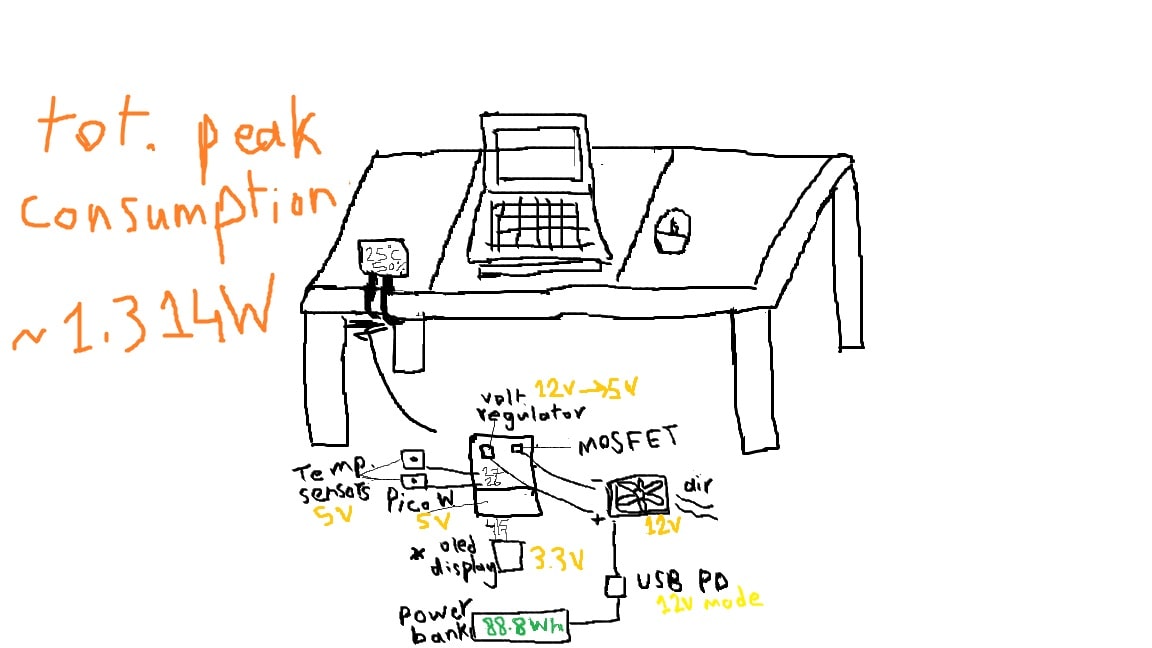
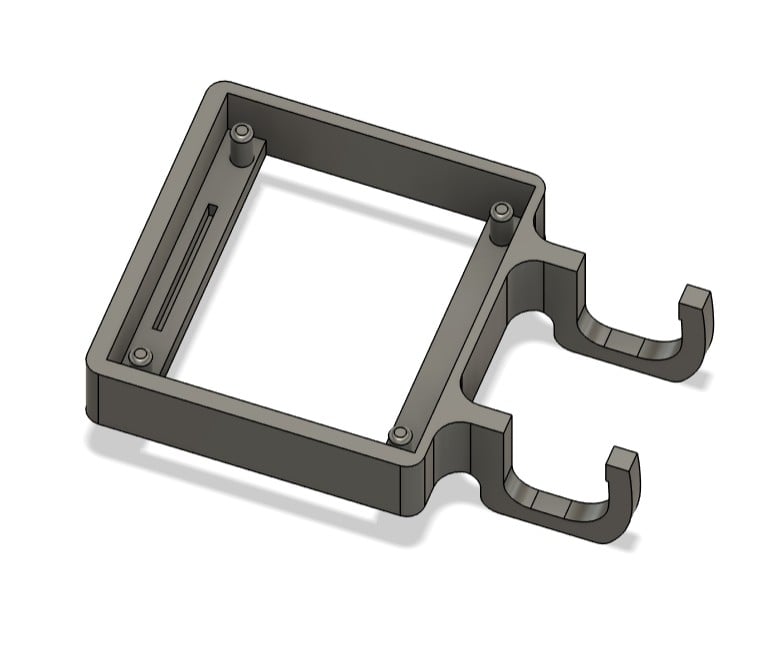
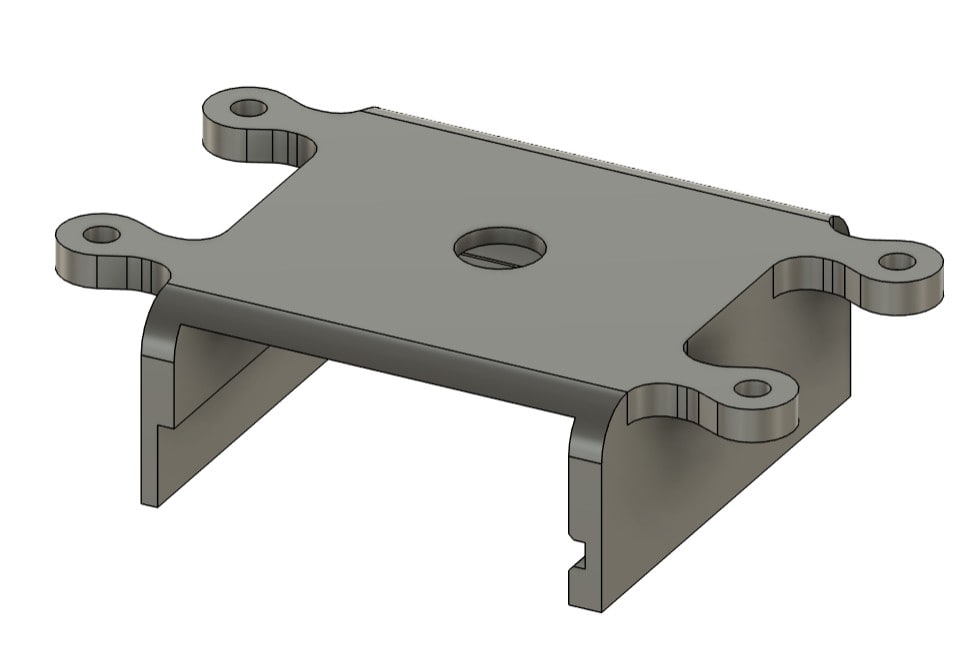
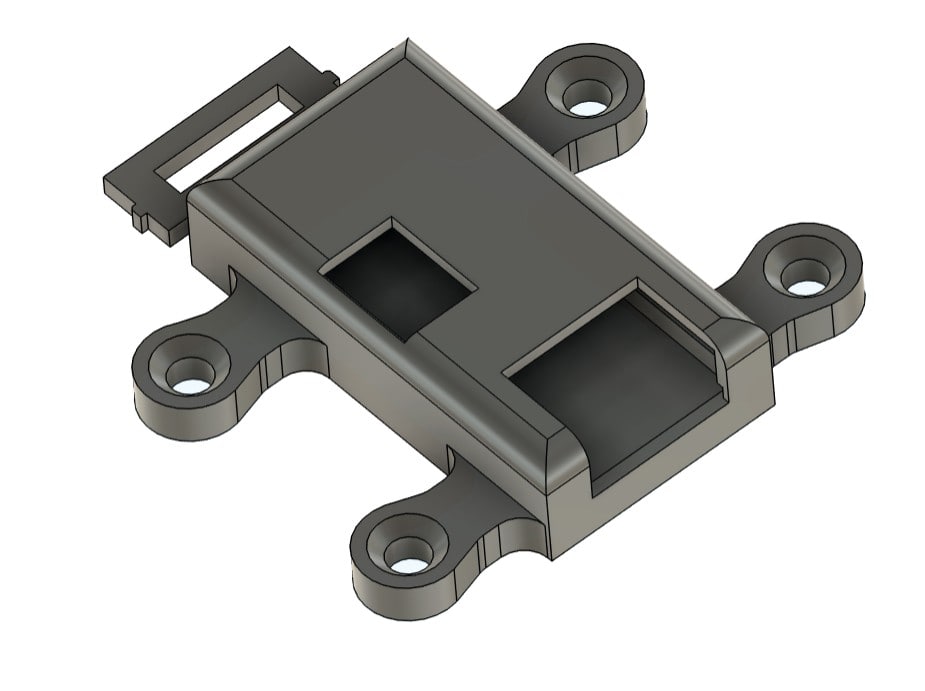
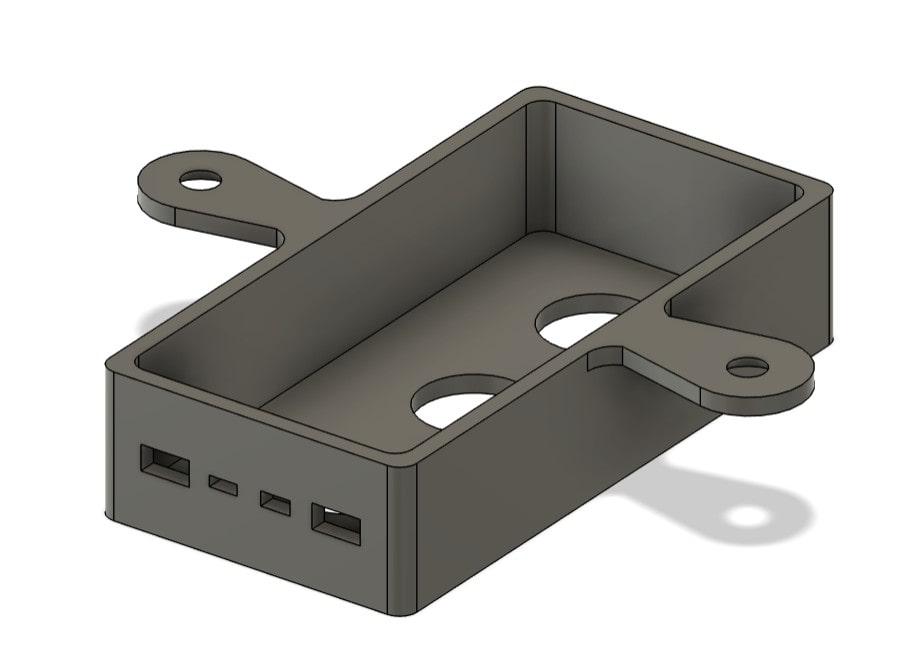
Final Designs of All Electronics Housings
Assembly for Each Electronic Component + its Housing
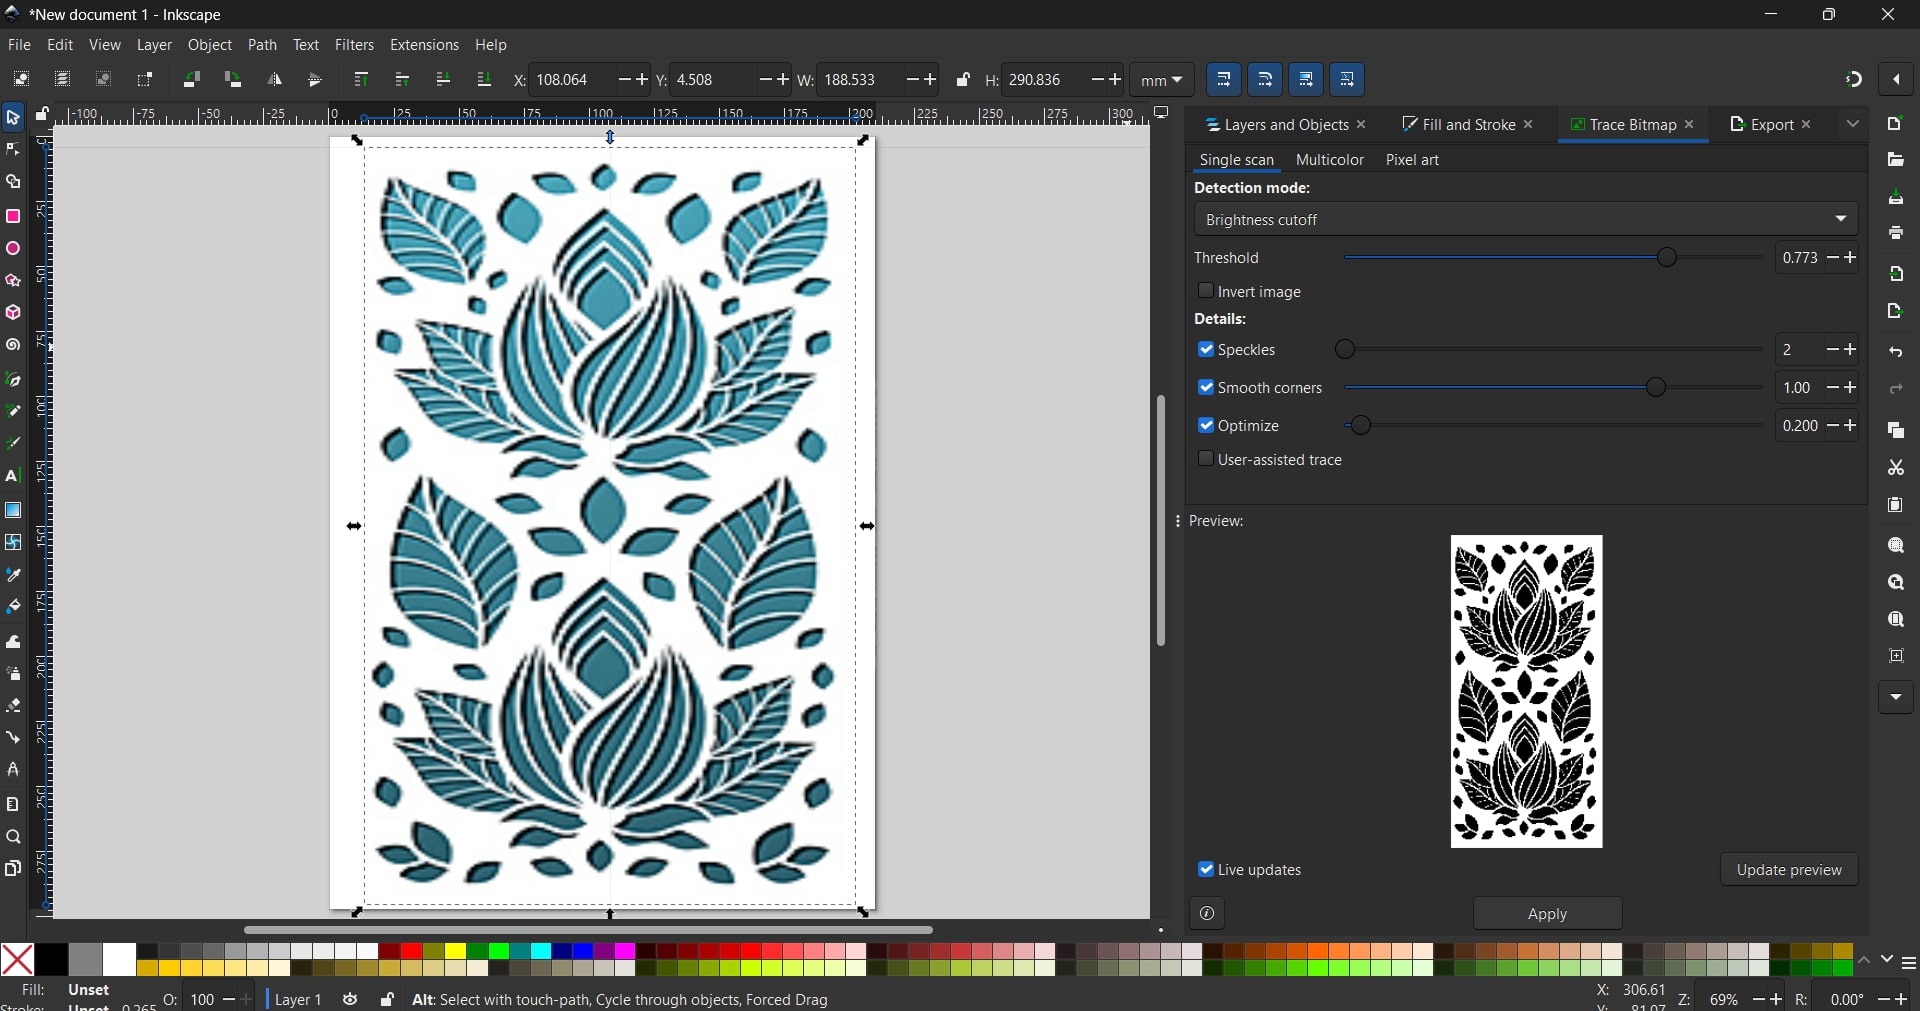
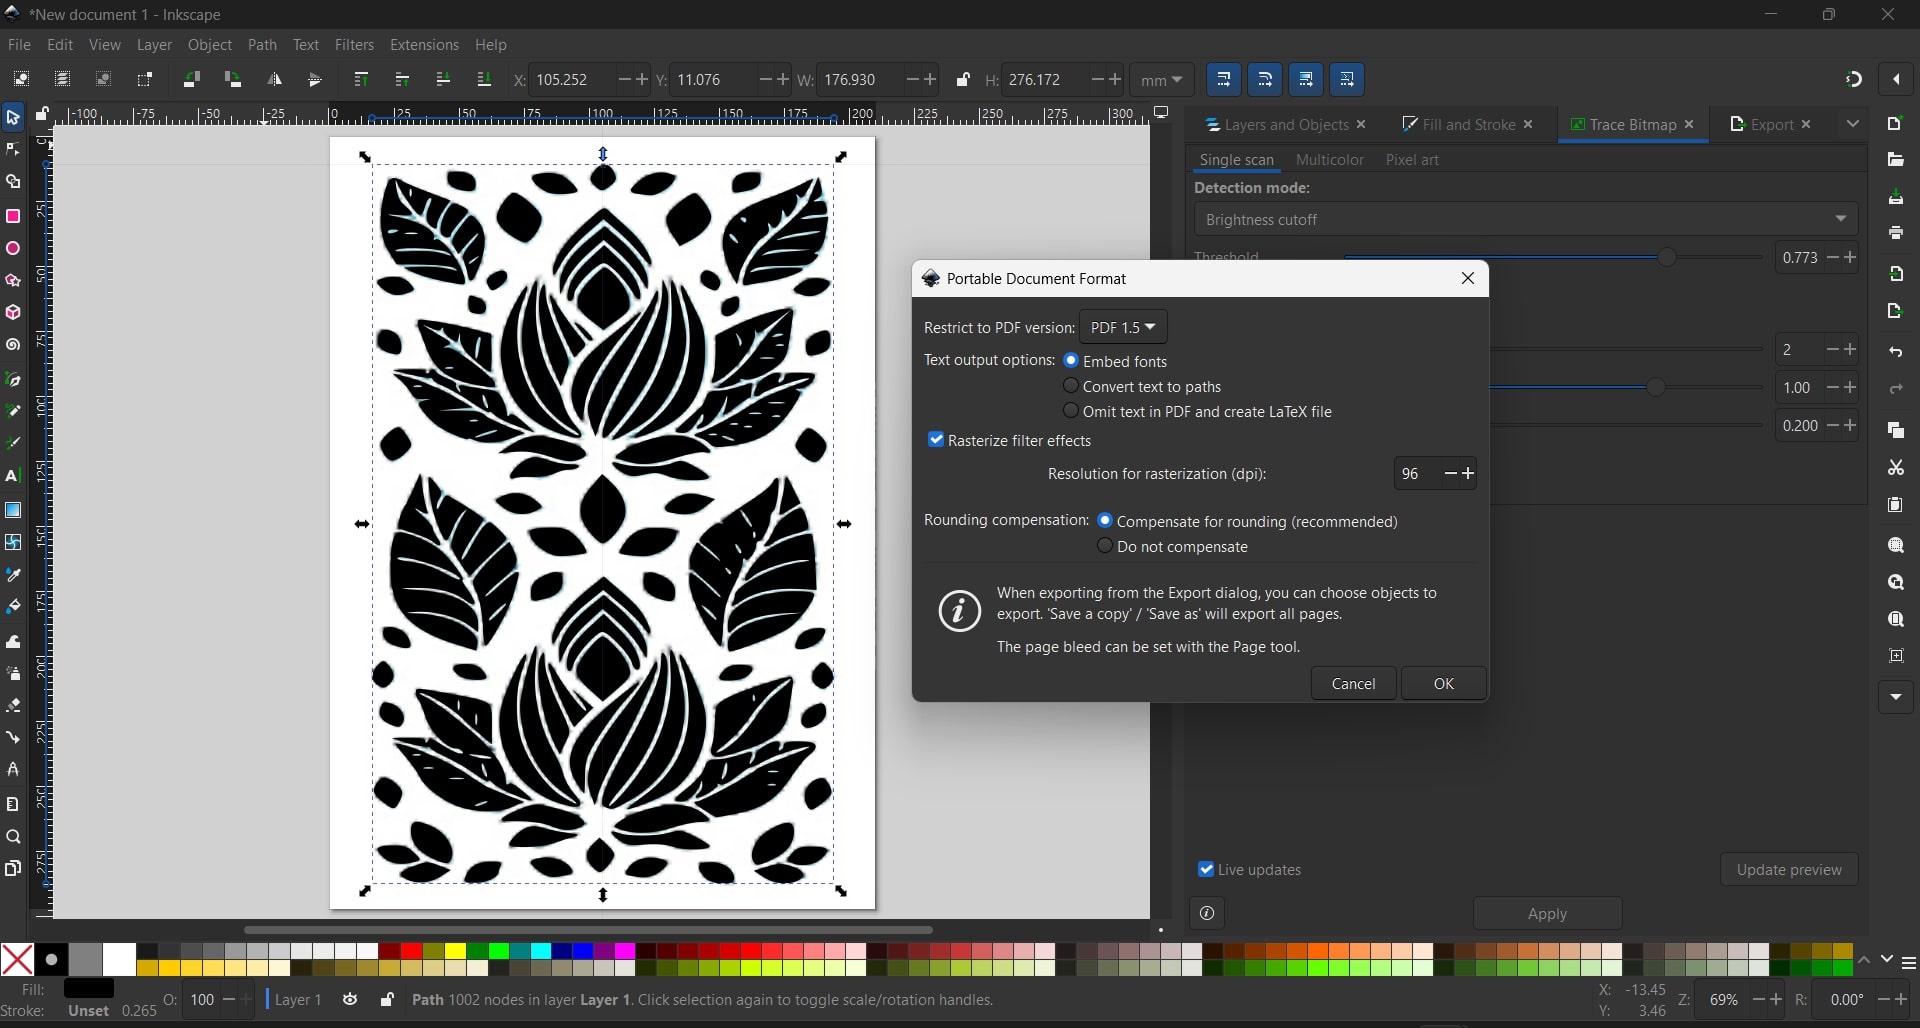
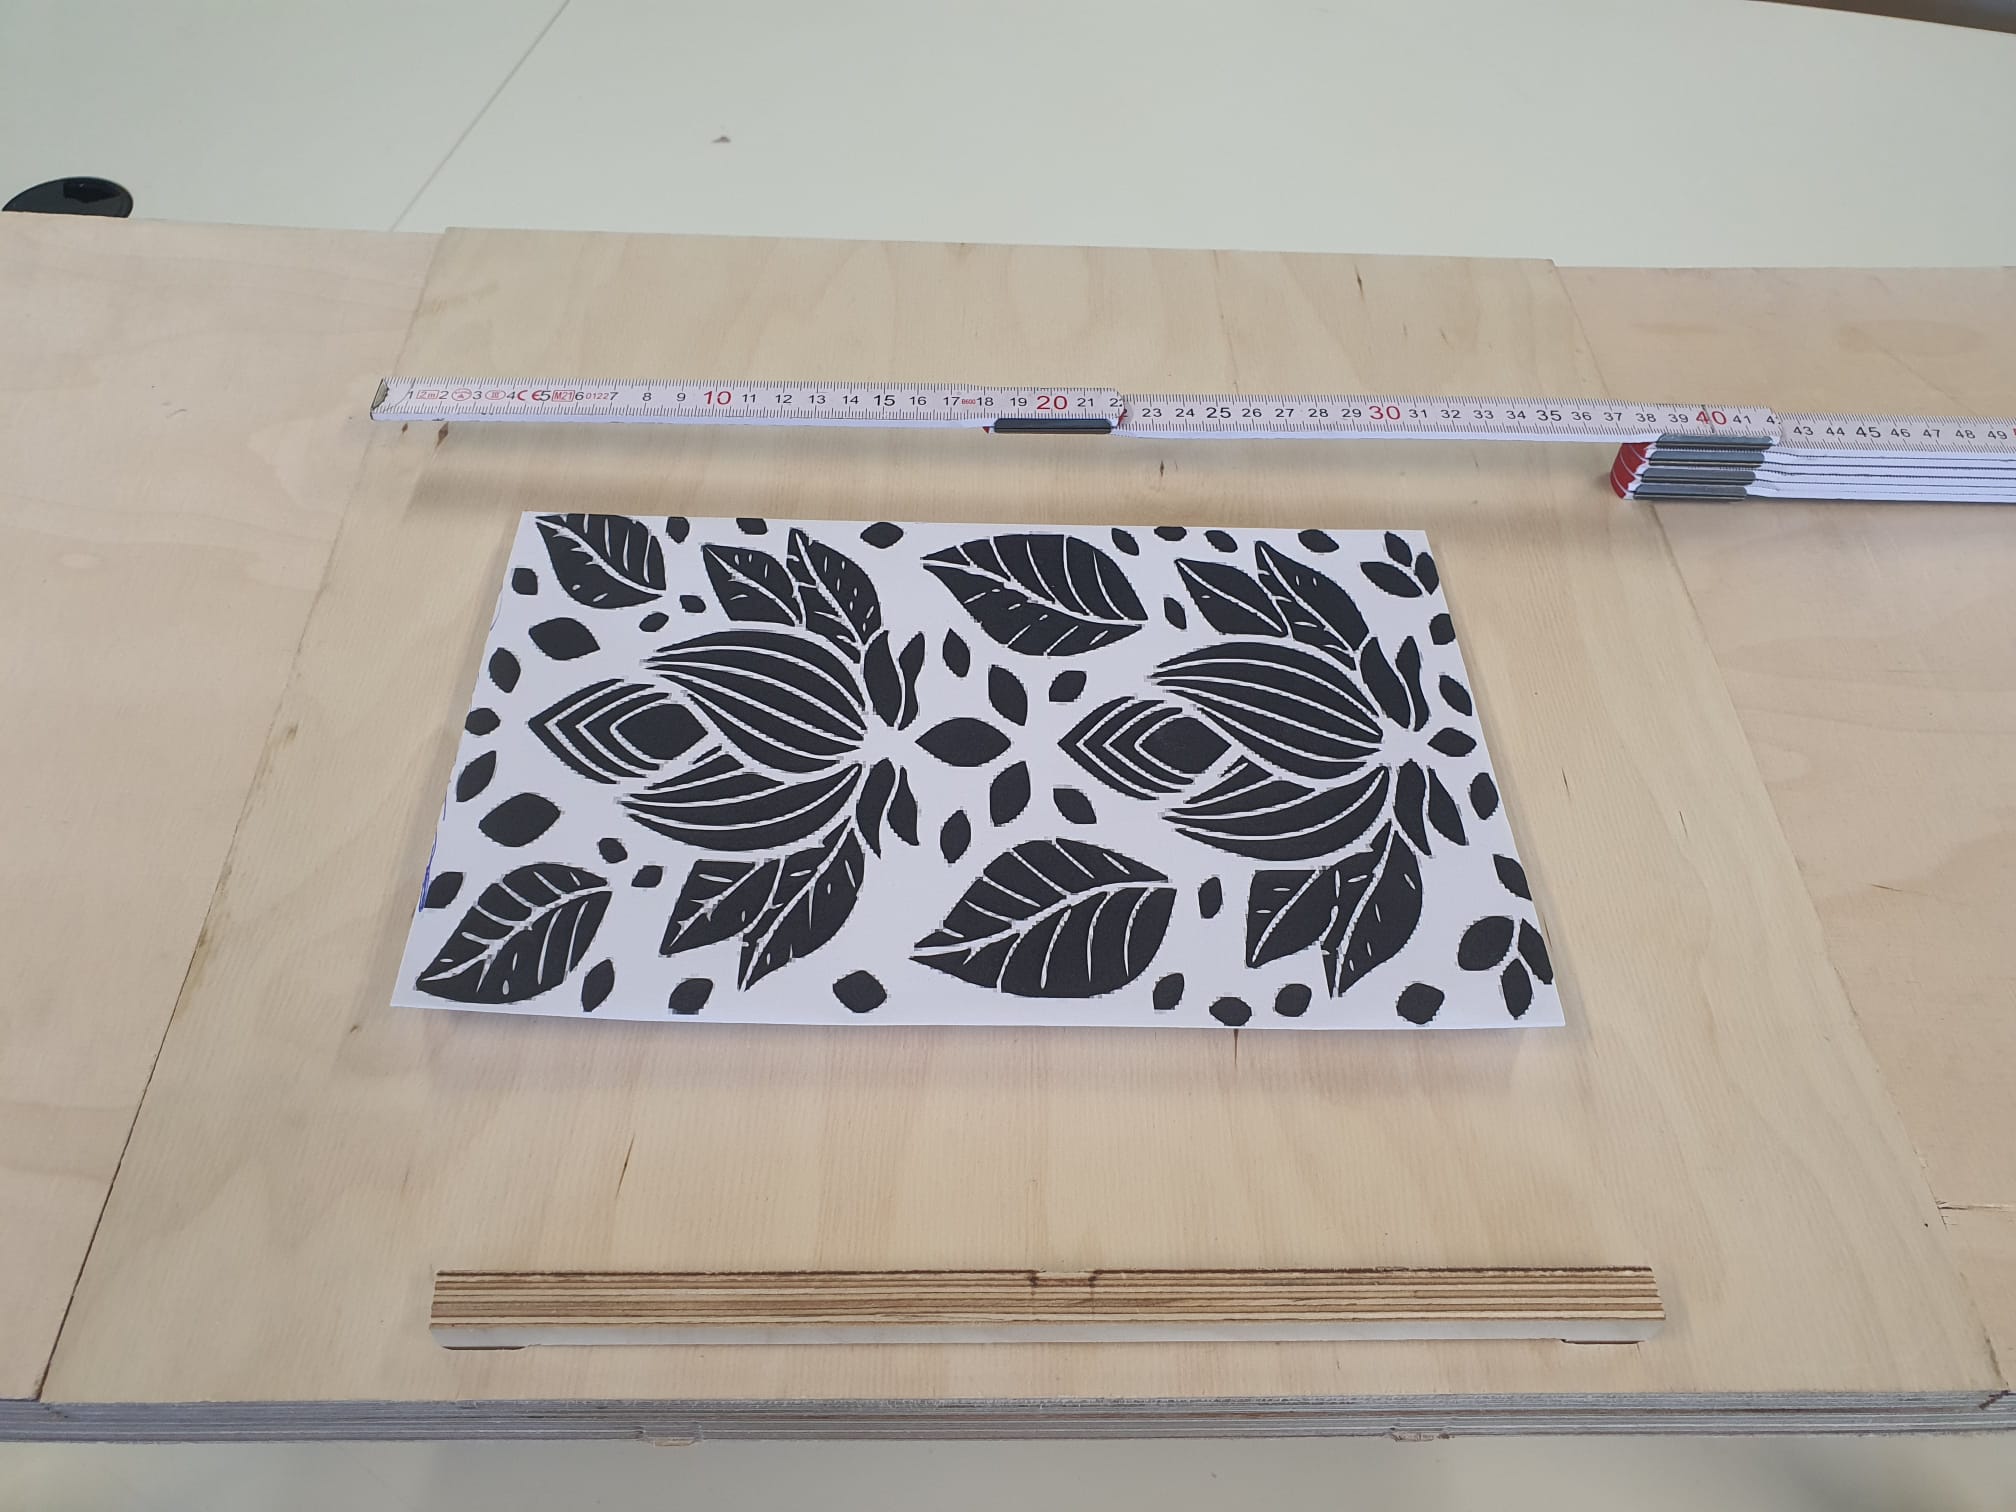
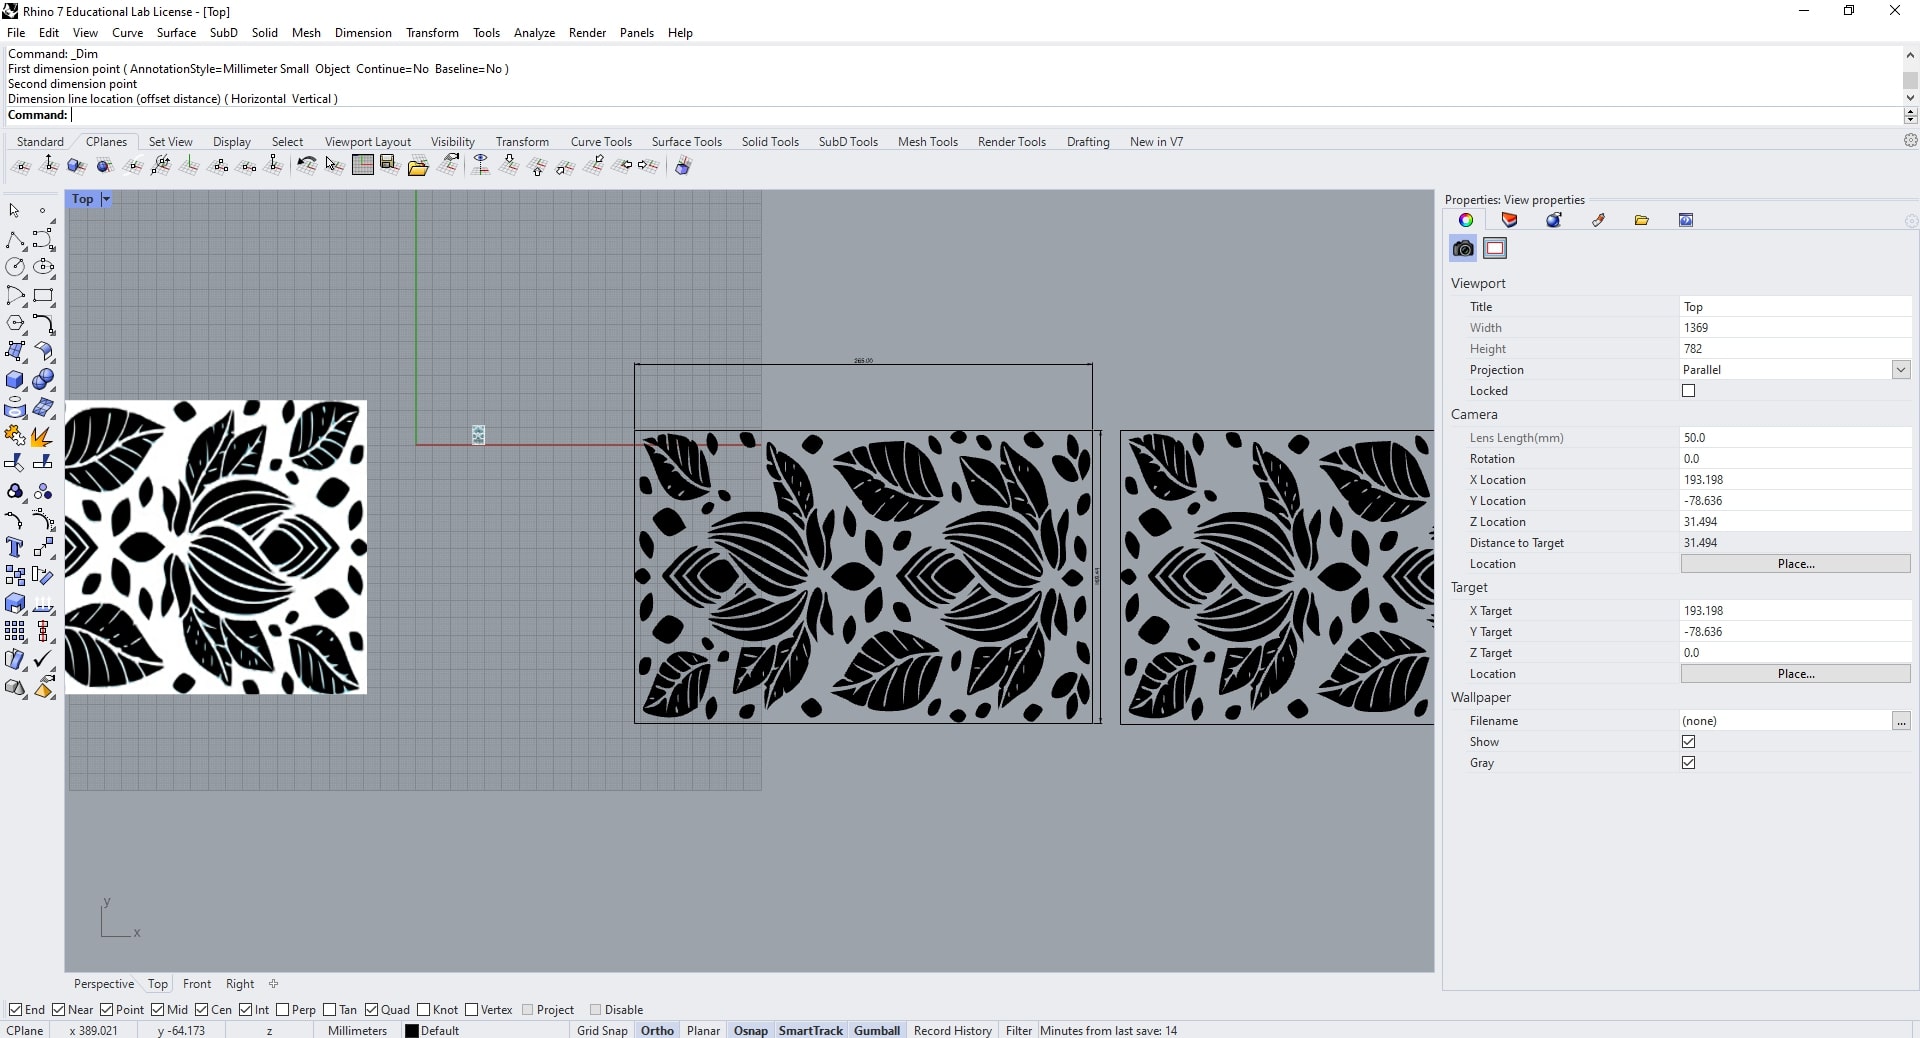
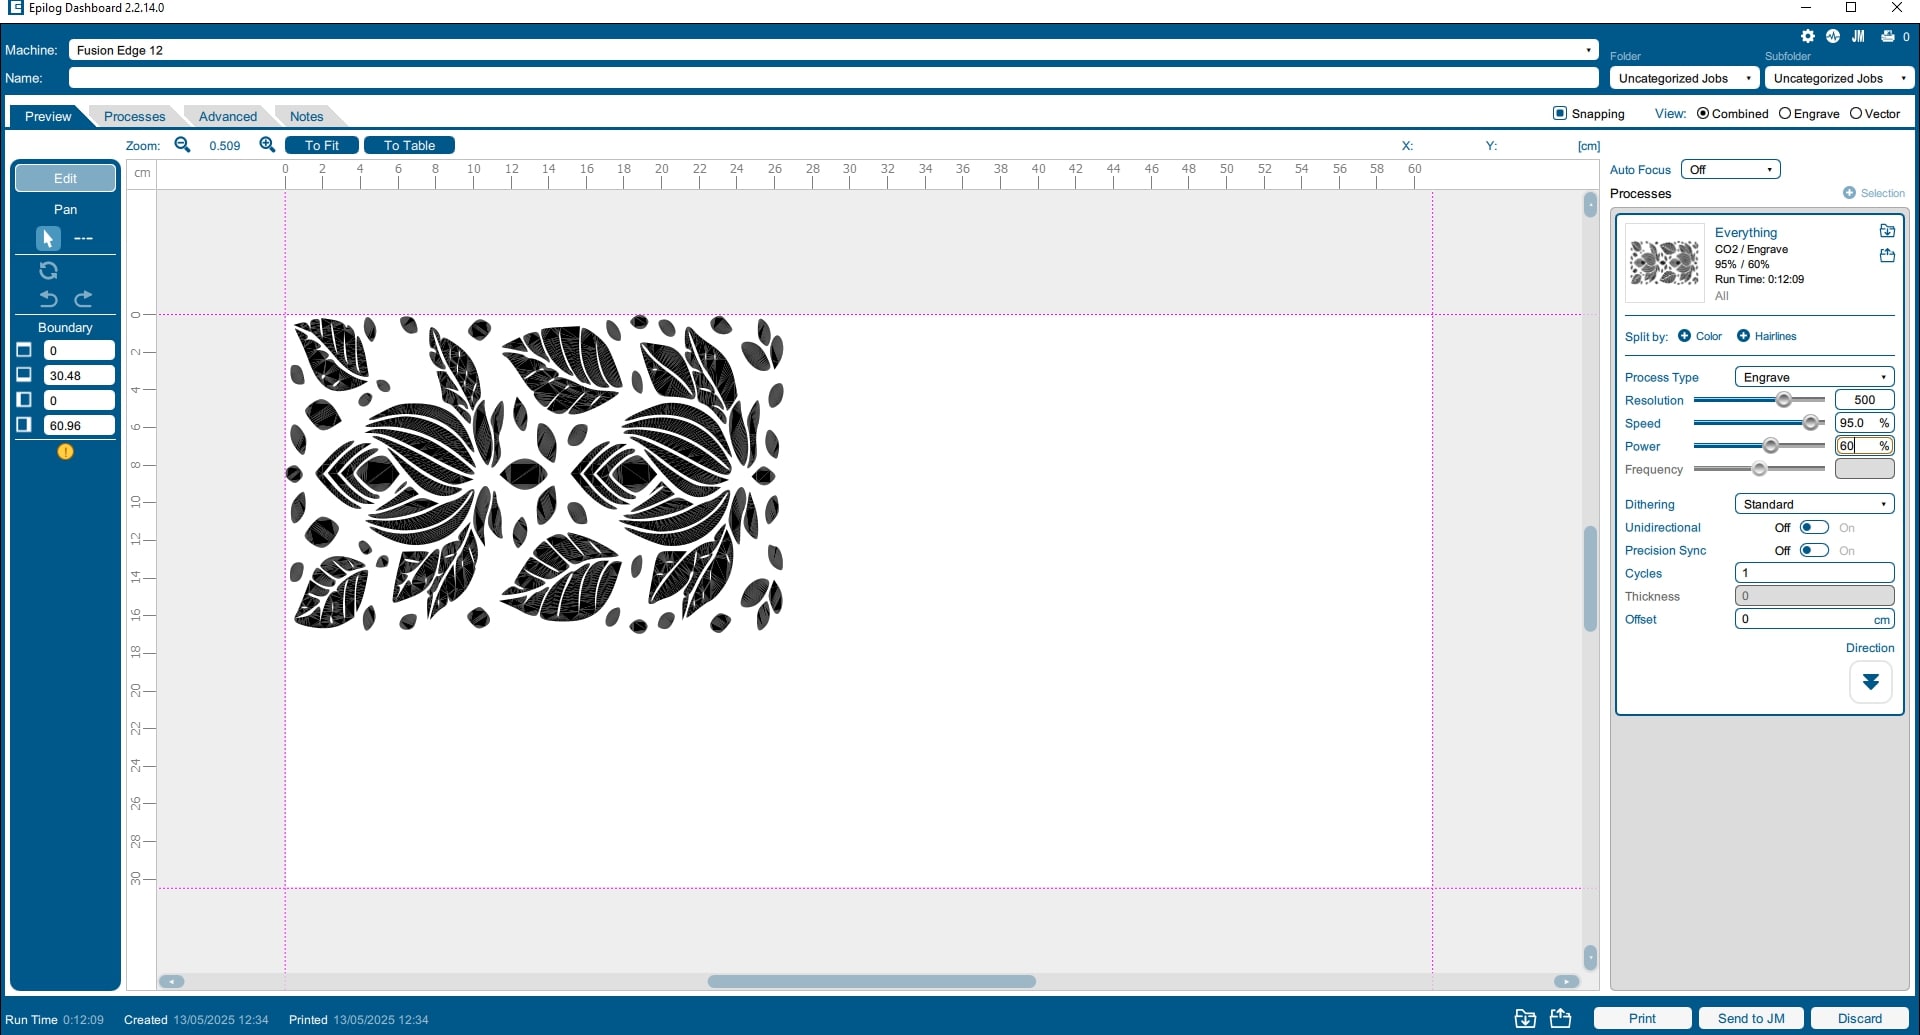
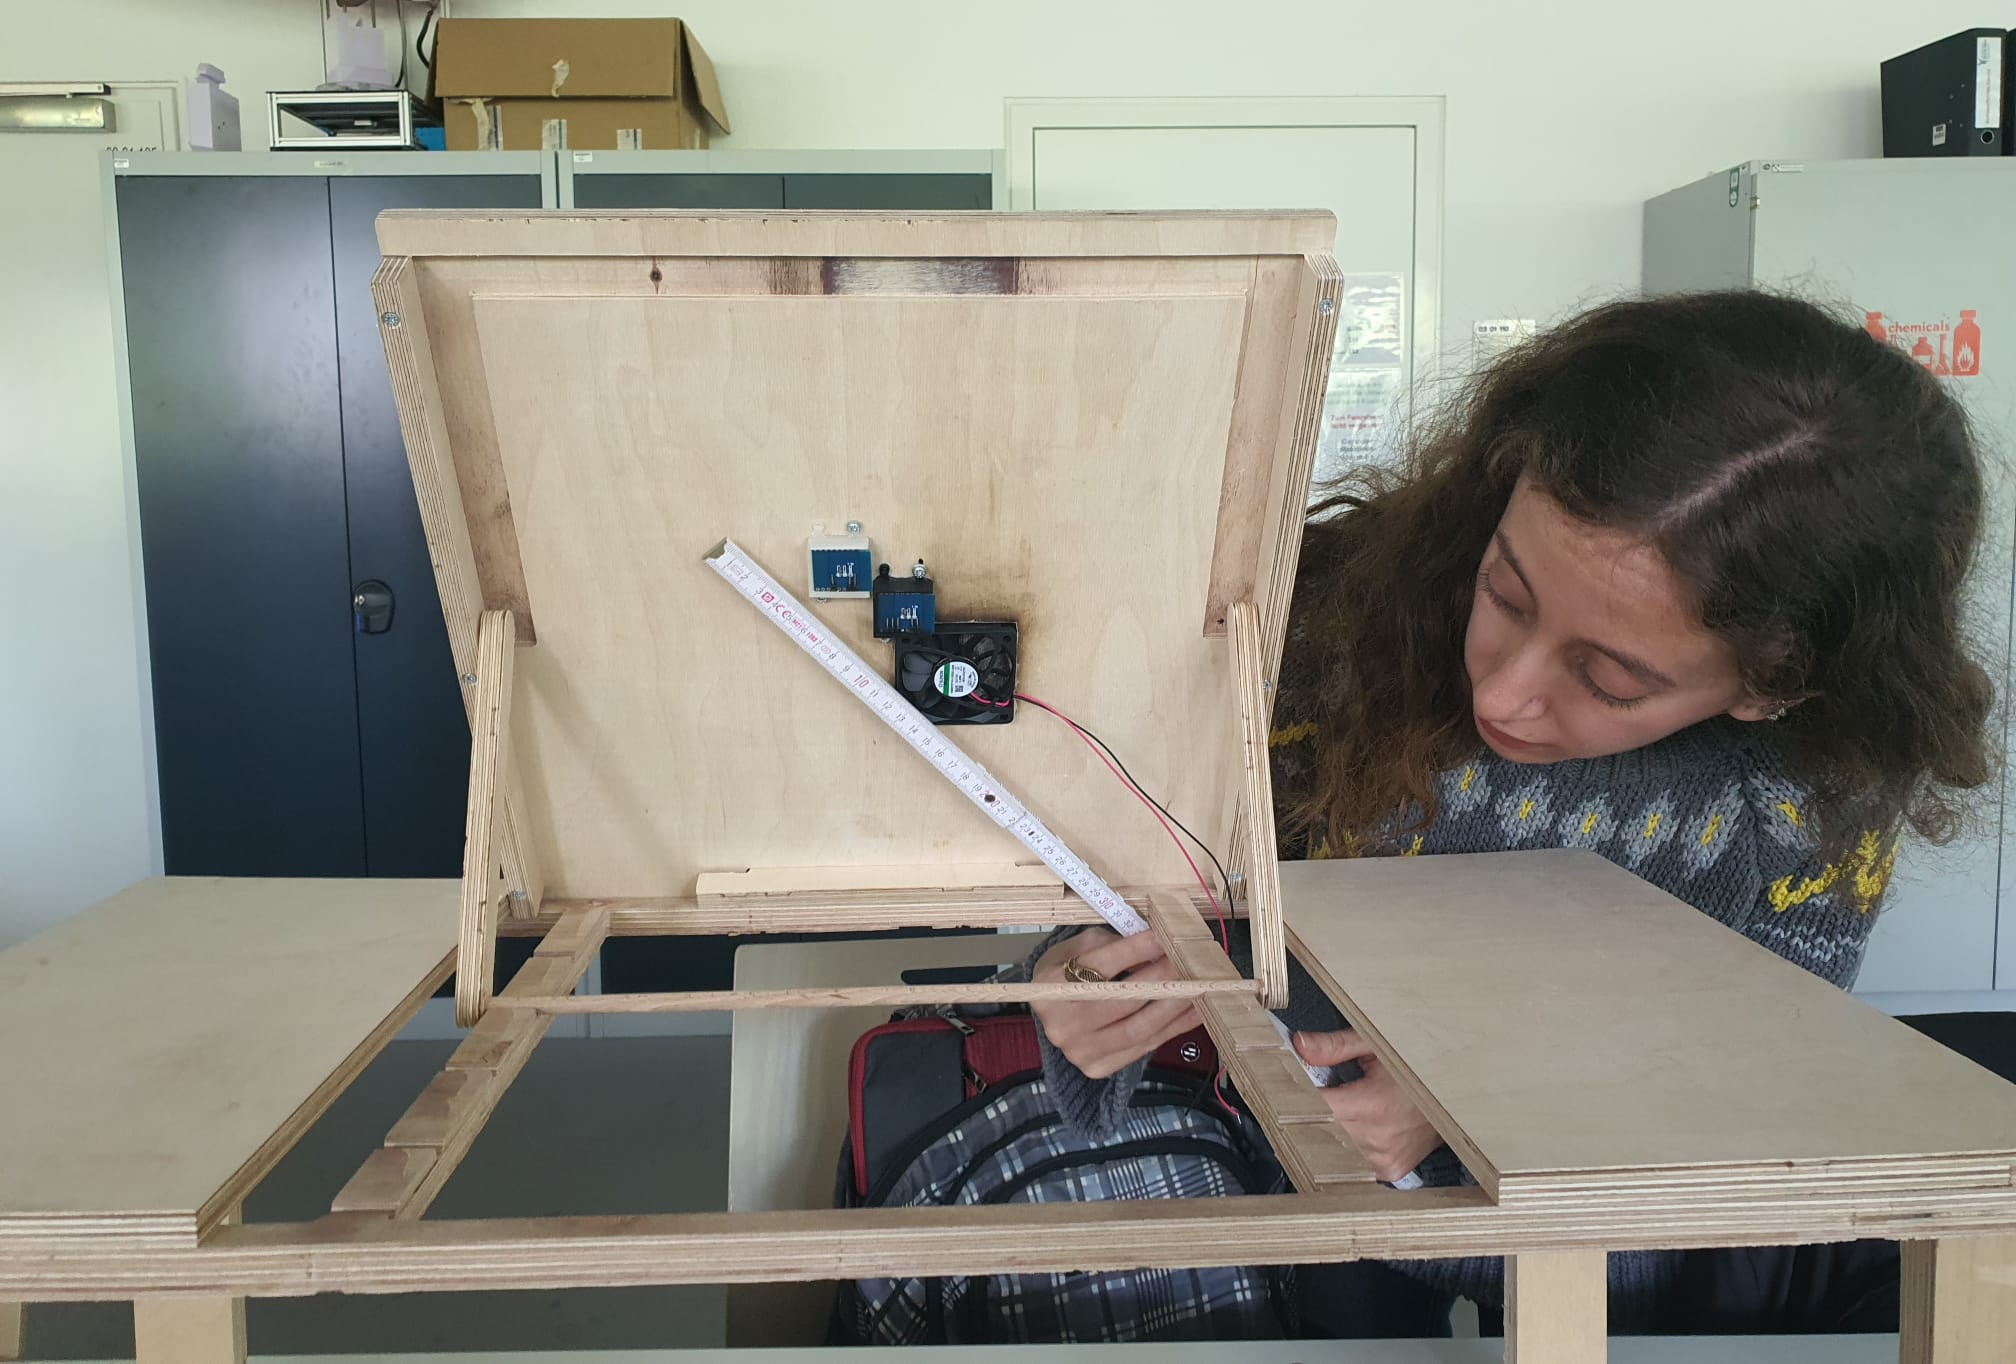
Engraving a Pattern and Drilling my Lap Table
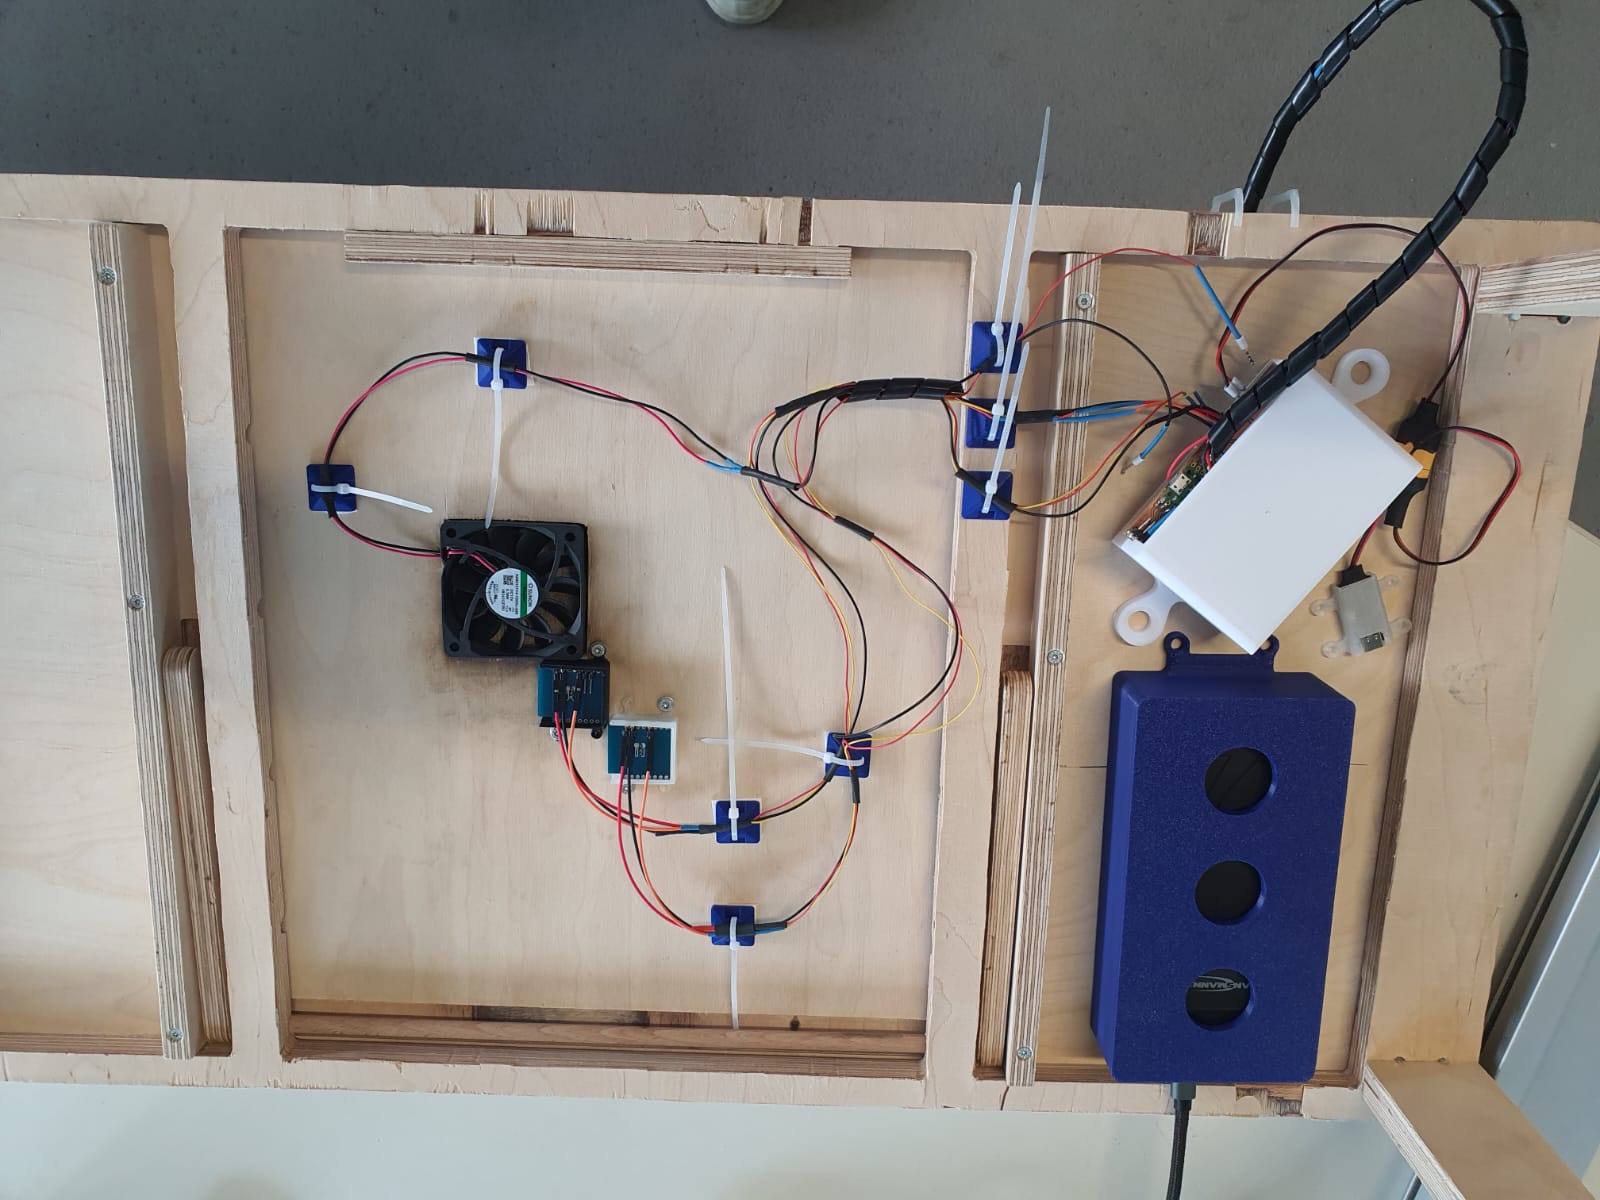
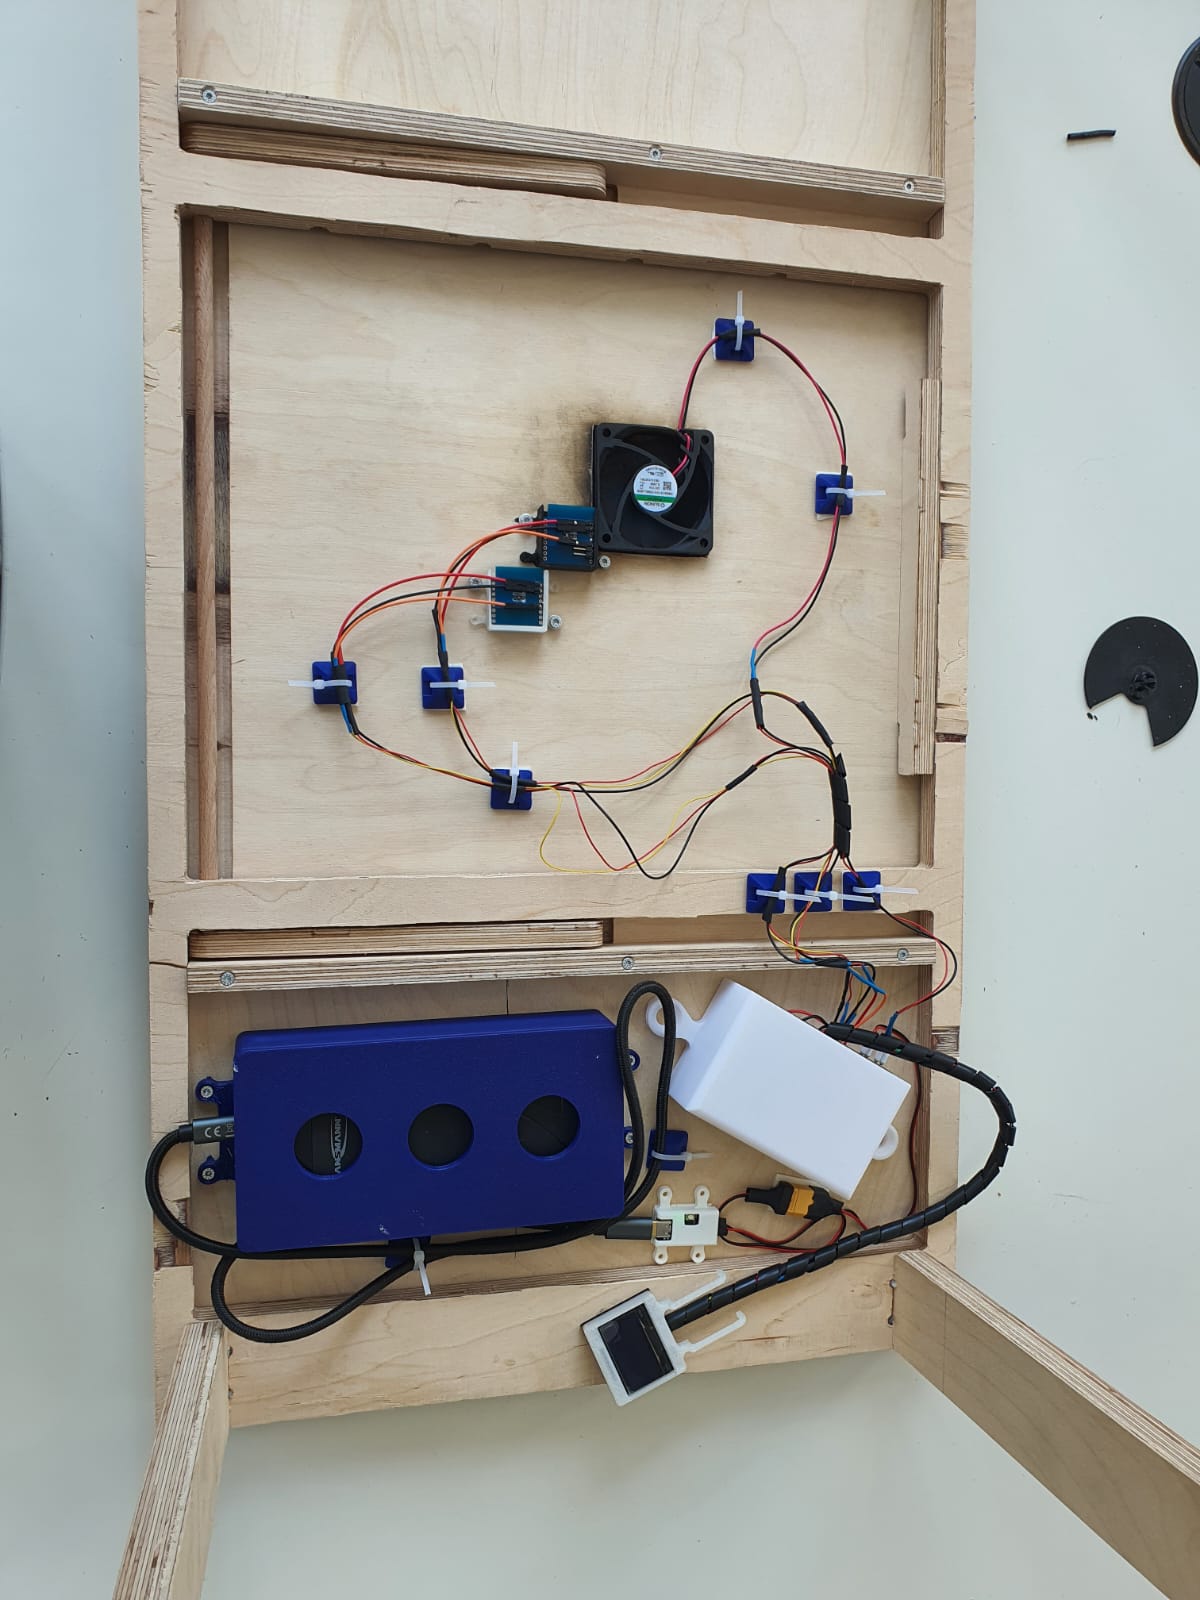
Progress on System Assembly - Week 16
Progress on Cable Management - Week 17
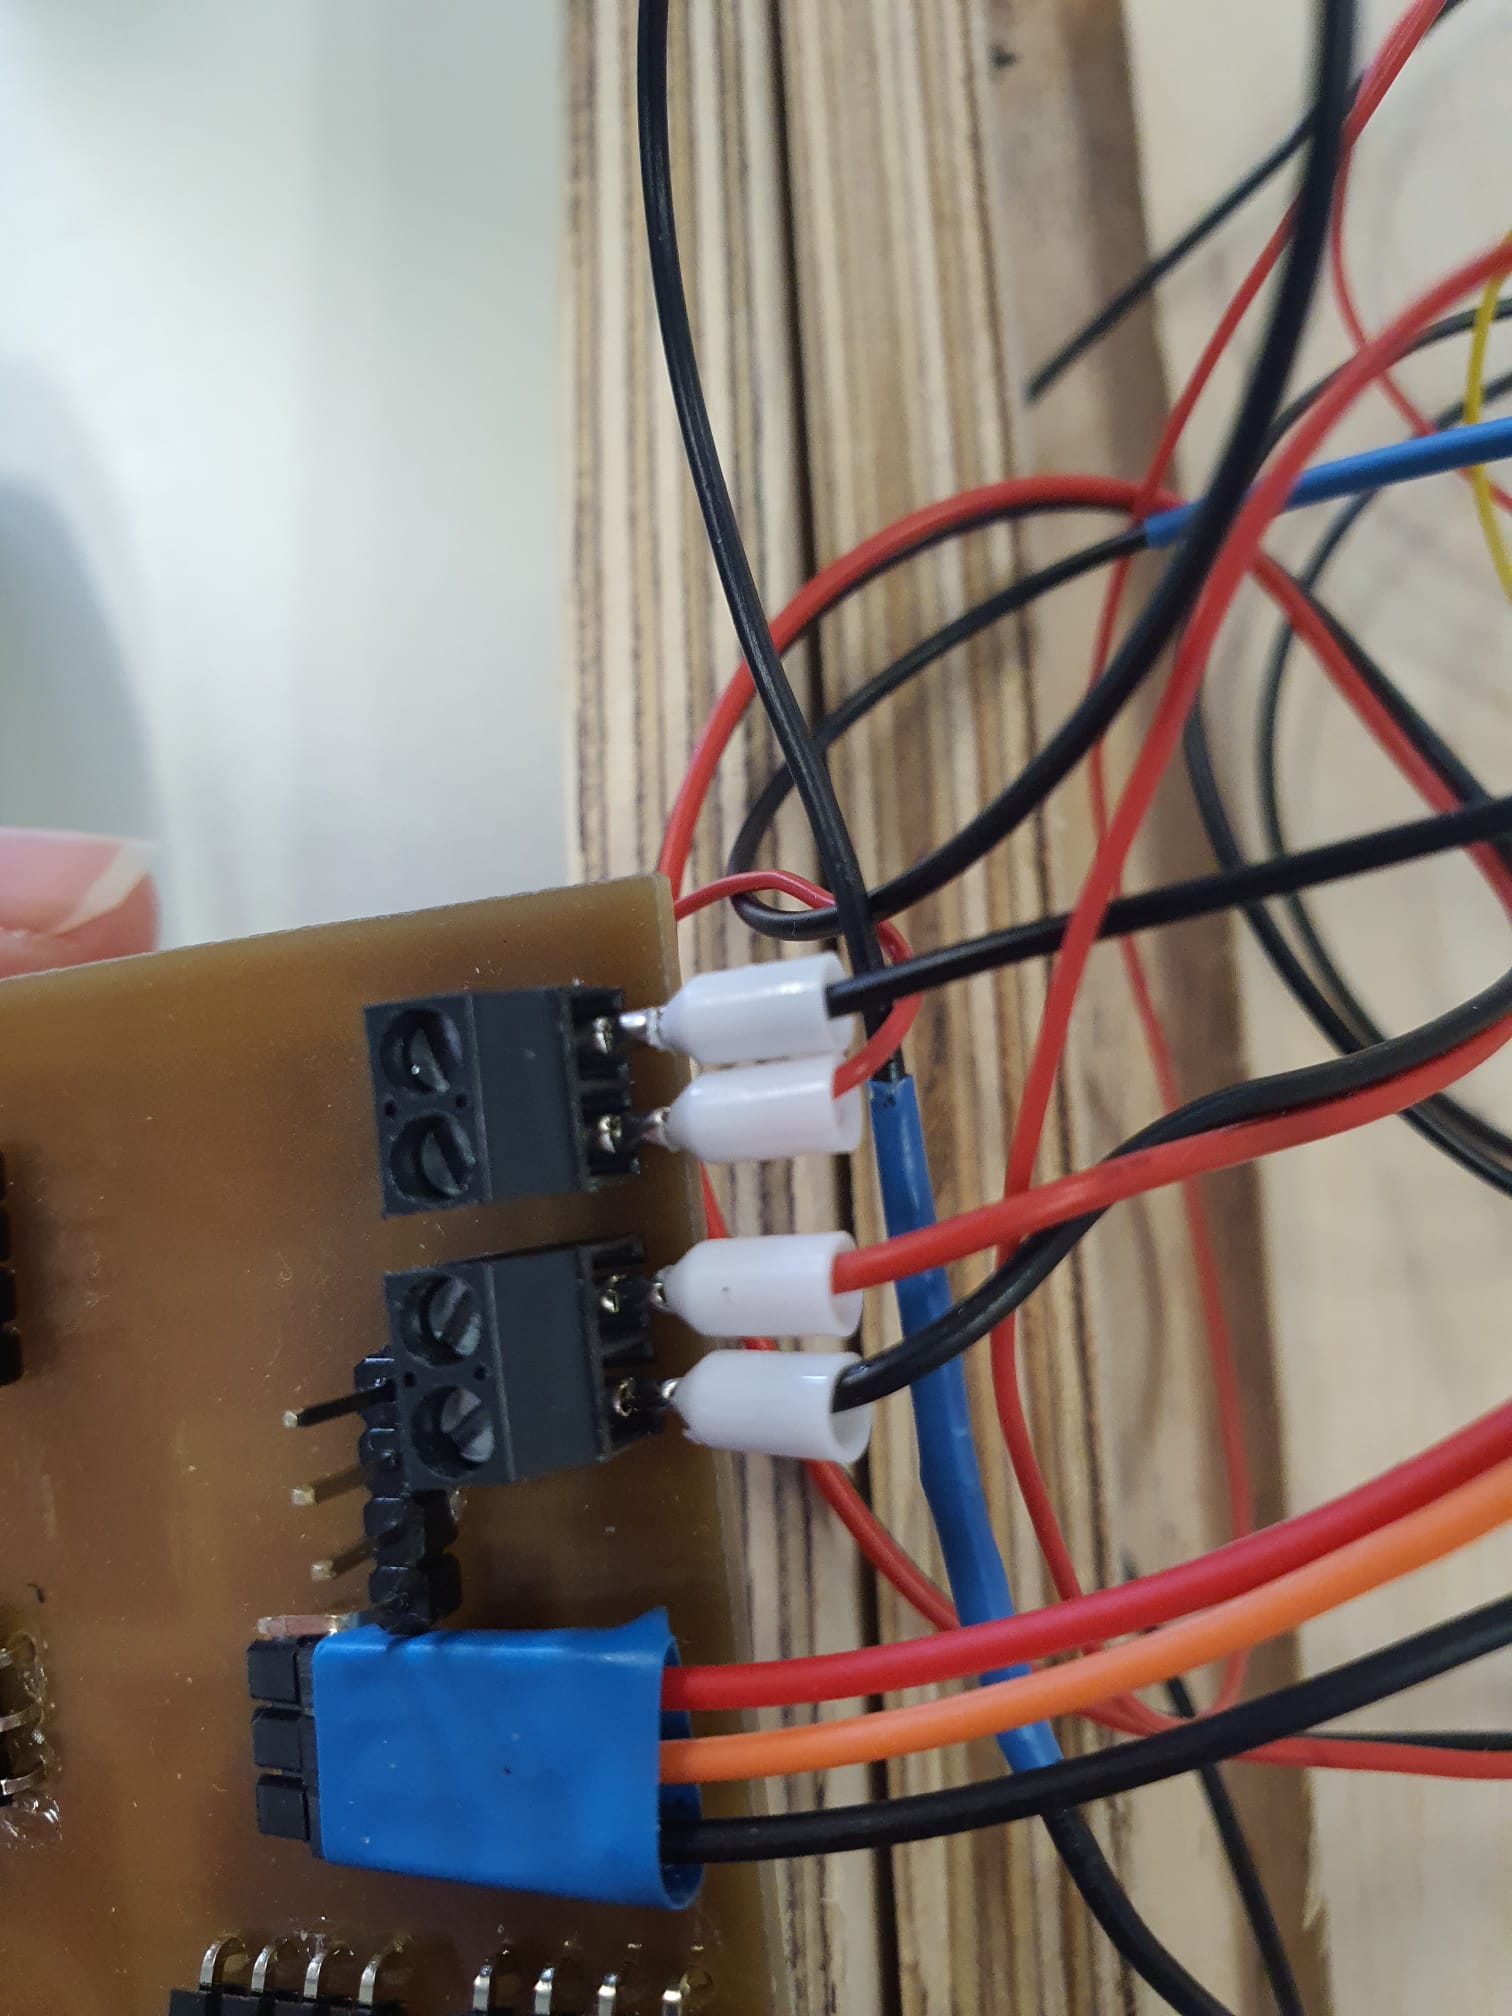
Printing Zip Tie Cable Holder
Creating UI Using Processing - Week 18
Prompt
- I attached both codes ("FinalFACodeDraft.ino"and
"GUIStripChart.pde") and wrote:
- "How do I integrate my Arduino sketch "FinalFACodeDraft.ino" into my Processing sketch "GUIStripChart.pde", so I can print on my screen using processing the fan speed and the mean temperature showing on the gauge? please createfor me a processing code for this reason!"
Processing Code
                                      /*
 -  Pi Pico 2 + two temperature sensors DS18B20 + fan
 -  Libraries used: Serial (built-in)  |  ControlP5 | Meter
 */

// Import Libraries
import processing.serial.*;   // built-in serial comms
import controlP5.*;           // ControlP5 GUI widgets
import meter.*;               // external Meter library

// Declare global objects
Serial    pico;               // declare Serial object 'pico' for Arduino connection
ControlP5 cp5;                // declare ControlP5 object 'cp5' for GUI controls
Meter     tempGauge;          // declare Meter object 'tempGauge' to display mean temperature

// define constants for minimum and maximum temperature values used in gauges and plots
final float MIN_T = 20;       // minimum temperature to display on gauge and plot
final float MAX_T = 50;       // maximum temperature to display on gauge and plot

// arrays to store historical temperature readings for two sensors (for strip chart)
float[] hist1 = new float[60]; // history buffer for sensor 1 readings (60 samples)
float[] hist2 = new float[60]; // history buffer for sensor 2 readings (60 samples)
int dataIndex = 0;             // index into history buffers, wraps around after reaching end

// variables to hold the latest readings received from Arduino
float currentMean = 0;         // latest computed mean temperature
float currentT1   = 0;         // latest sensor 1 temperature
float currentT2   = 0;         // latest sensor 2 temperature
int   currentFanSpeed = 0;     // latest fan speed percentage

boolean stream = true;         // flag controlling whether to update and draw live data

void setup() {
  size(900, 600);             // set window size to 900x600 pixels
  surface.setTitle("Temp & Fan Monitor"); // set the window title

  // Serial Setup
  println("Available serial ports:");      // print list header
  println(Serial.list());                  // list all available serial ports in console
  pico = new Serial(this, Serial.list()[0], 9600); // open first available port at 9600 baud
  pico.bufferUntil('\n');                 // buffer incoming serial data until newline arrives

  // ControlP5 Toggle
  cp5 = new ControlP5(this);               // initialize ControlP5 with this sketch
  cp5.addToggle("stream")                 // add a toggle button named 'stream'
     .setPosition(20, 20)                  // position toggle at x=20, y=20
     .setSize(50, 20)                      // set toggle width=50, height=20
     .setValue(true)                       // default value is true (streaming on)
     .setMode(ControlP5.SWITCH);           // set toggle mode to a switch

  // Meter Gauge Setup
  tempGauge = new Meter(this, width/2 - 200, 20); // create Meter centered horizontally, y=20
  tempGauge.setTitleFontName("Arial Bold");      // set the font for the gauge title
  tempGauge.setTitleFontSize(20);                 // set the gauge title font size
  tempGauge.setTitle("Mean Temp (°C)");          // set gauge title text
  tempGauge.setMinInputSignal((int)MIN_T);         // set minimum input signal value on gauge
  tempGauge.setMaxInputSignal((int)MAX_T);         // set maximum input signal value on gauge
  tempGauge.setMinScaleValue((int)MIN_T);          // set minimum scale tick label
  tempGauge.setMaxScaleValue((int)MAX_T);          // set maximum scale tick label

  // Build and set scale labels every 2°C between MIN_T and MAX_T
  String[] labels = new String[(int)((MAX_T - MIN_T)/2) + 1]; // array for labels
  for (int i = 0; i < labels.length; i++) {       // loop through each label index
    labels[i] = nf(MIN_T + i*2, 0, 0);             // format number with no decimals
  }
  tempGauge.setScaleLabels(labels);                // apply the labels to the gauge

  tempGauge.setArcColor(color(60));                // set the arc color of the gauge
  tempGauge.setArcThickness(15);                   // set thickness of gauge arc
  tempGauge.setNeedleThickness(4);                 // set thickness of gauge needle
  tempGauge.setDisplayDigitalMeterValue(true);     // enable digital readout on gauge
}

void serialEvent(Serial s) {
  String line = trim(s.readStringUntil('\n')); // read newline-terminated data, then trim whitespace
  if (line == null || line.length() == 0) return; // ignore empty or null lines

  // expect a line formatted as "mean;t1;t2;fanSpeed"
  String[] parts = split(line, ';');          // split the line into parts by semicolon
  if (parts.length == 4) {                    // only proceed if exactly four parts received
    currentMean     = parseFloat(parts[0]);  // parse part 0 as float for mean temperature
    currentT1       = parseFloat(parts[1]);  // parse part 1 as sensor 1 temperature
    currentT2       = parseFloat(parts[2]);  // parse part 2 as sensor 2 temperature
    currentFanSpeed = int(parseFloat(parts[3])); // parse part 3 as float then convert to int for fan speed

    // push new readings into history buffers at current dataIndex
    hist1[dataIndex] = currentT1;            // store t1 reading
    hist2[dataIndex] = currentT2;            // store t2 reading
    dataIndex = (dataIndex + 1) % hist1.length; // increment index with wrap-around
  } // end if correct parts
  // else: ignore malformed lines
}

void draw() {
  background(0);                              // clear the screen with black background

  if (stream) {                               // if streaming is enabled
    tempGauge.updateMeter(int(currentMean));  // update gauge needle to current mean temperature

    // display fan speed text underneath the gauge
    fill(255);                                // set fill color to white
    textAlign(CENTER, CENTER);                // center-align text both horizontally and vertically
    textSize(18);                             // set text size to 18
    text("Fan Speed: " + currentFanSpeed + "%",
         width/2 + 40,                      // x-position middle of the gauge
         height - 290);                         // y-position below the gauge
  } else {                                    // if streaming is disabled
    fill(255);                                // white text
    textAlign(CENTER, CENTER);                // centered text
    textSize(24);                             // larger text size for message
    text("Stream OFF", width/2, height/2 - 50); // display "Stream OFF" message
  }

  // always draw the strip-chart of sensor histories
  drawPlot();                                 // call helper to draw the time-series plot
}

void drawPlot() {
  int plotTop    = 300;                       // y-coordinate for top of plot area
  int plotBottom = height - 40;               // y-coordinate for bottom of plot area
  int marginLeft = 60;                        // x-coordinate for left margin of plot
  float spacing  = float(width - marginLeft - 20) / (hist1.length - 1); // horizontal spacing between points

  // draw sensor 1 history in cyan
  stroke(0,255,255);                          // set stroke color cyan
  strokeWeight(2);                            // line thickness 2
  noFill();                                   // no fill for shape
  beginShape();                               // start shape for polyline
  for (int i = 0; i < hist1.length; i++) {    // iterate through history buffer
    int p = (dataIndex + i) % hist1.length;   // calculate wrapped index for circular buffer
    float x = marginLeft + i * spacing;      // compute x position
    float y = map(hist1[p], MIN_T, MAX_T, plotBottom, plotTop); // map temperature to y-coordinate
    vertex(x, y);                             // add vertex to shape
  }
  endShape();                                 // finish drawing polyline

  // draw sensor 2 history in salmon (offset by +0.5°C for clarity)
  stroke(255,102,102);                        // set stroke color salmon
  strokeWeight(2);                            // line thickness 2
  noFill();                                   // no fill
  beginShape();                               // start second polyline
  for (int i = 0; i < hist2.length; i++) {    // iterate through second history buffer
    int p = (dataIndex + i) % hist2.length;   // wrapped index
    float x = marginLeft + i * spacing;      // compute x-coordinate
    float y = map(hist2[p] + 0.5, MIN_T, MAX_T, plotBottom, plotTop); // map t2+0.5°C
    vertex(x, y);                             // add vertex
  }
  endShape();                                 // end second polyline

  // draw axes and labels
  stroke(200);                                // set stroke color light gray for axes
  strokeWeight(1);                            // thin line for axes
  line(marginLeft, plotTop, marginLeft, plotBottom); // draw y-axis
  noStroke();                                 // disable stroke for text
  fill(200);                                  // set fill color for text labels
  textAlign(RIGHT, CENTER);                   // align text right
  text(MIN_T + "°", marginLeft-5, plotBottom); // label bottom of y-axis
  text(MAX_T + "°", marginLeft-5, plotTop);    // label top of y-axis
  textAlign(LEFT, CENTER);                    // align sensor legend text left
  fill(0,255,255);                            // cyan for sensor 1 label
  text("Sensor 1", marginLeft+5, plotTop+10); // position label
  fill(255,102,102);                          // salmon for sensor 2 label
  text("Sensor 2", marginLeft+5, plotTop+30); // position label
}

// callback invoked by ControlP5 when the 'stream' toggle changes state
public void stream(boolean active) {
  stream = active;                            // update the streaming flag
}
Final Arduino IDE Code Version
Serial.print(';');
                               /*
 Leen Skaf 05/29/2025
//
This work may be reproduced, modified, distributed,
performed, and displayed for any purpose, but must
acknowledge this project. Copyright is retained and
must be preserved. The work is provided as is; no
warranty is provided, and users accept all liability.
//
//
The following code is a draft for my final project
- Drive a fan based on the mean temperature recorded by two DS18B20 temperature sensors
- To control the speed of the fan, it is mapped to the PWM range of 170 to 255, where a minimum temperature threshold is set and an increment of 20% speed increase corresponds to 1°C temperature increased
- Information about fan status and mean temperature is shown on an OLED01.3 display
//
*/
#include
#include
#include
#include

// I2C OLED Setup
#define I2C_ADDRESS 0x3C
#define SCREEN_WIDTH 128
#define SCREEN_HEIGHT 64

// Initialize the OLED display using the default I2C bus (Wire)
Adafruit_SH1106G display(SCREEN_WIDTH, SCREEN_HEIGHT, &Wire);

// DS18B20 Temperature Sensors
// Sensors are connected to GPIO26 and GPIO27
MicroDS18B20<26> sensor1;
MicroDS18B20<27> sensor2;

// LED and Fan Definitions
#define LED_PIN 22   // LED to indicate temperature threshold
#define FAN_PIN 16   // DC fan controlled via PWM

// Temperature thresholds for fan control:
const float tempThreshold = 22.0;  // Fan starts running at 22°C
const float maxTempForFan = 26.0;    // Fan reaches 100% speed at 27°C

// Global variable to track when the fan turns on (in m illiseconds)
unsigned long fanOnStartTime = 0;

void setup() {
  //delay(2000);
  Serial.begin(9600);

  // Initialize I2C bus
  Wire.begin();

  // Initialize the OLED display; if not found, pause execution
  if (!display.begin(I2C_ADDRESS, true)) {
    Serial.println(F("OLED not found"));
    while (1);
  }

  // Configure the LED and Fan pins as outputs
  pinMode(LED_PIN, OUTPUT);
  pinMode(FAN_PIN, OUTPUT);
  // Display a startup message
  display.clearDisplay();
  display.setTextSize(2);
  display.setTextColor(SH110X_WHITE);
  display.setCursor(0, 10);
  display.println("Starting...");
  display.display();
  //delay(2000);
}

void loop() {
  // Request temperature readings from both sensors
  sensor1.requestTemp();
  sensor2.requestTemp();

  // Wait for conversion.
  delay(1000);

  // Variables to hold temperature values and sensor status
  float temp1 = 0, temp2 = 0;
  bool sensor1_ok = false, sensor2_ok = false;

  // Read sensor1.
  if (sensor1.readTemp()) {
    temp1 = sensor1.getTemp();
    sensor1_ok = true;
  } else {
    Serial.println("Error reading sensor1");
  }

  // Read sensor2.
  if (sensor2.readTemp()) {
    temp2 = sensor2.getTemp();
    sensor2_ok = true;
  } else {
    Serial.println("Error reading sensor2");
  }

  // Validate sensor data.
  bool validData = sensor1_ok && sensor2_ok;
  float meanTemp = 0;

  if (validData) {
    meanTemp = (temp1 + temp2) / 2.0;

  } else {
    Serial.println("Cannot compute mean: one or more sensor readings failed.");
  }

  // Variables for fan control.
  bool fanOn = false;
  int fanSpeedPercent = 0;
  int pwmValue = 0;  // PWM value (0 - 255)

  // Only control the fan if sensor data is valid
  if (validData && (meanTemp >= tempThreshold)) {
    digitalWrite(LED_PIN, HIGH);  // Turn on LED

    // Calculate fan speed percentage based on temperature between threshold and maxTempForFan
    if (meanTemp >= maxTempForFan) {
      fanSpeedPercent = 100;
    } else {
      fanSpeedPercent = (int)(((meanTemp - tempThreshold) / (maxTempForFan - tempThreshold)) * 100);
    }


    // Map the fan speed percentage to PWM value in the range 170 to 255
    pwmValue = map(fanSpeedPercent, 0, 100, 170, 255);
    analogWrite(FAN_PIN, pwmValue);
    fanOn = true;

    // Record fan activation time if it just started
    if (fanOnStartTime == 0) {
      fanOnStartTime = millis();
    }
  } else {
    digitalWrite(LED_PIN, LOW);   // Turn off LED
    analogWrite(FAN_PIN, 0);        // Turn off fan
    fanSpeedPercent = 0;
    fanOnStartTime = 0;
  }

  // Send mean; temp1; temp2; fanSpeed%  to Processing:
  Serial.print(meanTemp);
  Serial.print(';');
  Serial.print(temp1);
  Serial.print(';');
  Serial.print(temp2);
  Serial.print(';');
  Serial.println(fanSpeedPercent);

  // Update the OLED display.
  display.clearDisplay();
  display.setTextSize(2);
  display.setCursor(0, 0);

  if (validData) {
    // First line: Mean temperature with unit Celcius degrees
    display.print("Mean:");
    display.print(meanTemp, 1);
    display.print("C");

    // Second line: Fan status/speed
    display.setTextSize(2);
    display.setCursor(0, 35);
    if (fanOn) {
      // For the first 2 seconds, display "Fan: ON"
      if (millis() - fanOnStartTime < 2000) {
        display.println("Fan: ON");
      } else {
        display.print("Speed:"); //Afterwards show the fan speed percentage
        display.print(fanSpeedPercent);
        display.println("%");
      }
    } else {
      display.println("Fan: OFF");
    }
  } else {
    display.println("Sensor error");
  }

  display.display();
  delay(1000);
}


// References:

//
// Adafruit Industries. (2025). Adafruit GFX graphics library. GitHub.
// Retrieved March 27, 2025, from https://github.com/adafruit/Adafruit-GFX-Library
//
// Adafruit Industries. (2025). Adafruit SH110X library. GitHub.
// Retrieved March 27, 2025, from https://github.com/adafruit/Adafruit_SH110X
//
// Arduino. (n.d.). microDS18B20 library. Arduino Library documentation.
// Retrieved April 8, 2025, from https://docs.arduino.cc/libraries/microds18b20
//
// Arduino. (2025). analogWrite() function. Arduino Documentation.
// Retrieved March 29, 2025, from https://docs.arduino.cc/language-reference/en/functions/analog-io/analogWrite
//
// Wright, J. (2021). microDS18B20 library. GitHub.
// Retrieved March 27, 2025, from https://github.com/jwright235/microDS18B20
//
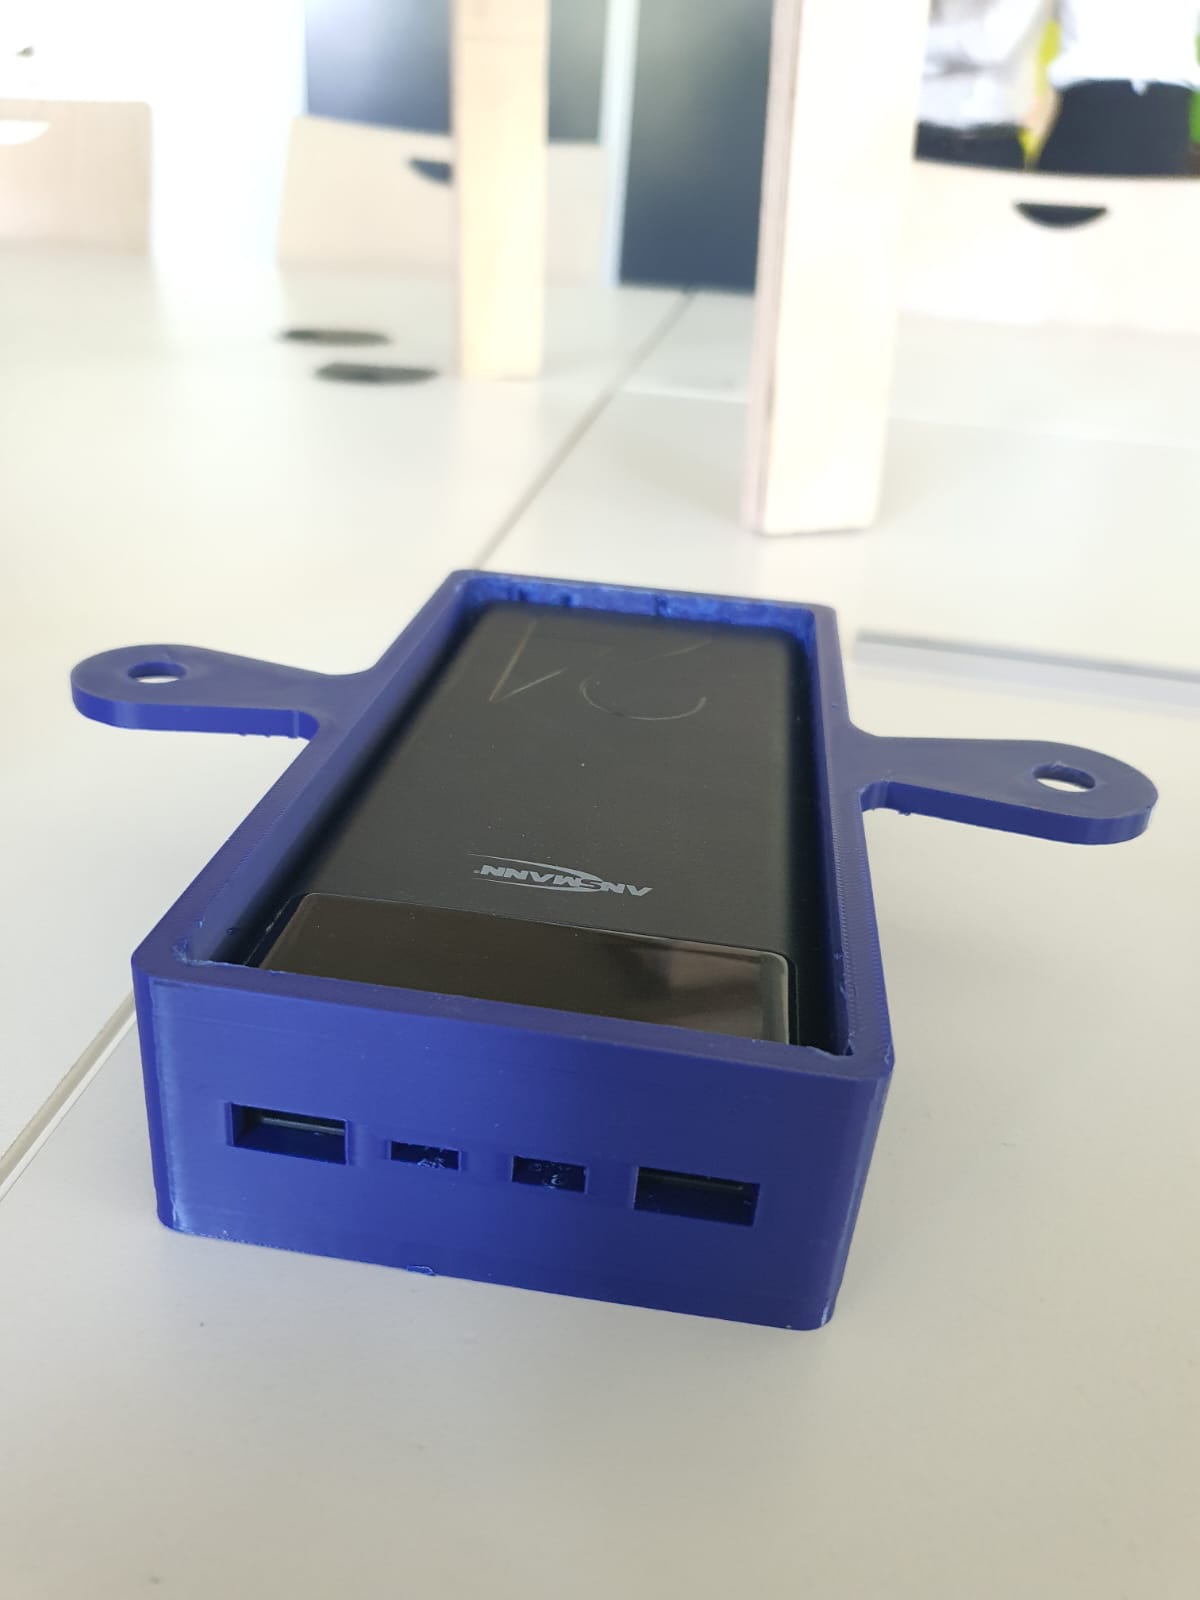
Fixating Powerbank, PCB, and PD Module Housings
Final Bottom View of my Lap Table
Final 360° View of my Lap Table
Final Reflection
Materials
| Qty | Description | Price | Link |
|---|---|---|---|
| one | Raspberry Pi Pico W | 6.99€ | Raspberry Pi Pico W |
| one | MOSFET SOT-23 | 0.37€ | MOSFET |
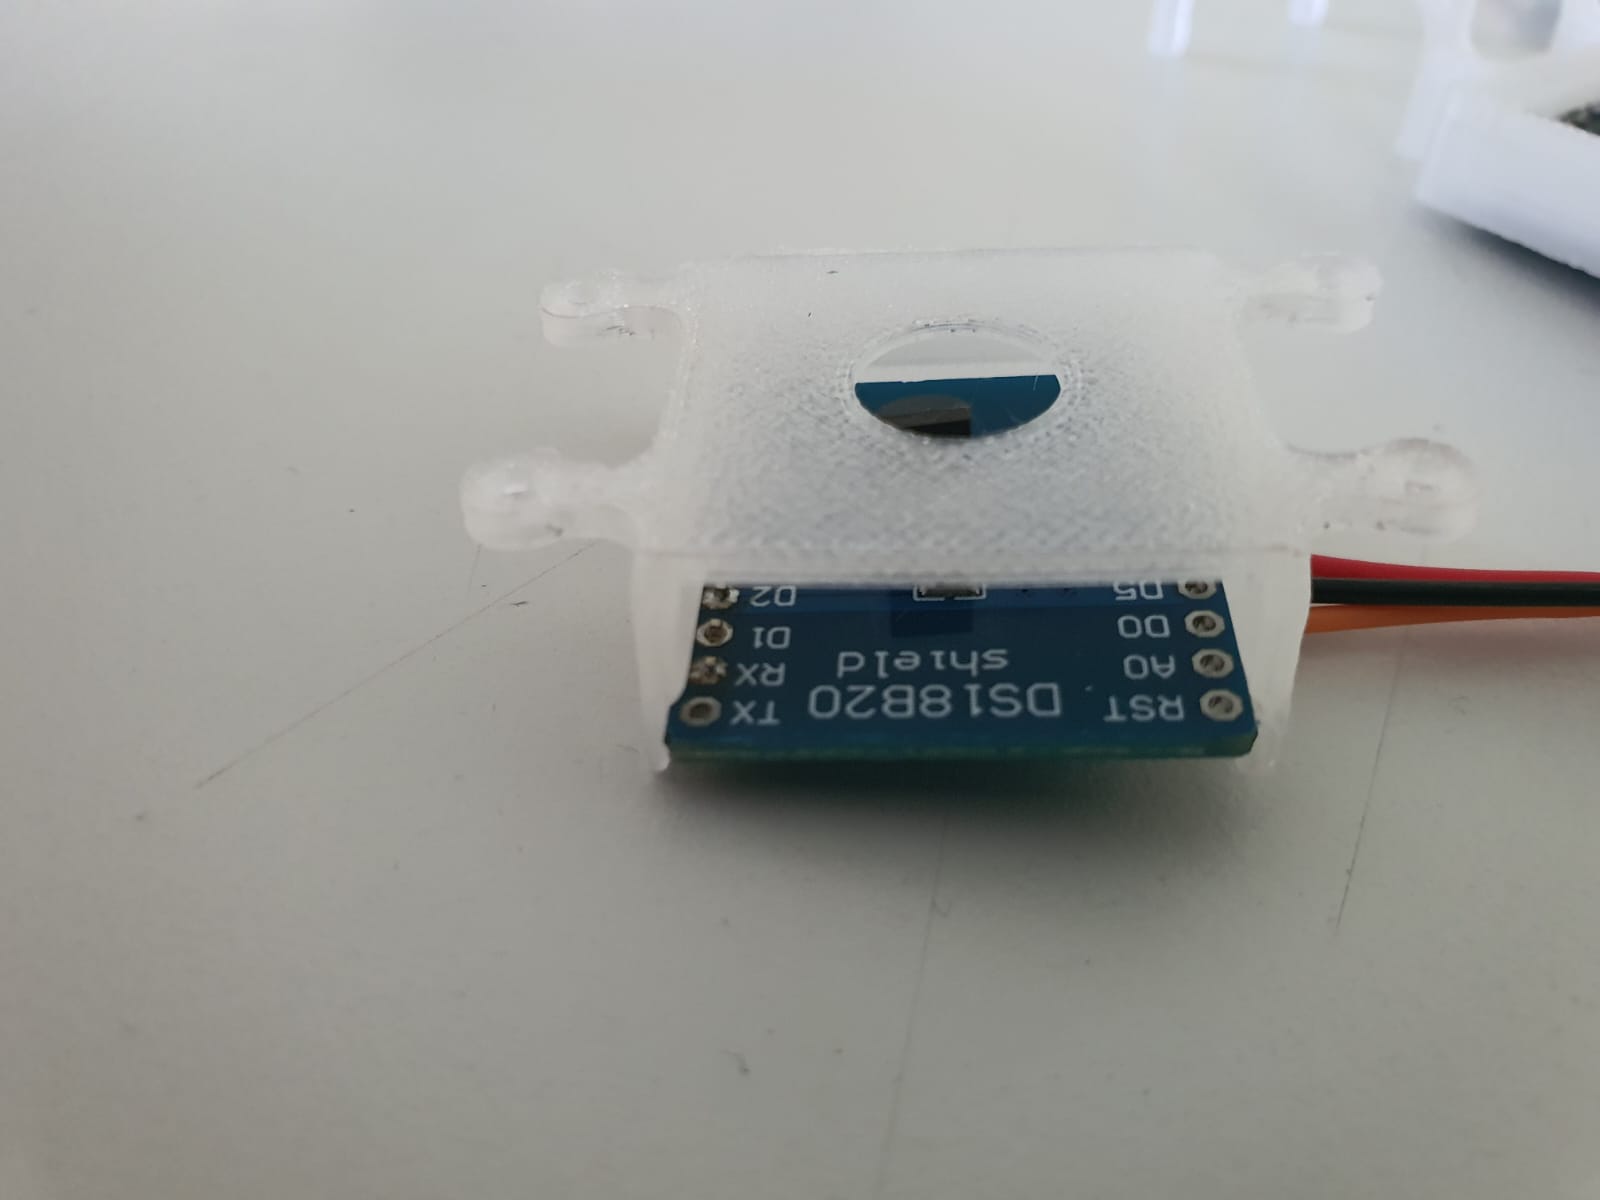
| two | DS18B20 Temperature Sensor Module | 2.40 € | DS18B20 shield |
| one | Diode SOD123 | 0.25€ | SOD123 Diode |
| one | SBC-OLED01.3 | 10.50€ | SBC-OLED01.3 |
| one | 60x60x15mm / 12V / 0,026A Fan | 2.60€ | DC 12V Fan |
| one | USB PD (Power Delivery) trigger module | 11.20€ | USB PD (Power Delivery) trigger module |
| one | Verbatim PLA Filament 1.75mm 1 kg - Blue | ~ 1.36 € (68.1 g × 19.95 €/ 1000 g) | |
| one | Verbatim PLA Filament 1.75mm 1 kg - Black | ~ 1.36 € (68.1 g × 19.95 €/ 1000 g) | |
| one | Verbatim PLA Filament 1.75mm 1 kg - White | ~ ~ 1.36 € (68.1 g × 19.95 €/ 1000 g) | |
| one | 900 mm × 600 mm × 24 mm (0.54 m²) Plywood | ~ 60 € (Rail base) | Note: This was the last piece at the store Hagebau Kleve, hence, there is no version of it online |
| one | 600 mm × 1200 mm × 18 mm (0.72 m²) Plywood | ~ 8.33 € (legs → 0.015 m² × 138.88 €/m² × 4) | |
| one | 600 mm × 1200 mm × 12 mm (0.72 m²) Plywood | ~ 25.87 € (table surface, stoppers and arms → 0.35152 m² × 73.60 €/m²) | |
| Total | 134.99 € |
Additional Resources:
- Adafruit GFX Graphics Library https://cdn-learn.adafruit.com/downloads/pdf/adafruit-gfx-graphics-library.pdf
- MicroDS18B20 Arduino Library https://docs.arduino.cc/libraries/microds18b20/
- Adafruit SH110X Arduino Library https://docs.arduino.cc/libraries/adafruit-sh110x/
- Arduino analogWrite() Reference https://docs.arduino.cc/language-reference/en/functions/analog-io/analogWrite/
YouTube Tutorials:
- Testing NEW CNC Joint - Bed-Table Build
- DoveTail Half-Lap Joint
- Basic Wood Joinery- Eric Brennan
- Axminster Tools, 2023, Make a Folding Camping Table - Woodworking Wisdom
- KiCAD 7 PCB Layout in 5 steps
- KiCad 7 ESP32 PCB Design Full Tutorial - made by morten laboratories iot-thing
- Master New KiCad 7 In Under 2 Hours | #PCBCUPID
Files
- Final Arduino IDE Code
- FinalCode.ino
- Final Processing Code (UI)
- FinalCodeUI.pde
- LapTable version 2.0 Design
- LapTablev13.f3d
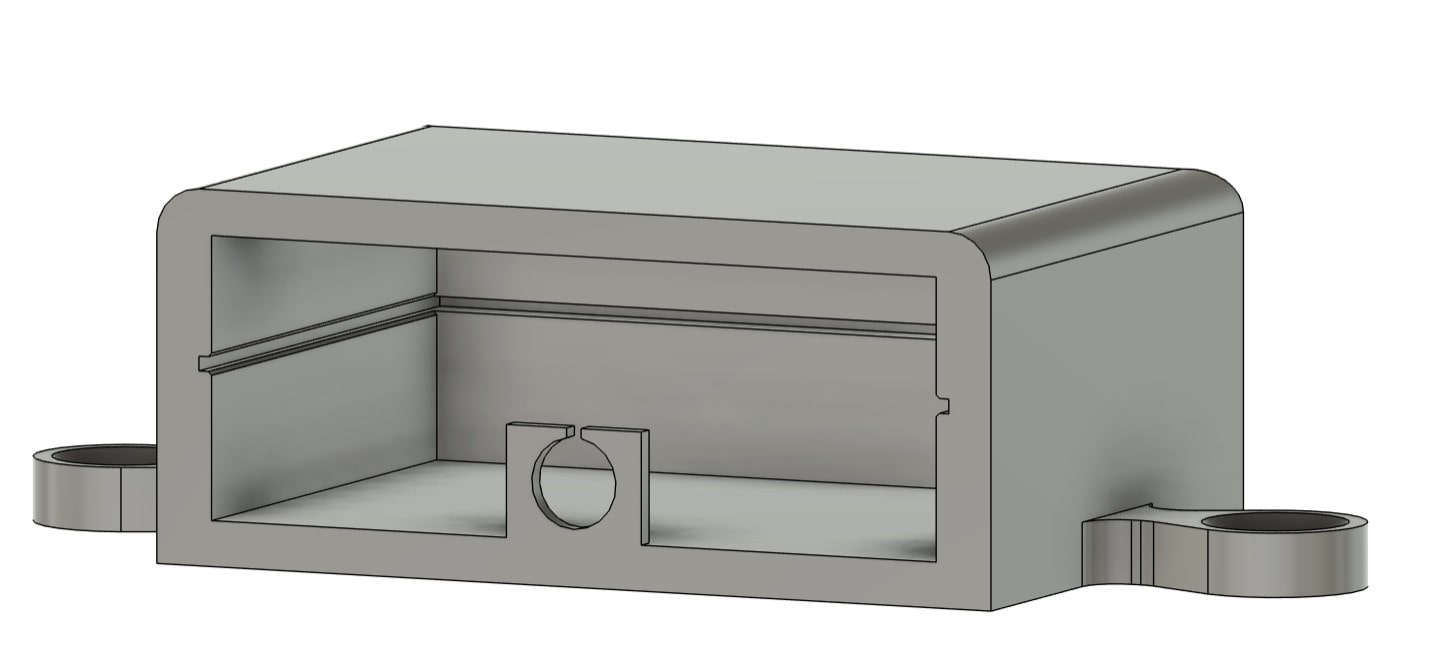
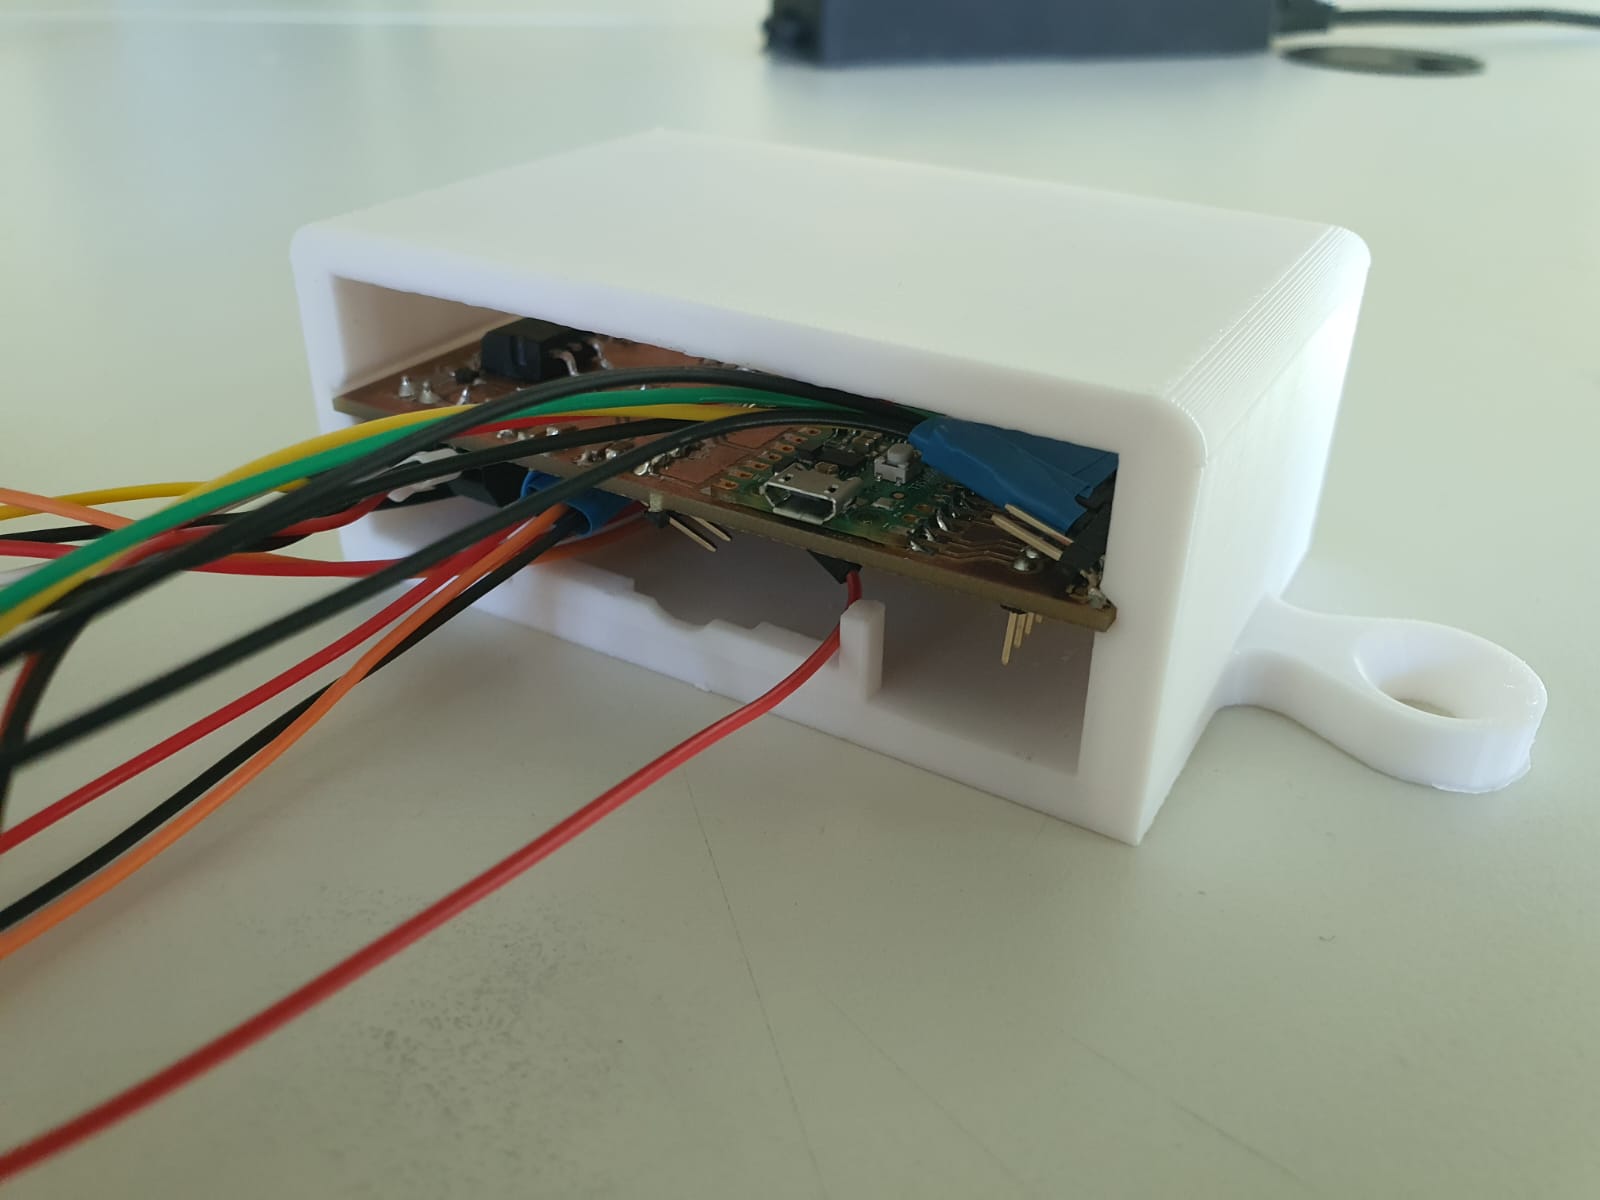
- Electronics Housing Design: PCB Slide Box
- PCBslideboxv13.f3d
- Electronics Housing Design: DS18B20 Temperature Sensor
- DS18B20TempSensorHousingv17.f3d
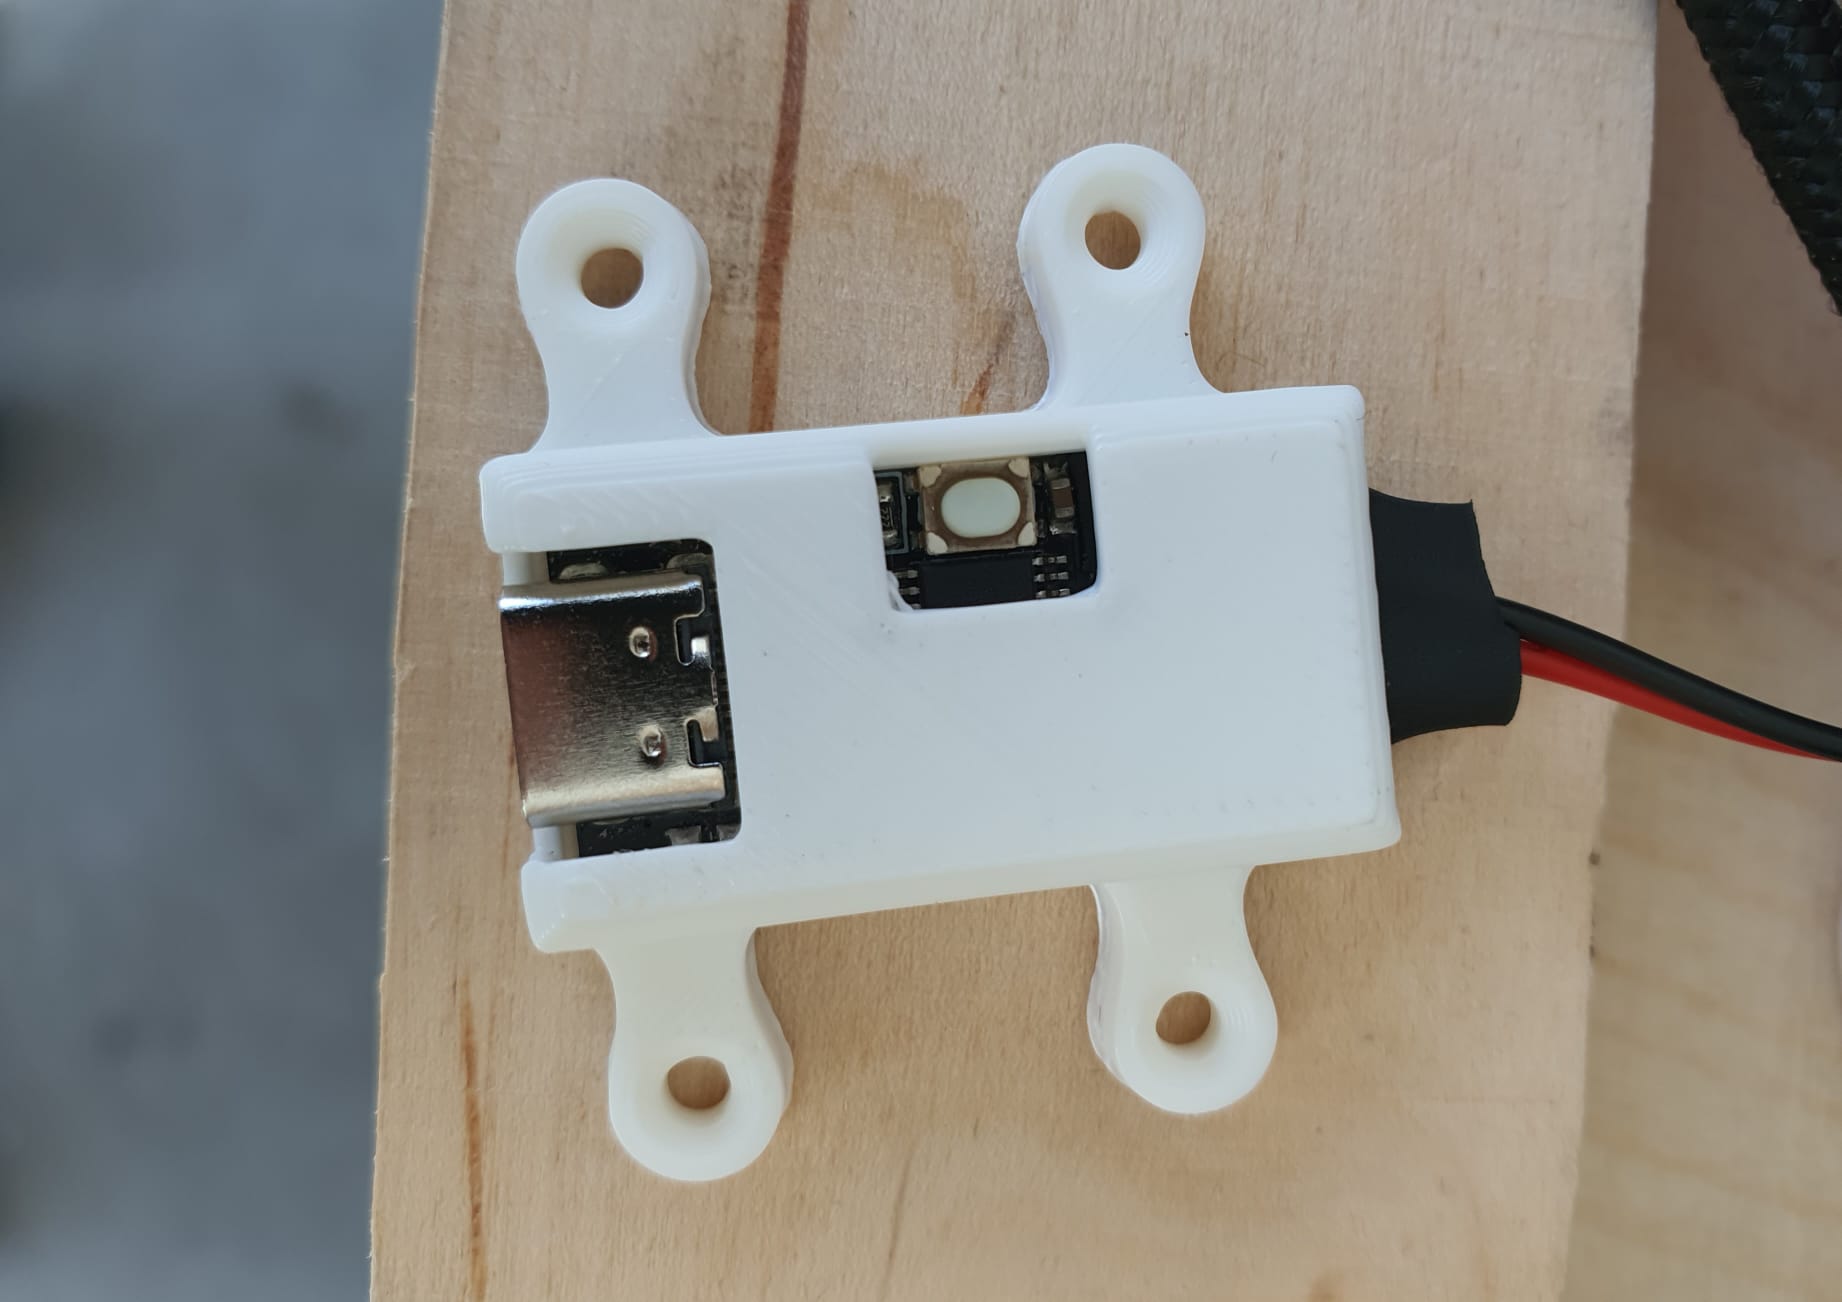
- Electronics Housing Design: USB-C PD Module
- USBPDHousingv9.f3d
- Electronics Housing Design: OLED01.3 Display
- oleddisplayHousingv13.f3d
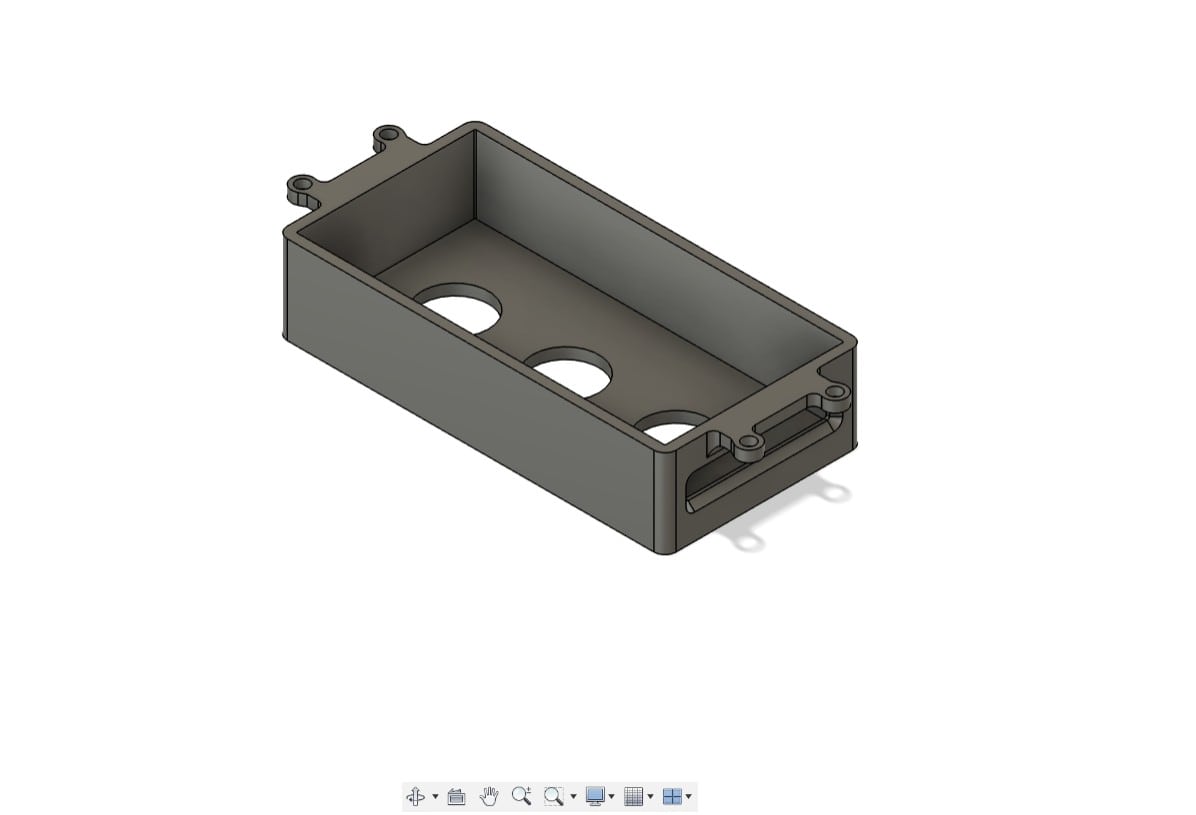
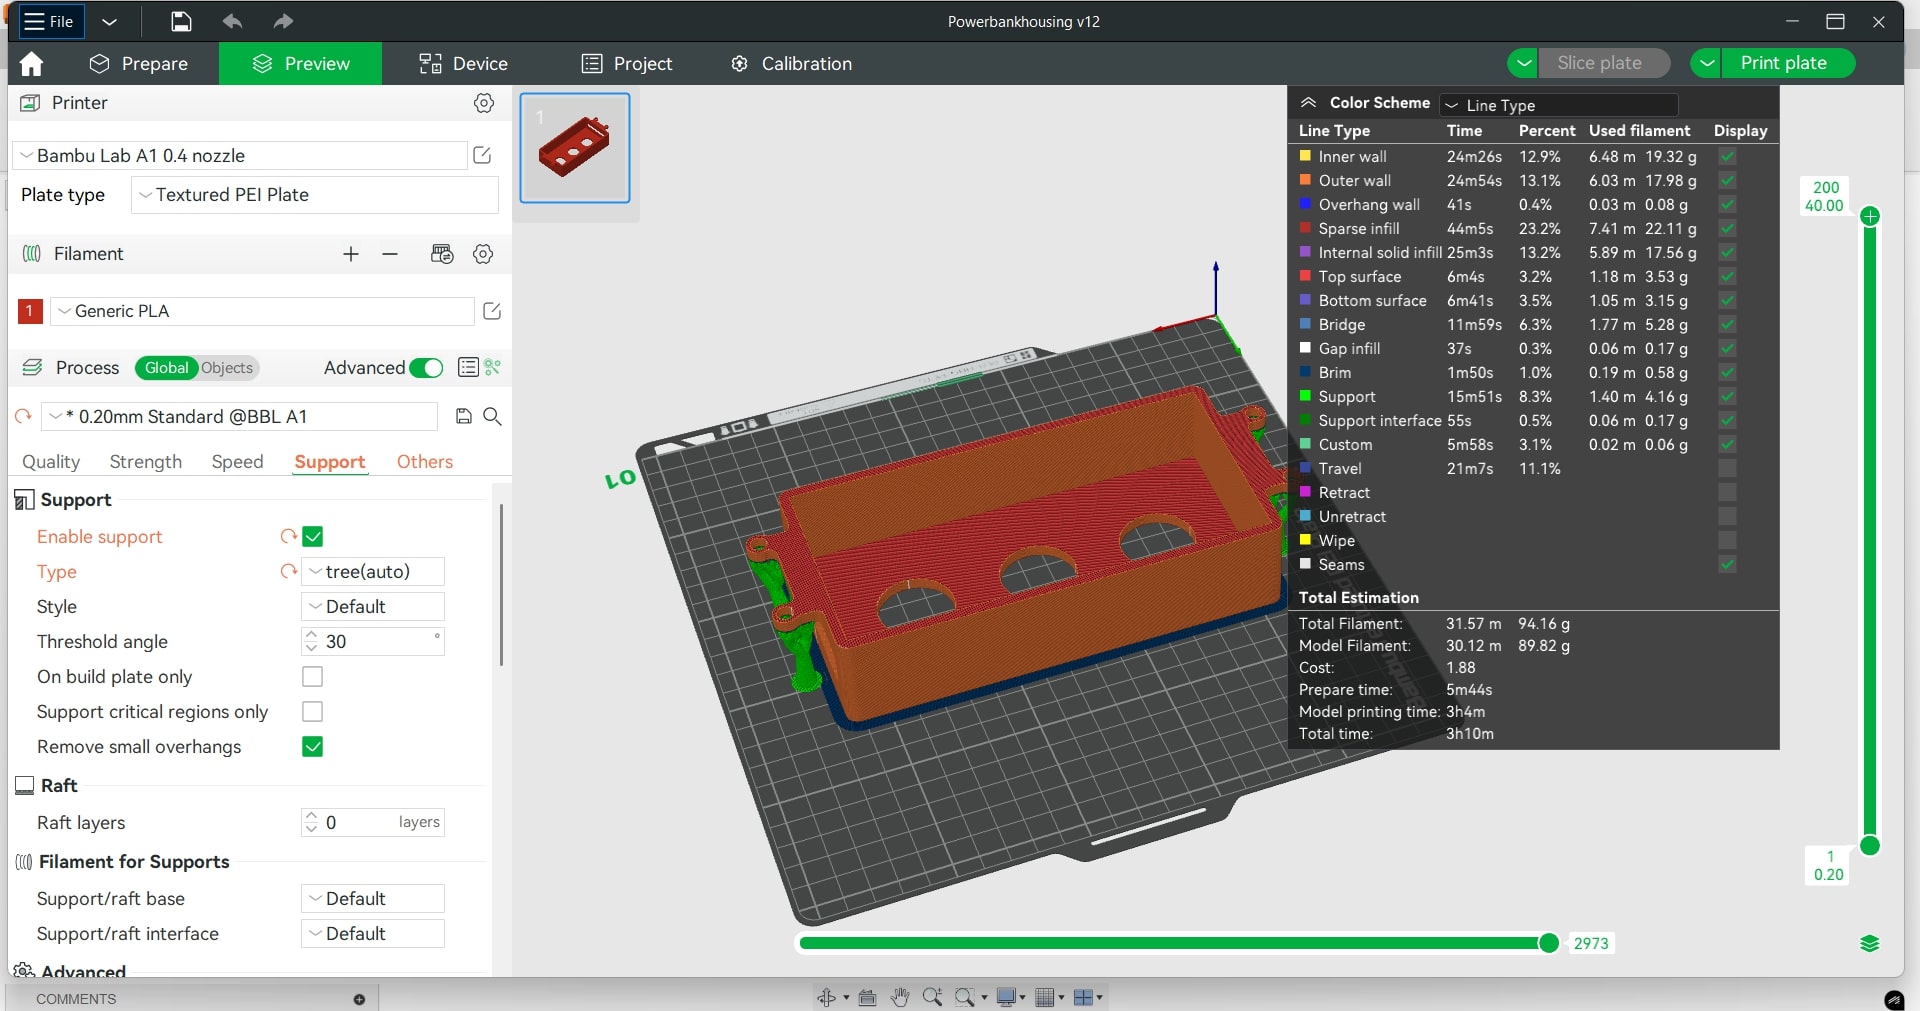
- Electronics Housing Design: Powerbank Housing
- Powerbankhousingv11.f3d