Interface and Application programming
Group Assignment
- Compare as many tool options as possible
Individual Assignment
- Write an application that interfaces a user with an input &/or output device that you made.
Introduction
For this week’s assignment, my task was to create a GUI (Graphical User Interface) that the
user can interact with, after sending the PC via USB cable readings from my input device,
aka temperature sensor DS18B20 (I decided to take the code
I did in final
code draft - week 11 progress, clean it and simplfy the logic).
For my electronics, please check out Week
8 - Electronics Production and Week
9 - Input Devices documentation!
Based on my instructor's recommendation, I downloaded Processing 4. software to visualise my data
in a GUI.
Processing is a beginner-friendly Java-based environment for coding interactive graphics and
hardware interfaces.
To prepare myself, I reviewed the basics: how to open a serial port and send/receive data
using the Serial library,
how to remap raw sensor readings into a fixed range with the map() function (you can also check
out Medium
tutorial),
and how to build a simple GUI (toggles and buttons) using ControlP5 library by following the
ControlP5 guide (you can also check
out the Processing.py
ten-lessons to understand ControlP5 callbacks).
Overall, the processing official site's Documentation reference list was my go to reading
reference to understand different functions and be able to create my code with the help of
ChatGPT.
One last thing I remembered to consider in my prompt was the sensor's library. Since I want
to avoid using library other than the one I found from my last test, I had to explicitly
specify it to make sure I do not receive any other library.
Prompt
"Hi! I’m working on Fab Academy’s Interface & Application Programming week and I need two
matched programs—one for my Raspberry Pi Pico W in the Arduino IDE and one in Processing 4.
I am new to Processing, so please keep everything clear and fully commented.
MicroDS18B20<26> sensor1; and MicroDS18B20<27> sensor2; exactly as written; do not
switch to DallasTemperature.
- PART 1 – Arduino-IDE sketch for the Pico
- Board: Raspberry Pi Pico W (RP2040).
- Sensors: two DS18B20 sensors on GPIO 26 and GPIO 27.
- LED: GPIO 22.
- Firmware requirements:
- every second start a 12-bit conversion, read both sensors, and compute their mean
- send exactly one CSV line per second in the format mean;t1;t2\n (two decimals, no extra text)
- light the LED automatically when the mean ≥ 23 °C unless overridden
- listen for a single-byte command from the computer: '1' forces LED ON, '0' forces LED OFF, the override stays until the next byte
- baud rate must be 9600 to match Processing;
- no banners or debug prints—only the CSV line.
- >Visualisation: draw
- a dial gauge for the mean temperature, scale 20 °C (left) → 30 °C (right), sweep 225° → –45°, color-fade blue → green → red as the value rises, and display the numeric value
- a scrolling strip-chart under the gauge, 10 pixels per second so 60 samples fit the window.
- GUI with ControlP5:
- a toggle switch labelled Stream that, when OFF, pauses or hides the visuals but continues receiving data; when ON, resumes drawing
- a push-button that flips the LED—first click sends '1', second click sends '0', and the caption toggles between “LED ON” and “LED OFF”.
- Deliverables
- A complete Arduino sketch (.ino) that compiles unchanged with microDS18B20.
- A complete Processing 4 sketch (.pde) that runs immediately after ControlP5 is installed through the Library Manager.
ArduinoIDE Programming
Before uploading the sketch to the Pi Pico W, I faced into the same issue I previously ran
into (check Reflection
and Struggles - Week 11); the port disconnecting and getting stuck in the boot mode
UF2. This time, I decided to download the flash_nuke.uf2
file from Raspberry
Pi, reboot the board while holding BOOTSEL, and drag-and-drop that UF2 to reinstall
the bootloader.
Finally, I managed to see the COM7 port and uploaded the code I wrote with
ChatGPT.
ArduinoIDE Code: ChatGPT version
This code uses the microDS18B20 library I already tested two weeks ago and
read two temperature values every second, computes their mean value, and then prints out a
single CSV line in the format mean;t1;t2\n at 9600 baud for the
Processing code to pick up.
It also overrides the automatic LED logic: when it receives 1 > LED is
ON, and when it receives 0 > LED is OFF.
Outside of override mode, the code drives the LED based on whether the mean temperature is
above the threshold = 23°C.
                                #include              // Include the microDS18B20 library
                                    MicroDS18B20<26> sensor1;              // DS18B20 sensor on GPIO 26
                                    MicroDS18B20<27> sensor2;              // DS18B20 sensor on GPIO 27

                                    const int ledPin = 22;                 // LED on GPIO 22
                                    bool overrideActive = false;           // Flag: are we in override mode?
                                    bool overrideState = LOW;              // Forced LED state when overridden

                                    void setup() {
                                      Serial.begin(9600);                  // Start serial at 9600 baud (no banners)
                                      pinMode(ledPin, OUTPUT);             // Configure LED pin as output
                                    }

                                    void loop() {
                                      // 1) Start a new temperature conversion on both sensors
                                      sensor1.requestTemp();
                                      sensor2.requestTemp();

                                      // 2) Wait for conversion to complete (12-bit ≈750 ms; wait 1 s to be sure)
                                      delay(1000);

                                      // 3) Read temperatures (in °C) from the sensors
                                      float t1 = sensor1.getTemp();
                                      float t2 = sensor2.getTemp();

                                      // 4) Compute the mean of the two readings
                                      float meanTemp = (t1 + t2) / 2.0;

                                      // 5) Check for an incoming override command ('1' or '0')
                                      if (Serial.available() > 0) {
                                        char cmd = Serial.read();
                                        if (cmd == '1') {
                                          overrideActive = true;
                                          overrideState = HIGH;
                                        }
                                        else if (cmd == '0') {
                                          overrideActive = true;
                                          overrideState = LOW;
                                        }
                                      }

                                      // 6) Control the LED: override if active, else auto on mean ≥23 °C
                                      if (overrideActive) {
                                        digitalWrite(ledPin, overrideState);
                                      } else {
                                        if (meanTemp >= 23.0) digitalWrite(ledPin, HIGH);
                                        else                  digitalWrite(ledPin, LOW);
                                      }

                                      // 7) Send one CSV line: mean;t1;t2\n (two decimals, no extra text)
                                      Serial.print(meanTemp, 2);
                                      Serial.print(';');
                                      Serial.print(t1,       2);
                                      Serial.print(';');
                                      Serial.print(t2,       2);
                                      Serial.print('\n');
                                    }
Processing Code: ChatGPT Version
Processing software has a very similar GUI to ArduinoIDE. Hence, navigating through it for
the first time was not difficult. In order to be able to run the sketch, you need to close
the ArduinIDE sketch first. Moreover, you can't open two sketches in parallel in Processing;
it will show you Port busy error. Hence, run only one sketch at a time!
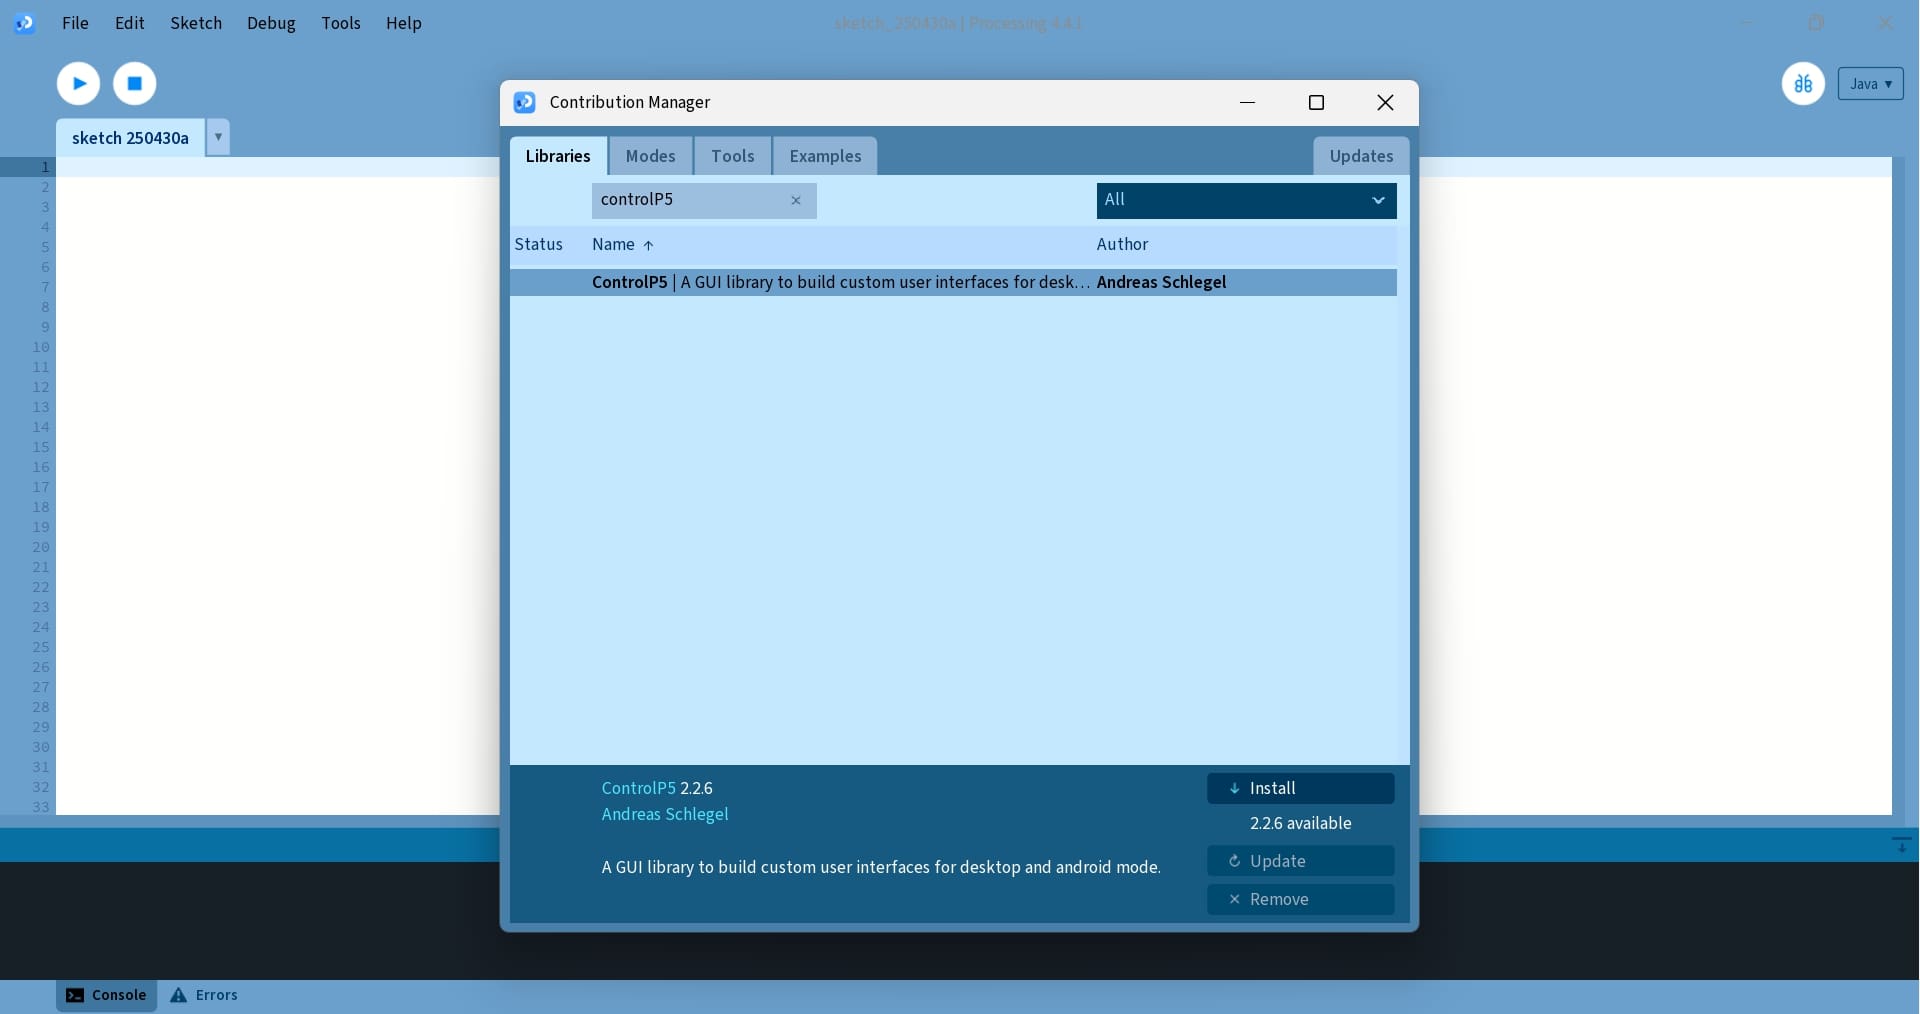
First, I had to download the ControlP5 library from the library manager to
be able to run the code.
Then, I pasted the code I acquired from ChatGPT.
In this code, COM ports were listed in the Draws a simple dial that shows the mean temperature between 20 °C and 30 °C. For
styling, the needle moves around the arc and changes color from blue to green to red as
the temperature increase, and the value is printed underneath .
Draws a line chart of the last 60 temperature records .
Lastly, when the Stream switch is toggled or the LED
button is clicked, all events go through one function:
setup(), then the Pico’s port was
opened with bufferUntil('\n'), at a baudrate of 9600 (to match the baud rate
from the Arduino code).
Furthermore, it generates a Stream toggle and LED button via ControlP5
library. Then, the draw() funcion starts by clearing the screen. If the
Streamswitch is on, the sketch does two things:
controlEvent().
This function receives with button has been pressed by the user, updates the internal on/off
state, sends the 1 or 0 character over serial accordingly,
and updates the button label.
                                import processing.serial.*;   // import serial library
import controlP5.*;           // import ControlP5 for GUI

Serial myPort;                // The serial port object
ControlP5 cp5;                // ControlP5 instance
Toggle streamToggle;          // Toggle to pause/resume drawing
Button ledButton;             // Button to flip the Pico's LED
boolean ledState = false;     // Track current LED state (false=off)

int totalSamples = 60;        // buffer length for 1-minute history
float[] data = new float[totalSamples];
int dataIndex = 0;
boolean dataFull = false;
float currentMean = 0;        // Latest mean value

void setup() {
  size(600, 600);                           // Window size

  // Serial setup
  println(Serial.list());                   // List available ports
  String[] ports = Serial.list();
  int portIndex = 0;                        // ← change this to your Pico's index
  myPort = new Serial(this, ports[portIndex], 9600);
  myPort.bufferUntil('\n');                 // Deliver full lines

  // GUI setup
  cp5 = new ControlP5(this);
  streamToggle = cp5.addToggle("stream")
    .setPosition(20, 20)
    .setSize(50, 20)
    .setLabel("Stream")
    .setValue(true);
  ledButton = cp5.addButton("ledButton")
    .setPosition(100, 20)
    .setSize(80, 20)
    .setLabel("LED ON");
}

void draw() {
  background(255);                          // White background

  if (streamToggle.getState()) {            // Only draw when streaming
    drawGauge();
    drawStripChart();
  }
}

// Called when a full CSV line arrives
void serialEvent(Serial p) {
  String line = p.readStringUntil('\n');
  if (line != null) {
    line = trim(line);
    String[] parts = split(line, ';');
    if (parts.length == 3) {
      float mean = float(parts[0]);
      // Add to circular buffer
      data[dataIndex] = mean;
      dataIndex = (dataIndex + 1) % totalSamples;
      if (dataIndex == 0) dataFull = true;
      currentMean = mean;
    }
  }
}

// Draw the dial gauge for currentMean
void drawGauge() {
  float cx = width/2;
  float cy = height/3;
  float radius = 150;

  // Gauge arc
  stroke(0);
  noFill();
  arc(cx, cy, radius*2, radius*2, radians(225), radians(-45));

  // Compute needle angle (20→30 °C maps 225°→-45°)
  float angle = map(currentMean, 20, 30, radians(225), radians(-45));

  // Color fade: blue→green→red
  color c;
  if      (currentMean <= 20) c = color(0, 0, 255);
  else if (currentMean >= 30) c = color(255, 0, 0);
  else if (currentMean <= 25) c = lerpColor(color(0, 0, 255), color(0, 255, 0), map(currentMean, 20, 25, 0, 1));
  else                        c = lerpColor(color(0, 255, 0), color(255, 0, 0), map(currentMean, 25, 30, 0, 1));

  // Draw needle
  pushMatrix();
  translate(cx, cy);
  stroke(c);
  strokeWeight(3);
  float nx = radius * cos(angle - HALF_PI);
  float ny = radius * sin(angle - HALF_PI);
  line(0, 0, nx, ny);
  popMatrix();

  // Numeric readout
  fill(0);
  textAlign(CENTER, CENTER);
  text(nf(currentMean, 0, 2) + " °C", cx, cy + radius + 20);
}

// Draw the scrolling strip-chart
void drawStripChart() {
  float chartY = height * 2/3;
  float chartH = height/3 - 40;

  // Border
  noFill();
  stroke(0);
  rect(10, chartY, width - 20, chartH);

  // Data polyline
  noFill();
  beginShape();
  int count = dataFull ? totalSamples : dataIndex;
  for (int i = 0; i < count; i++) {
    int idx = (dataIndex + i) % totalSamples;
    float x = map(i, 0, totalSamples - 1, 10, width - 10);
    float y = map(data[idx], 20, 30, chartY + chartH, chartY);
    vertex(x, y);
  }
  endShape();
}

// Handle LED button clicks
void controlEvent(ControlEvent e) {
  if (e.getController().getName().equals("ledButton")) {
    if (ledState) {
      myPort.write('0');                   // Turn LED OFF on Pico
      ledState = false;
      e.getController().setLabel("LED ON");
    } else {
      myPort.write('1');                   // Turn LED ON on Pico
      ledState = true;
      e.getController().setLabel("LED OFF");
    }
  }
}
Arduino Code Modified
After testing, I decided to slightly adjust the Arduino code better reliability. First, I
wrote few comments at the beginning to intruduce briefly what the code does.
Then, I added error checks on each
readTemp() for debugging. Afterwards, I
defined the constant tempThreshold.
Lastly, I simplified the override logic for controlling the LED, so that incoming
0s/1s commands are processed immediately in one block at the bedginning of
loop() (by removing nested if-statements and using only one condition to set
the LED state > behavior becomes more predictable).
                        /*
 - Raspberry Pi Pico W + two DS18B20 sensors + status LED
  • Built-in error check on readTemp() → GUI only sees valid data
  • When overrideActive==true → tempThreshold logic is bypassed
  • Outputs every 1 s: mean;t1;t2\n
  • Accepts single-byte commands: '1'→LED ON, '0'→LED OFF
 */

#include        // DS18B20  MicroMicro library

// Pins Definition
MicroDS18B20<26> sensor1;       // DS18B20 on GPIO 26
MicroDS18B20<27> sensor2;       // DS18B20 on GPIO 27
#define LED_PIN 22              // status LED

// Temperature Threshold
const float tempThreshold = 23.0;   // auto-LED ON above this mean °C

// Set-up
void setup() {
  Serial.begin(9600);           // baudrate should match the Processing sketch
  pinMode(LED_PIN, OUTPUT);
}
// Global variables
bool overrideActive = false; //initially OFF
bool overrideState  = false;

void loop() {
  // Process any incoming 1s/0s commands immediately
  while (Serial.available()) {
    char c = Serial.read();
    if (c == '1') {
      overrideActive = true;
      overrideState  = true;
    }
    else if (c == '0') {
      overrideActive = true;
      overrideState  = false;
    }
    // ignore anything else
  }

  // Kick off conversions
  sensor1.requestTemp();
  sensor2.requestTemp();
  delay(1000);                // wait for the DS18B20 sensor

  // Read temperature values and compute mean
  bool ok1 = sensor1.readTemp();
  bool ok2 = sensor2.readTemp();
  if (ok1 && ok2) {
    float t1 = sensor1.getTemp();
    float t2 = sensor2.getTemp();
    float meanT = 0.5 * (t1 + t2);

    // apply LED logic with override
    if (overrideActive) {
      digitalWrite(LED_PIN, overrideState ? HIGH : LOW);
    } else {
      digitalWrite(LED_PIN, meanT >= tempThreshold ? HIGH : LOW);
    }

    // send CSV line
    Serial.print(meanT, 2); Serial.print(';');
    Serial.print(t1,     2); Serial.print(';');
    Serial.println(t2,   2);
  }

  // loop back and wait for next command!
}
The code works as expected. Nevertheless, the gauge lacks ticks or a digital readout, and
the strip chart only shows the mean value line, which makes it hard to differential between
the two sensors readings.
Moreover, toggling buttons of the stream and the LED is
quite confusing, since they lack the labels.
Processing Code Modified
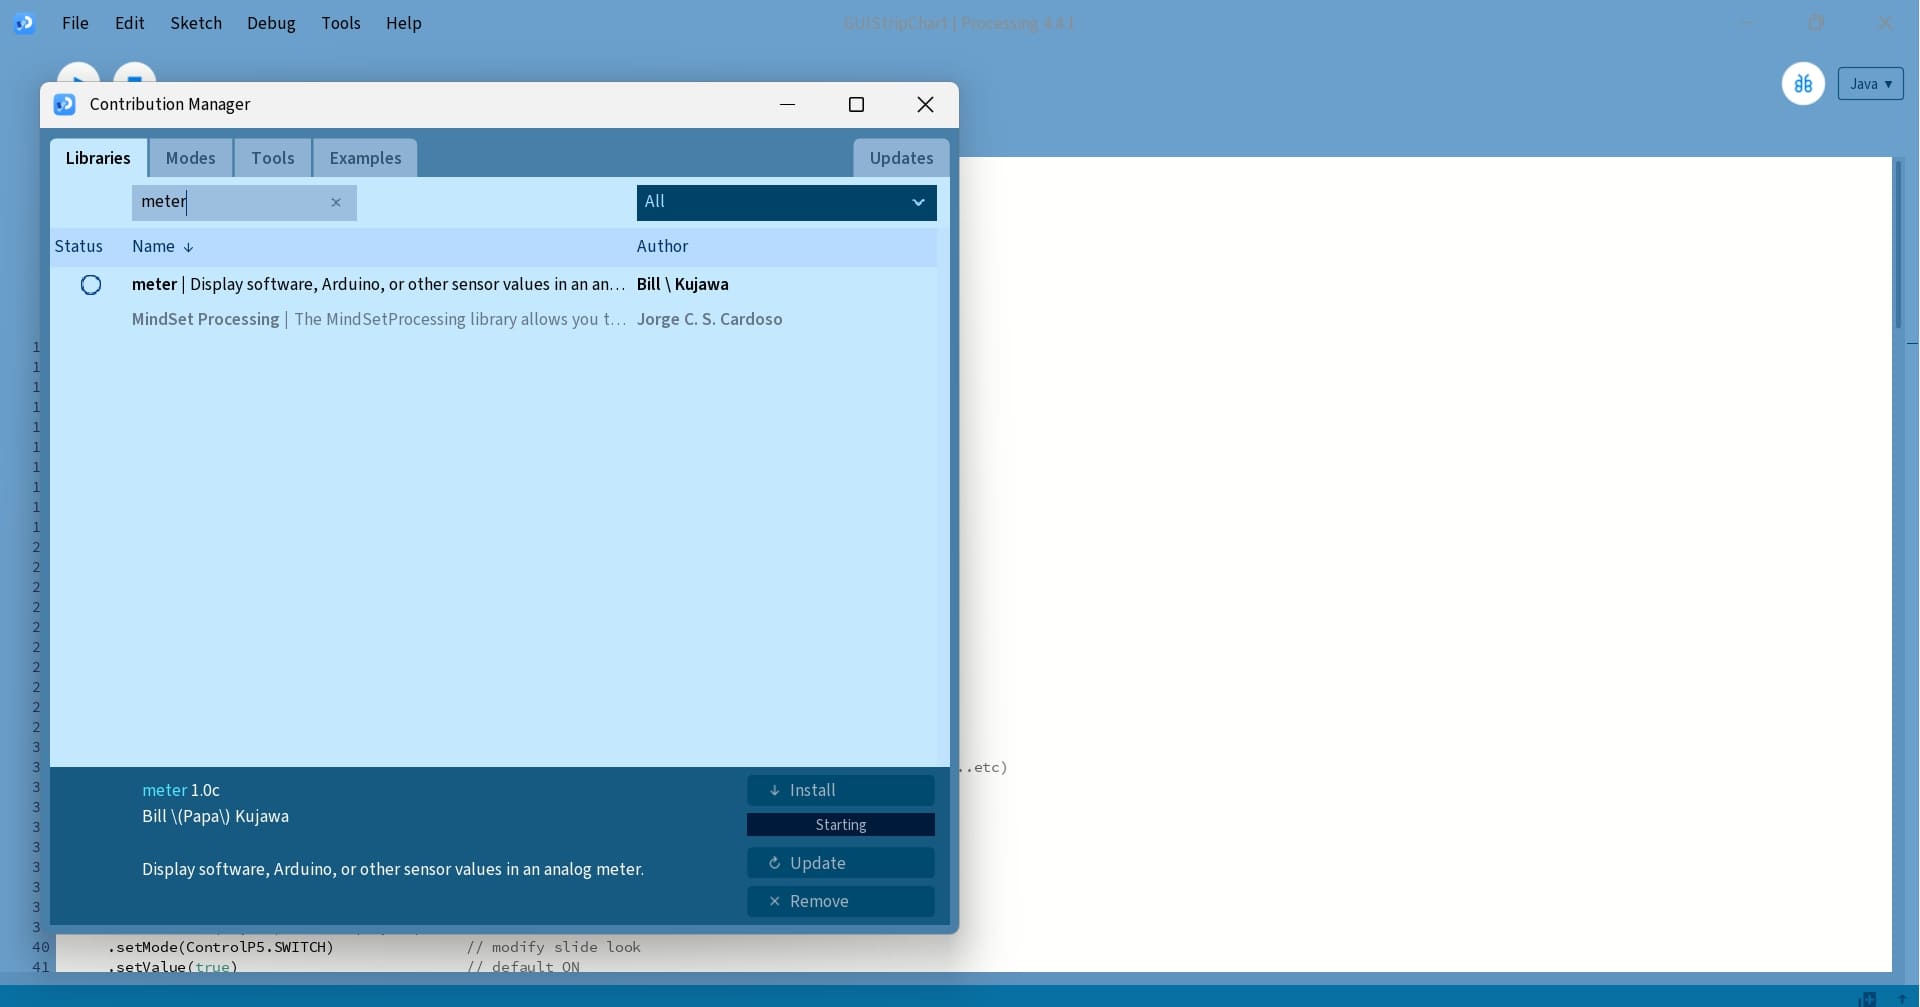
Since I wasn't satisfied with the appearance of my GUI, I decided to modify the code. First,
after watching
the youtube video tutorial I attached at the end, I decided to download the Meter
library.
Second, I went through the library examples on Github, specifically SetAllValues
example to understand how I can tweak the styling of the gauge for temperature
readings (titles,
ticks, arc thickness, needle,).
Moreover, I reviewed the code example from Electronic
Clinic gauge tutorial to understand how I can map raw sensor values onto an arc and
smoothly fade
the dial color (blue > green > red).
This led me to replace the arcs with
tempGauge.set…() calls,
replace fixed
values with constants MIN_T and MAX_T, and enable a
digital readout.
Lastly, I upgraded the strip chart, so each DS18B20 sensor has its own color, with axes and
a legend for
better visualisation (you can check out Double Sensor
Graphs
example).
                                /*
 -  Pi Pico 2 + two temperature sensors DS18B20 + LED
 -  Libraries used: Serial (built-in)  |  ControlP5 | Meter
 */

// Import Libraries
import processing.serial.*;   // built-in serial commmunication
import controlP5.*;           // ControlP5 GUI widgets
import meter.*;               // external Meter library

// Declare global objects
Serial    pico;               // serial port to Pico
ControlP5 cp5;                // ControlP5 controller
Meter     tempGauge;          // Meter gauge object

// History buffers for each sensor
float[] hist1  = new float[60];  // buffer for sensor 1
float[] hist2  = new float[60];  // buffer for sensor 2

// State variables
int       dataIndex      = 0;       // current write index into dataIndex
boolean   stream    = true;    // true = draw visuals, false = paused
boolean   ledOn     = false;   // track LED override state
float     currentT  = 0;       // latest mean temperature

// Gauge range constants
final float MIN_T = 20;        // lower bound on gauge
final float MAX_T = 30;        // upper bound on gauge

// Trace colors
color col1 = color(  0, 200, 255);  // cyan for sensor 1
color col2 = color(255, 100, 100);  // salmon for sensor 2

void setup() {
  size(900, 600);                        // set canvas to 900×600 pixels
  surface.setTitle("Temperature Readings"); // window title bar text

  // Serial Port Setup
  println("Ports:", Serial.list());      // print available COM ports in console
  pico = new Serial(this, Serial.list()[0], 9600); // open first port @ 9600 baudrate
  pico.bufferUntil('\n');                // call serialEvent() on each newline

  // ControlP5 setup
  cp5 = new ControlP5(this);             // create GUI controller

  // Stream toggle
  cp5.addToggle("stream")                // auto-calls stream(boolean)
     .setPosition(20, 20)                // place at x=20, y=20
     .setSize(60, 25)                    // width=60, height=25
     .setMode(ControlP5.SWITCH)          // render as on/off switch
     .setValue(true)                     // default state = ON
     .getCaptionLabel()
       .set("Stream");                   // label the switch “Stream”

  // LED button
  cp5.addButton("LED")                   // auto-calls LED() on click
     .setPosition(100, 20)               // place to the right of toggle
     .setSize(80, 25)                    // width=80, height=25
     .setCaptionLabel("LED OFF");        // initial button text

  // Meter gauge setup
  tempGauge = new Meter(this, width/2 - 150, 20); // position gauge

  tempGauge.setTitleFontName("Arial Bold");  // set gauge title font
  tempGauge.setTitleFontSize(20);            // set title font size
  tempGauge.setTitle("Mean Temp (°C)");      // set title text

  // Clamp gauge input to [MIN_T,MAX_T]
  tempGauge.setMinInputSignal((int)MIN_T);   // min physical reading
  tempGauge.setMaxInputSignal((int)MAX_T);   // max physical reading
  tempGauge.setMinScaleValue((int)MIN_T);    // min tick label
  tempGauge.setMaxScaleValue((int)MAX_T);    // max tick label

  // Build tick labels at 2 °C intervals
  String[] labels = new String[(int)((MAX_T - MIN_T) / 2) + 1];
  for (int i = 0; i < labels.length; i++) {
    labels[i] = nf(MIN_T + i*2, 0, 0);       // format “20”, “22”, …, “30”
  }
  tempGauge.setScaleLabels(labels);          // apply tick labels

  // Visual styling for the gauge
  tempGauge.setArcColor(color(60));          // track (rim) color
  tempGauge.setArcThickness(15);             // track arc thickness
  tempGauge.setNeedleThickness(4);           // set pointer thickness
  tempGauge.setDisplayDigitalMeterValue(true);// show digital number
}

void draw() {
  background(0);                         // set screen to black

  // Draw dial gauge or paused message
  if (stream) {
    tempGauge.updateMeter(int(currentT)); // update gauge reading
  } else {
    fill(255);                           // white text (range from 0 to 255 → black to white)
    textSize(18);                        // font size
    textAlign(CENTER, CENTER);           // center alignment
    text("Stream OFF", width/2, 140);    // draw paused label
  }

  // Draw the strip-chart below
  drawPlot();                            // call custom plot function
}


// called by ControlP5 when the toggle changes
public void stream(boolean active) {
  stream = active;                       // store new state
}

// called by ControlP5 when the "LED" button is clicked
public void LED(int theValue) {        // callback signature (e.g. user interaction with a button) must accept an integer (click count)
  ledOn = !ledOn;                      // flip local LED state flag
  pico.write(ledOn ? '1' : '0');       // send '1' if ledOn true, else '0'
  cp5.get(Button.class, "LED")         // retrieve the Button named "LED"
     .setCaptionLabel(ledOn ?         // set its label to match the new state
       "LED ON" : "LED OFF");
  println("LED() callback, ledOn = " + ledOn); // debug print to confirm it fired
}                                       // end of LED callback

// called whenever a full line arrives on serial
void serialEvent(Serial s) {            // serialEvent triggered on '\n'
  String line = trim(                   // read up to newline
    s.readStringUntil('\n'));           // trim whitespace
  if (line == null || line.isEmpty())   // if nothing valid was read
    return;                             // exit the handler

  String[] parts = split(line, ';');    // split the CSV "mean;t1;t2" by semicolons

  float m  = parseFloat(parts[0]);      // parse mean temperature
  float t1 = parseFloat(parts[1]);      // parse sensor 1 reading
  float t2 = parseFloat(parts[2]);      // parse sensor 2 reading

  currentT    = m;                      // store mean for gauge update
  hist1[dataIndex] = t1;                     // push sensor1 into its circular buffer
  hist2[dataIndex] = t2;                     // push sensor2 into its circular buffer

  dataIndex = (dataIndex + 1) % hist1.length;     // advance buffer index, wrapping at 60
}                                       // end of serialEvent handler

void drawPlot() {
  // compute plotting bounds and spacing
  int plotTop    = 300;                 // y-pixel position of the top edge of the chart area
  int plotBottom = height - 40;         // y-pixel position of the bottom edge of the chart area
  int marginLeft = 60;                  // x-pixel offset from the left where the y-axis is drawn
  // horizontal spacing so 60 samples fill from marginLeft → (width - 20)
  float spacing  = float(width - marginLeft - 20) / (hist1.length - 1);

  // draw sensor #1 trace in cyan
  stroke(col1);                         // set stroke color to col1 (cyan)
  strokeWeight(2);                      // set line thickness to 2 pixels
  noFill();                             // disable filling any shapes
  beginShape();                         // start recording vertices for a continuous line
  for (int i = 0; i < hist1.length; i++) {
    int p = (dataIndex + i) % hist1.length;  // wrap buffer index to get oldest → newest sample
    float x = marginLeft + i * spacing; // compute x-position of this sample
    float y = map(hist1[p], MIN_T, MAX_T, plotBottom, plotTop); // map temp → vertical pixel
    vertex(x, y);                       // add this point to the shape
  }
  endShape();                           // draw the connected line

  // draw sensor #2 trace in salmon, nudged +0.5°C for visibility (since they are essentially recording identical temperatures)
  stroke(col2);                         // set stroke color to col2 (salmon)
  strokeWeight(2);                      // set line thickness to 2 pixels
  noFill();                             // disable fill
  beginShape();                         // begin new shape for sensor 2
  for (int i = 0; i < hist2.length; i++) {
    int p = (dataIndex + i) % hist2.length;  // wrap buffer index for sensor 2
    float x = marginLeft + i * spacing; // compute x-position for this sample
    // temporary offset (+0.5°C) so the two traces don’t overlap exactly
    float y = map(hist2[p] + 0.5, MIN_T, MAX_T, plotBottom, plotTop);
    vertex(x, y);                       // add point to the second shape
  }
  endShape();                           // draw the second connected line

  // draw the y-axis line and its min/max labels
  stroke(180);                          // set stroke to light gray for axis
  strokeWeight(1);                      // set axis line thickness to 1 pixel
  line(marginLeft, plotTop, marginLeft, plotBottom); // draw vertical axis
  noStroke();                           // disable stroke for text
  fill(200);                            // set fill color for labels
  textAlign(RIGHT, CENTER);             // right-align labels horizontally, center vertically
  text(MIN_T + "°", marginLeft - 5, plotBottom); // draw minimum temp label just left of axis bottom
  text(MAX_T + "°", marginLeft - 5, plotTop);    // draw maximum temp label just left of axis top

  // draw legend entries for each sensor trace
  textAlign(LEFT, CENTER);              // left-align legend text
  fill(col1);                           // set fill to sensor 1 color
  text("Sensor 1", marginLeft + 5, plotTop + 10);  // label for sensor 1
  fill(col2);                           // set fill to sensor 2 color
  text("Sensor 2", marginLeft + 5, plotTop + 30);  // label for sensor 2
}
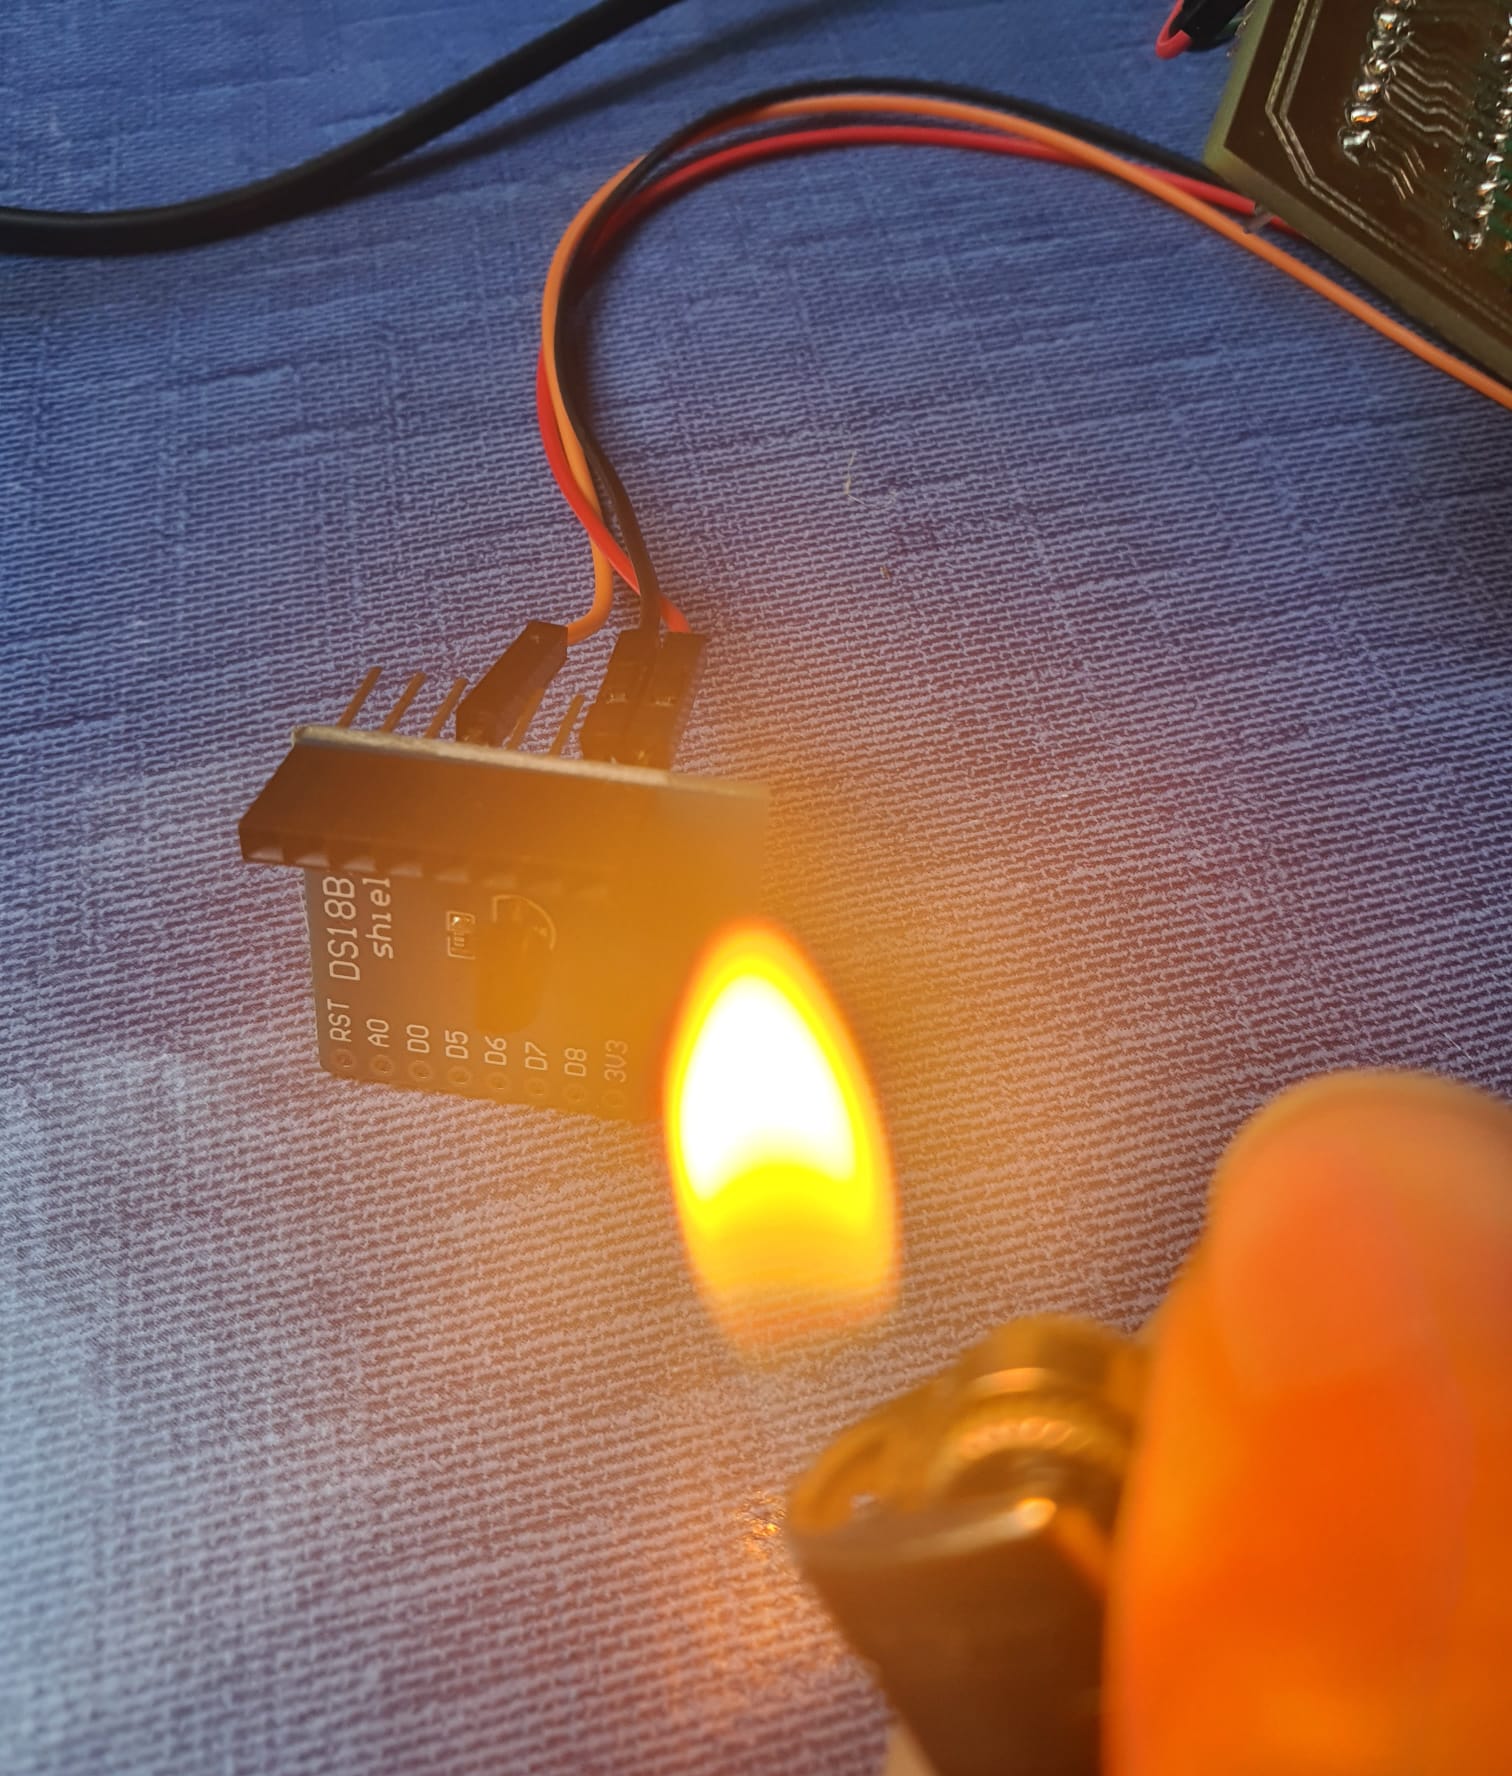
To see the changes in the needle color, I turned on a lighter right infront of the DS18B20
sensor so the
temperature increases fast and changes can be visible faster.
In the video on theleft, we can see modified code, which looks much more
polished. The tick
marks are clearly labeled on the gauge, the live temperature values beneath it, and the
dual-color strip
chart with its own axes and legend to represent values from both DS18B20 sensors.
Whereas in the video on the right, we can confirm that the LED button is
fully functional:
each click sends either 1 or 0 over serial, and the button
label toggles
between LED ON and LED OFF accordingly.
This visual response confirms that the override logic is working perfectly fine on the Pico
W.
Conclusion and Reflection
This week’s task was about turning raw temperature readings into a interactable GUI. I
achieved this by reusing my week 11 draft code, but immediately faced the same issue with
the port. Therefore, I flash the bootloader with flash_nuke.uf2 file in
BOOTSEL mode to bring COM7 port back and upload the code.
Once that was solved, I used ChatGPT to write both the Arduino and Processing sketches.
Nevertheless, the outcome was not matching my expectations, hence, I did some more readings
on Processing Serial guide, ControlP5 callback guides, and the Meter library’s examples to
enhance my GUI I achieved with ChatGPT. Last result was more or less good for a first timer:
dial gauge with ticks and a live digital curve with legends and axes labels.
Overall, Processing is a powerful and beginner-friendly software. It has clear syntax, good
documentation, and various library examples that one can start off with to build a
well-designed GUI!
YouTube Tutorials:
- The Coding Train, 2015, 0.0: Introduction - Processing Tutorial
- The Thinker Teacher, 2023, Programming in Processing (JAVA) for Beginners - Part 1
- Digitale Profis, 2023, DIESER CHATGPT PROMPT IST DER WAHNSINN
- Electronics Clinic, 2022, Arduino Sensor Values on Gauges designed in Processing Software, Sensors Dashboard
Files
- Arduino Code: ChatGPT Version
- GUITempSerialGPT.ino
- Processing Code: ChatGPT Version
- GUIStripChartGPT.pde
- Arduino Code: Modified
- GUITempSerial.ino
- Processing Code: Modified
- GUIStripChart.pde