10. Input devices
-
Individual assignment:
- Measure something: add a sensor to a microcontroller board that you have designed and read it.
-
Group assignment:
- Probe an input device’s analog levels and digital signals.
10.1. Individual assignment
I will take the opportunity to design the board for my final project. This board must collect audio via a microphone, analyze the audio separating it into frequency bands and link the different frequency bands with the 5 jets of water that the source and its LEDs will have. And also play music sent from a mobile via bluetooth through some speakers.
So I will design everything necessary, and in this assignment I will focus on the inputs, using the microphone to analyze the audio.
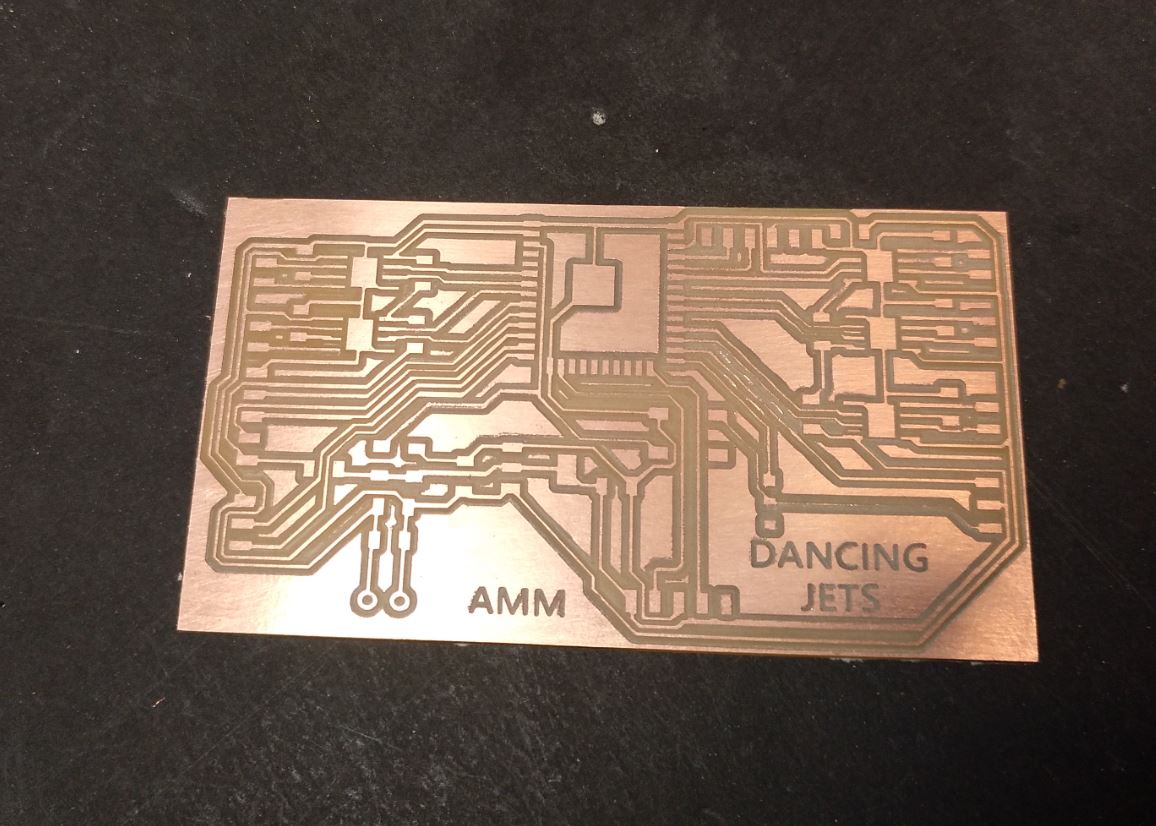
10.1.1. Designing and milling
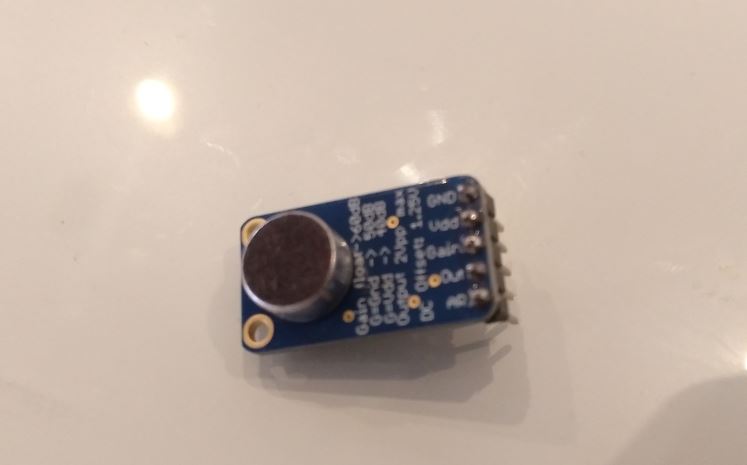
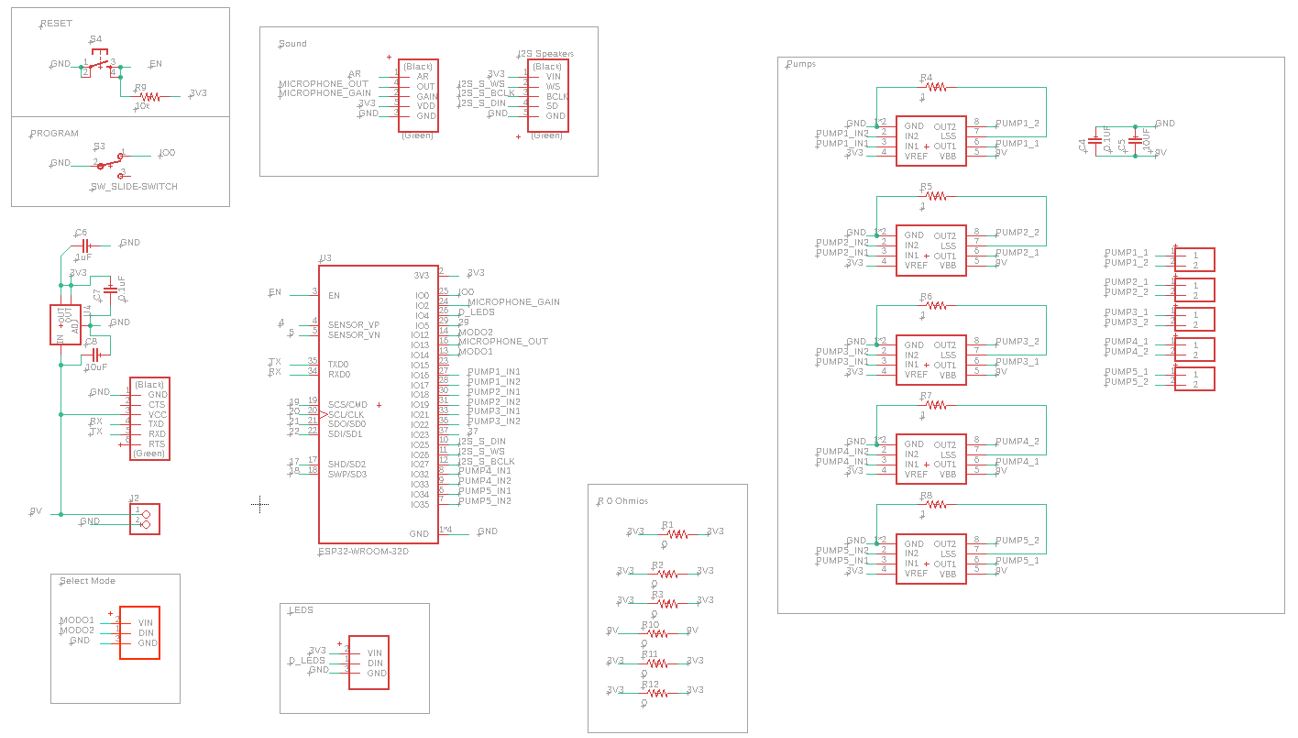
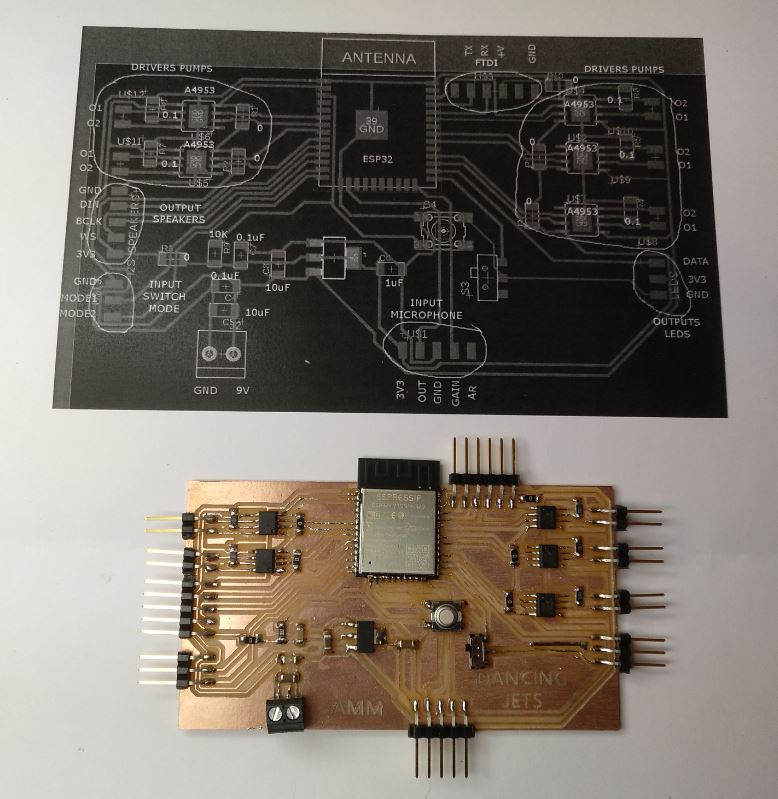
I design the board in EAGLE. I have chosen to use an ESP32 for its speed, memory and bluetooth communication. The microphone is an Adafruit Electret Microphone Amplifier - MAX9814 with Auto Gain Control.
This is the sketch of my board.
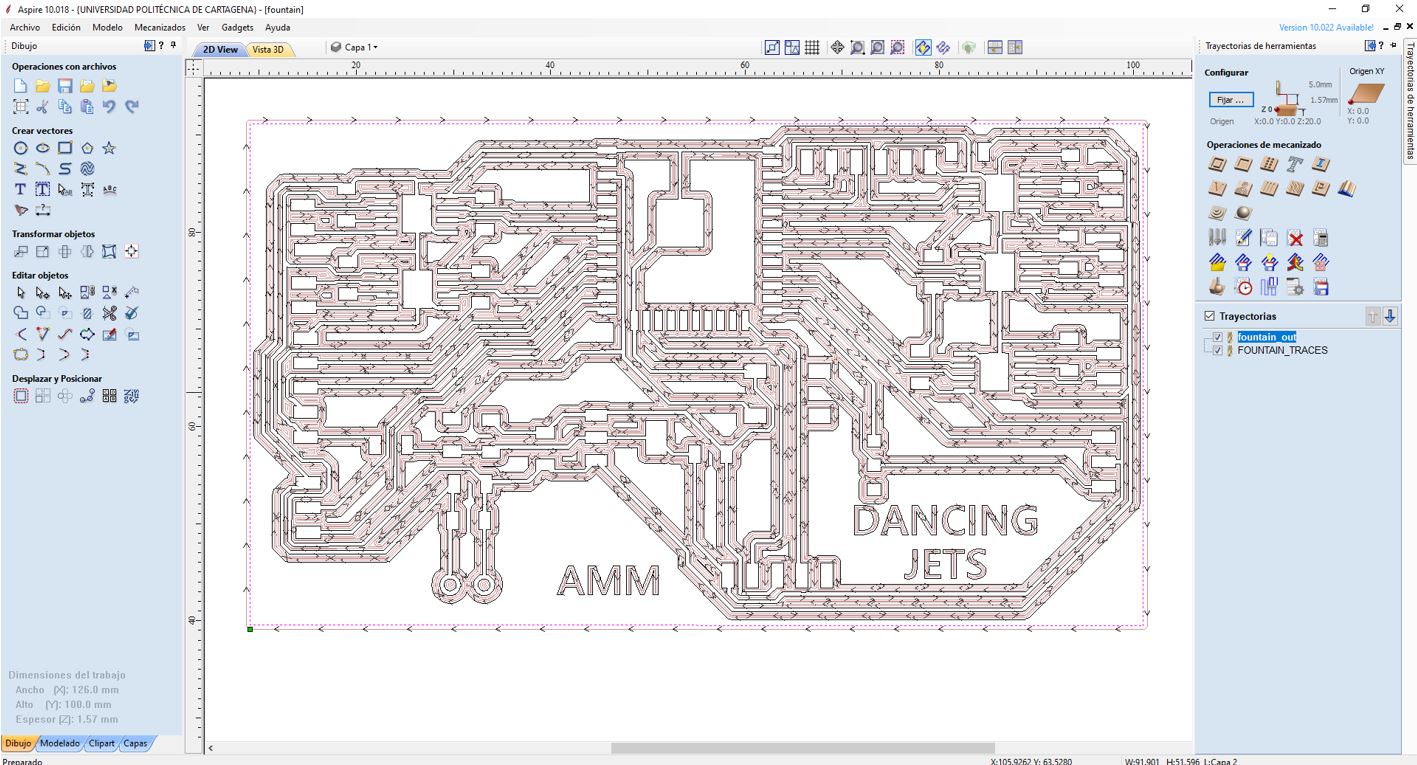
This is the image to mill the tracks on my board.
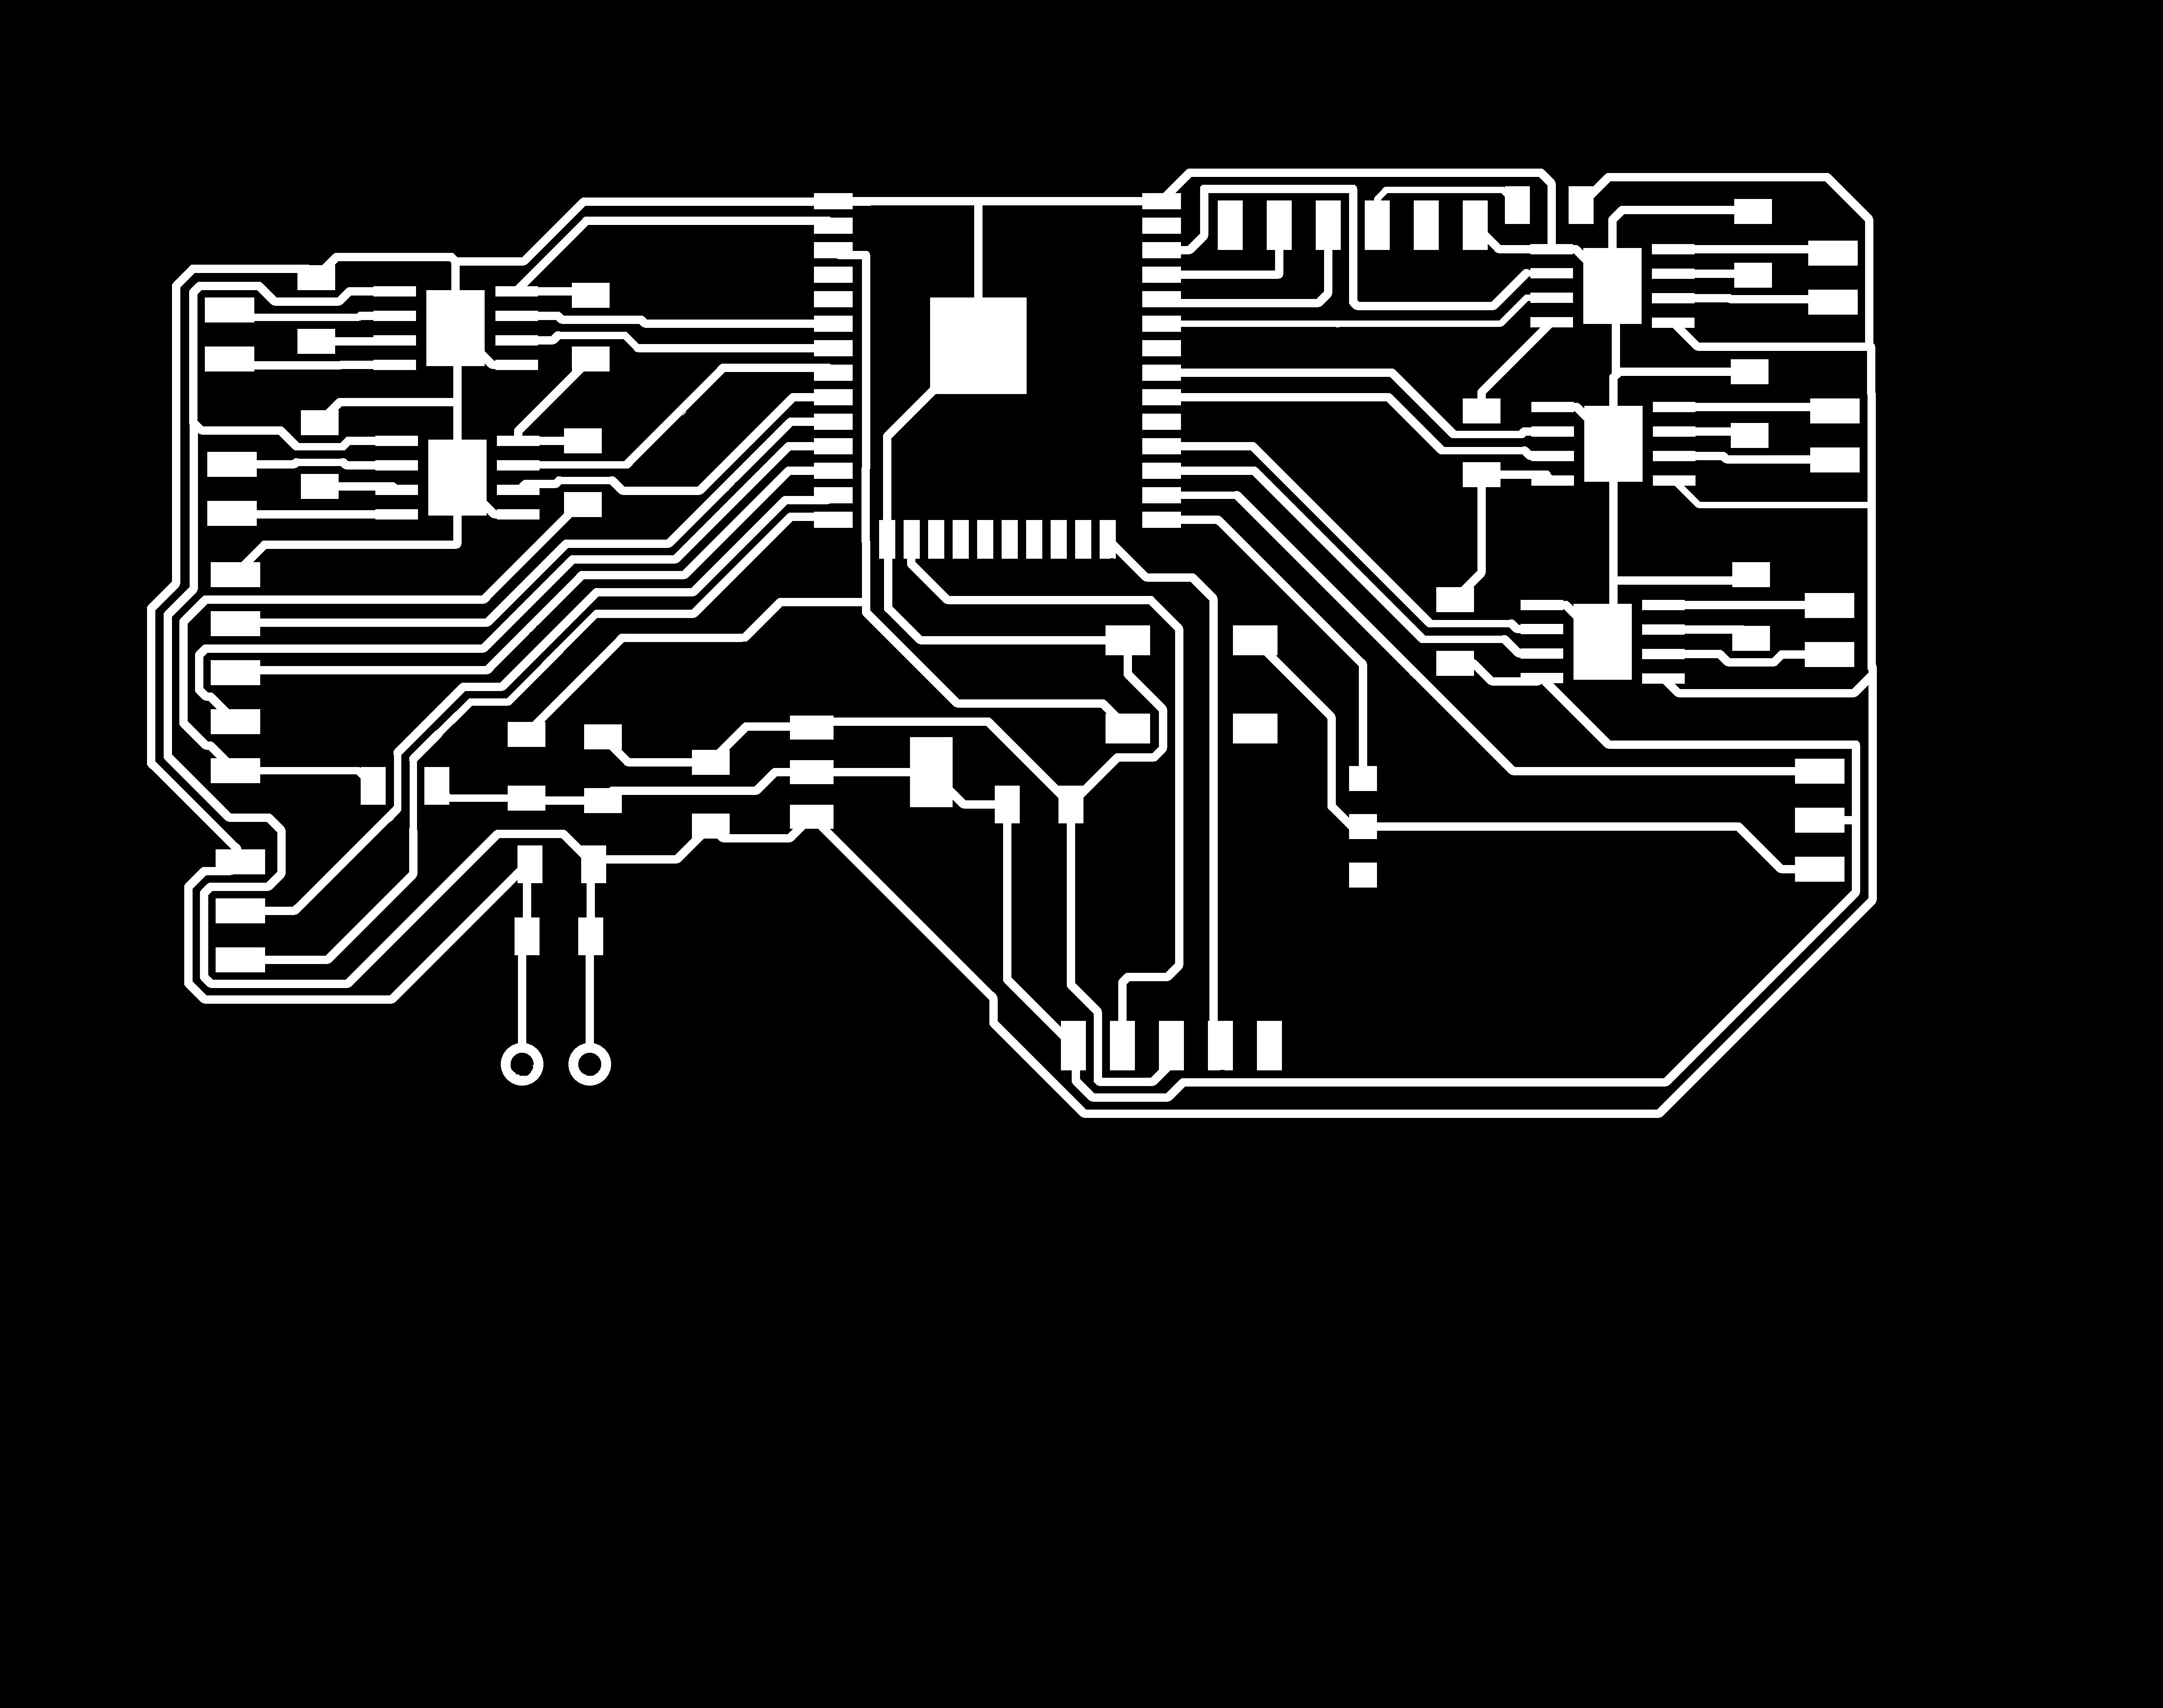
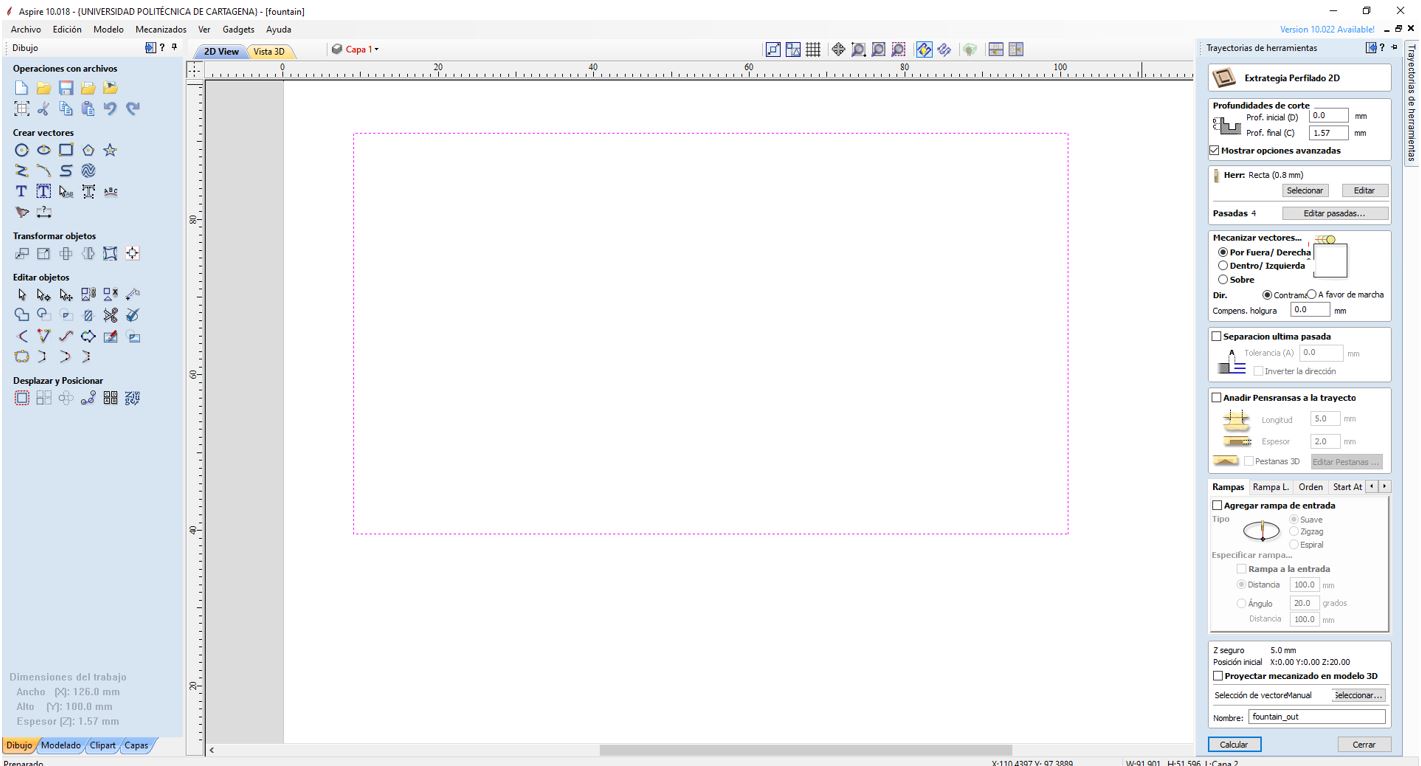
This is the image to mill the outer edge of my board.

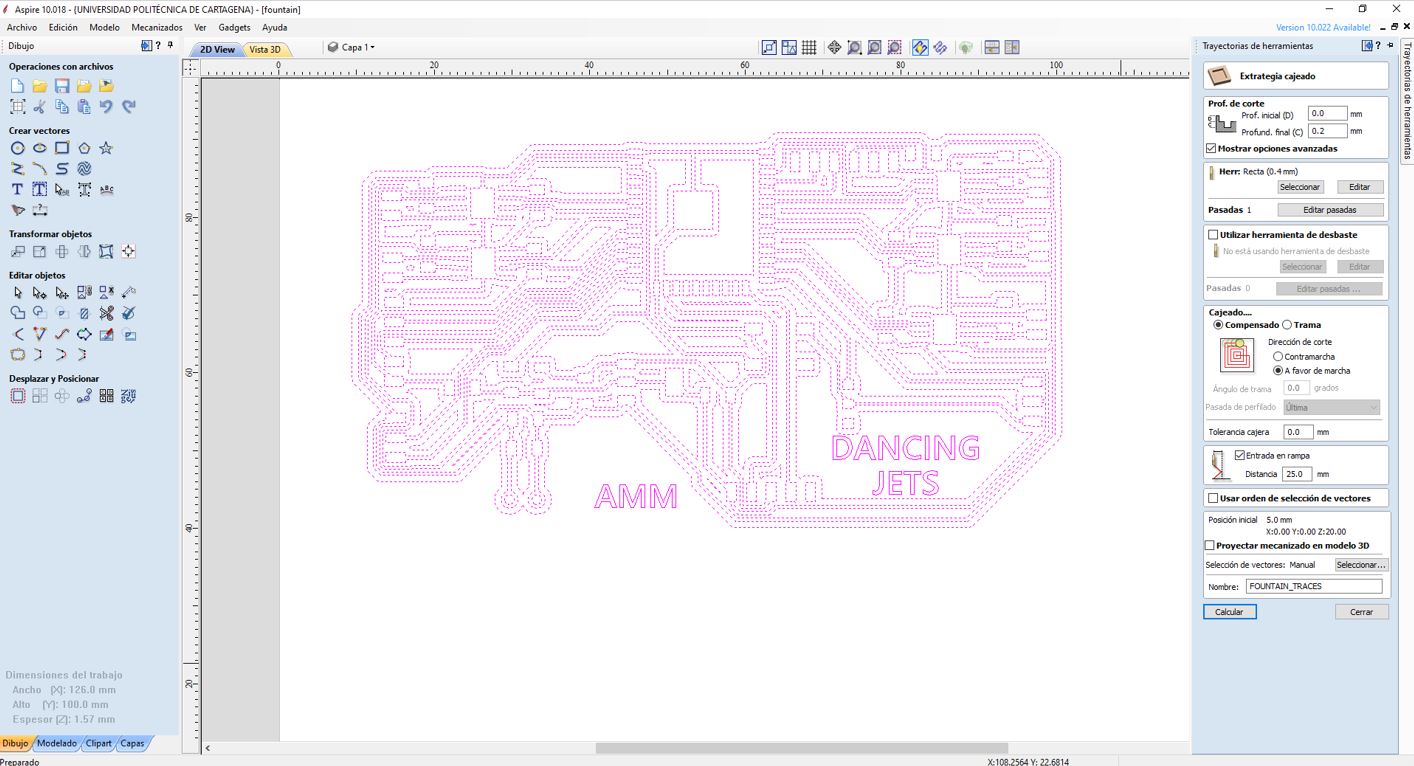
I use Aspire software to generate the gcodes.
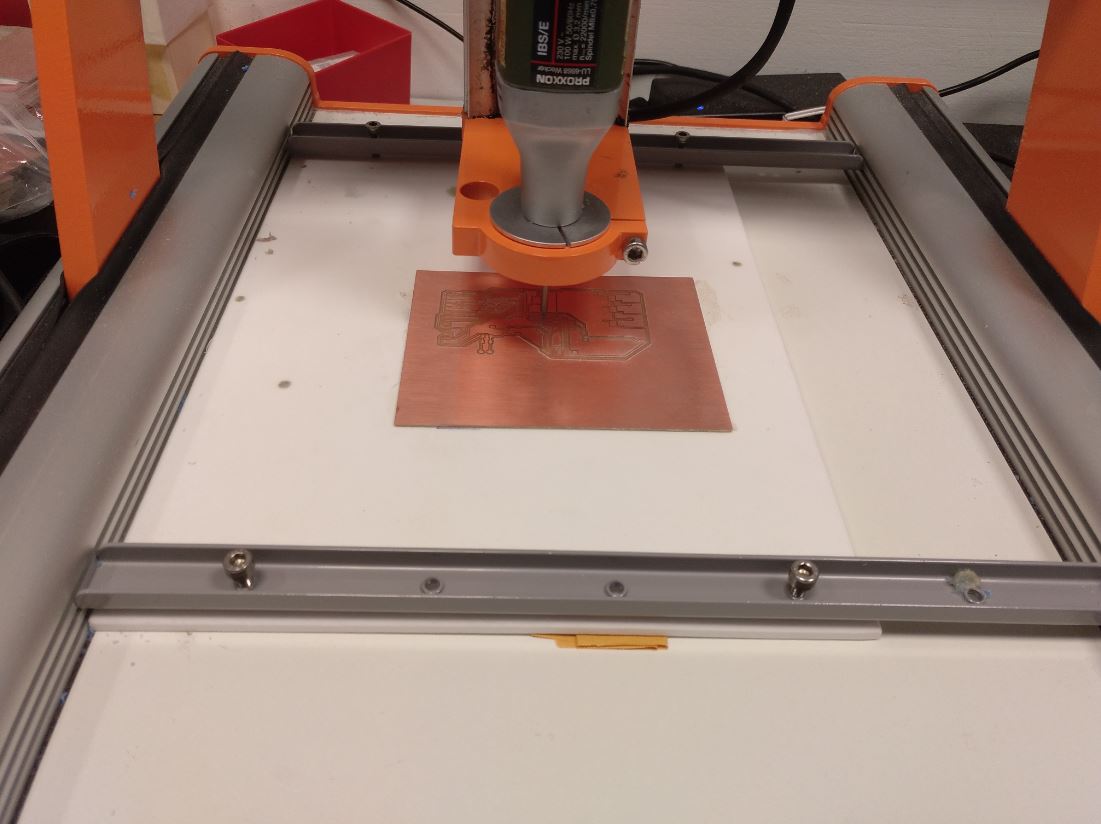
I use the Stepcraft420 milling machine to mill the board.
You can download Eagles files here.
10.1.2. Programming
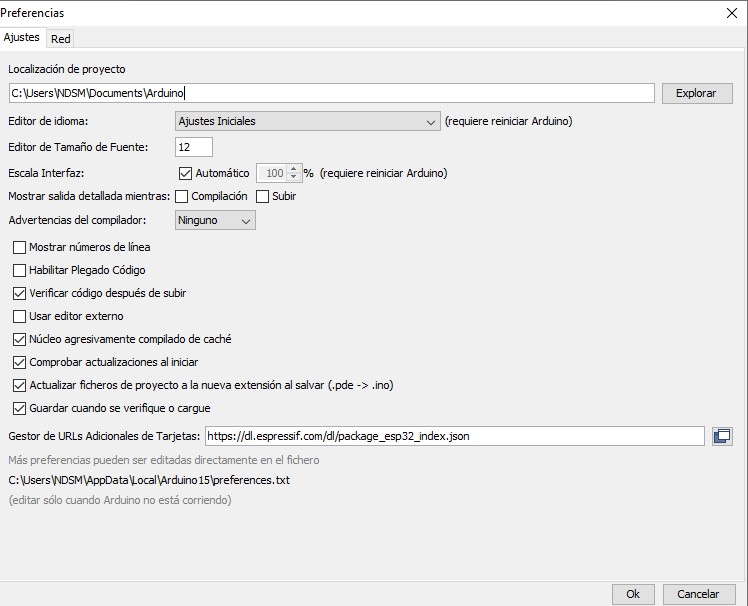
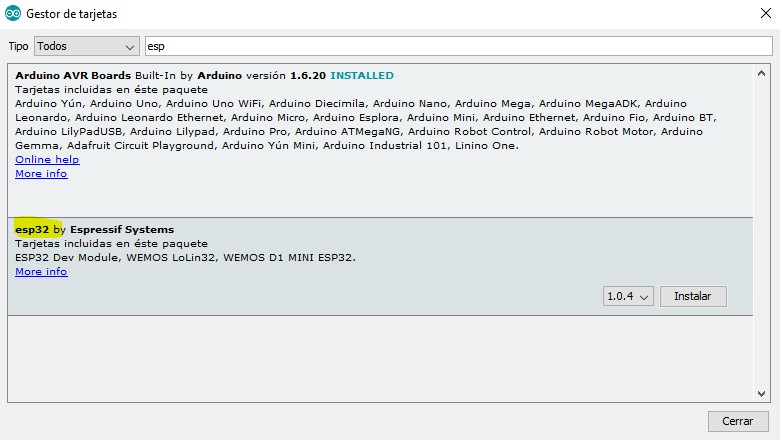
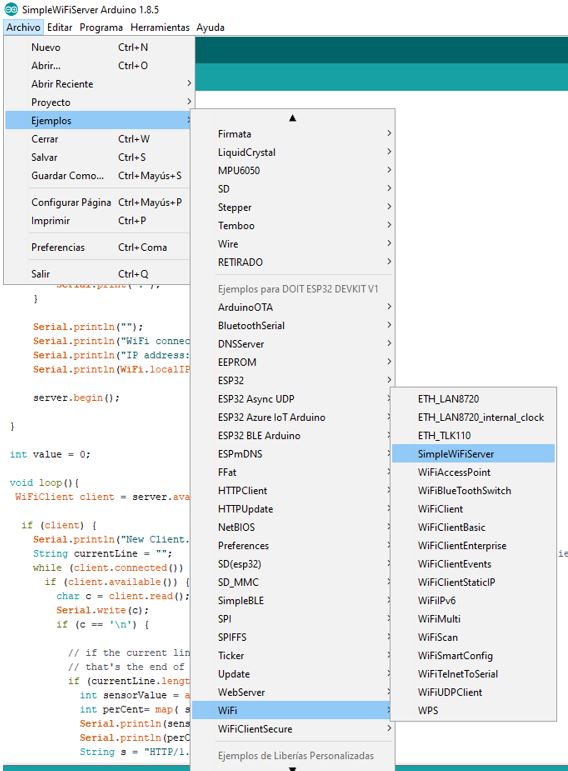
The first thing is to configure the Arduino IDE to program the ESP32.
I’m going to use the library “arduinoFFT.h” to analyze the audio that the microphone receives, separating the audio into frequency bands. So then I can link each jet of water to the different frequency bands.
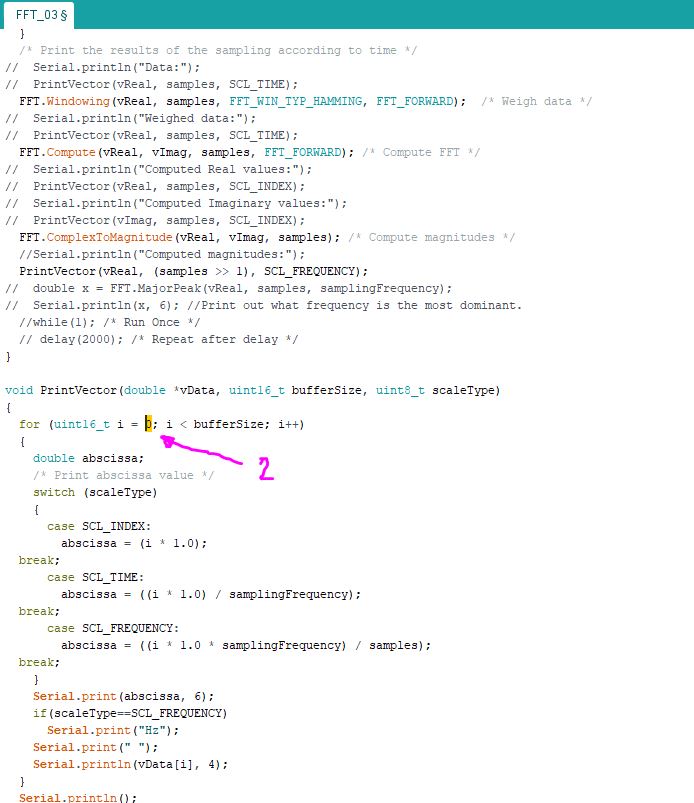
I start by testing the FFT_03 example.
The first 2 bands (i = 0 and i = 1) show a huge spike due to noise, so I’m not going to use them to control the fountain. I solve it by changing the initial value from i = 0 to i = 2.
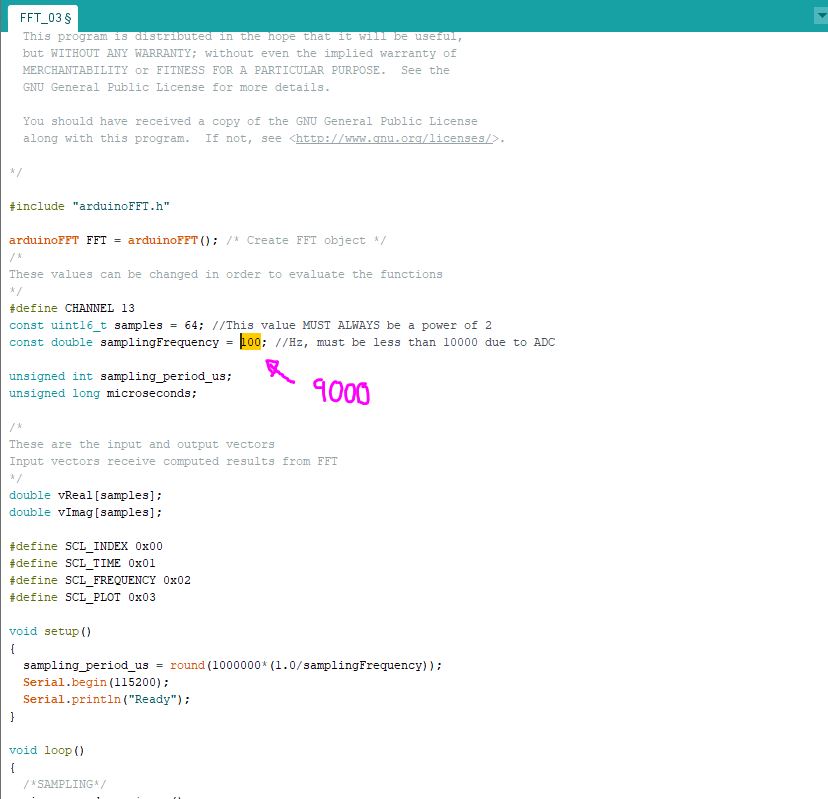
Now I am going to increase the sampling frequency to get more instantaneous information. I change the “samplingFrecuency” parameter from samplingFrecuency = 100 to samplingFrecuency = 9000
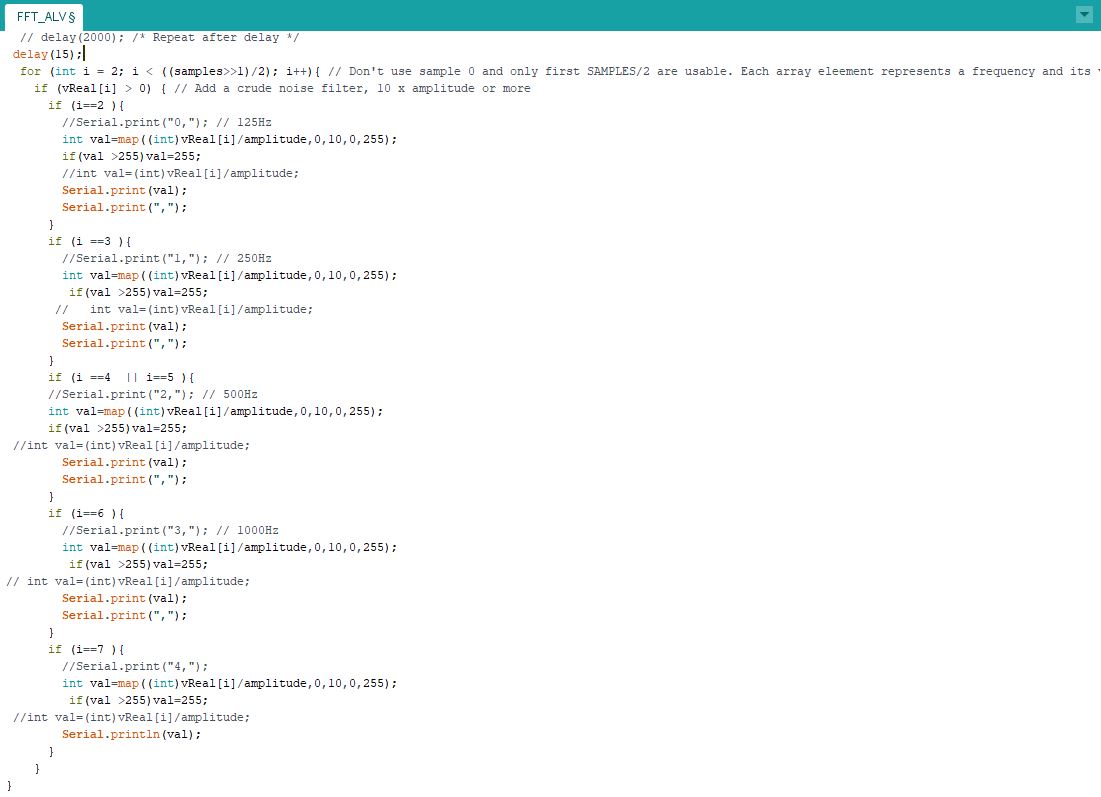
Finally, I modify the code to keep the most significant frequency bands. Also, I modify it to be able to visualize in the serial Plotter each band with a color.
You can download scripts here.
10.2. Group assignment
The Group Assignment page is at the following link.
The microphone on my board outputs an analog signal, I cannot access the building where the oscilloscope is, but I have been able to see the signal through the Arduino IDE serial plotter, as I have shown in my individual assignment. The microphone generates an analog signal with a waveform from 0 to 3.3v that the microcontroller reads, it applies the Fast Fourier Transform (FFT) to separate the signal into frequency bands, and using the SerialPlotter we can see each band represented by a colour.