Overview — Why I Built This
I built a full cloud-hosted web application at hive-monitor.com because I want to turn this into a real product. The key differentiator is the live camera view — other DIY hive monitors exist as hobby projects with basic sensor logging, but none of them offer a consumer-ready package with live video streaming from inside the hive entrance. That's the part that doesn't exist on the market right now. Being able to watch your bees come and go in real time from your phone, combined with environmental data, is what makes this more than just another temperature logger.
The Pi 5 I'm using is likely overkill for production (an 8GB Pi 5 at $80 is expensive for a consumer device), and some of the other components could be cheaper alternatives. Bringing the per-unit cost down to something a hobbyist beekeeper would pay is a major challenge I haven't solved yet. But for the proof of concept, I prioritized getting everything working reliably first.
The Web Application — What It Does Today
The dashboard is a full-stack web application hosted on AWS with a custom domain (hive-monitor.com) registered through Route 53. It's currently live and reporting real data from my Pi. Here's what's working:
- Live sensor reporting — all 3 SHT45 temperature/humidity sensors report in real time to the dashboard
- CPU temperature monitoring — the Pi's CPU temp is tracked and displayed, which is important because the Pi 5 runs hot (especially with dual cameras) and thermal throttling would degrade performance
- Multi-hive support — the system is designed for multiple hives from the start. You can add hives, give them names, and set their GPS locations
- Hive sharing — users can share access to their hives with other users (useful for beekeeping clubs or commercial operations with multiple managers)
- Map view — hives are displayed on a map with their GPS coordinates. You can change names and locations from the dashboard
- User authentication — full sign-up/login system so each beekeeper has their own account and hives
What I'm Still Working On
- UI aesthetics — the frontend works but needs design polish. It's functional, not pretty yet.
- Camera feed integration — live video streaming to the web dashboard (currently works locally, need to pipe it through the cloud)
- Historical data graphs — time-series charts for temperature, humidity, and weight trends
- Alert system — notifications when sensors go out of range or the hive loses connection
- Cost optimization — finding cheaper hardware alternatives for a consumer price point
How the Binding System Works
When a new Pi is flashed with the hive-monitor image and powered on, it needs to be "bound" to a specific hive in the dashboard. This is the zero-touch provisioning flow:
- Operator creates a hive in the web dashboard — gives it a name, location, and notes
- Pi boots up and starts polling the API with its CPU serial number: "Has anyone claimed me yet?"
- Operator claims the Pi in the dashboard by entering the serial number (printed on a sticker on the Pi)
- API returns a bind packet — contains the device certificate, private key, IoT endpoint, and hive configuration
- Pi installs the credentials and connects to AWS IoT Core over MQTT
- Dashboard shows the hive as online — sensor data starts flowing immediately
This means a customer would just plug in the Pi, open the app, scan or type the serial, and they're connected. No SSH, no command line, no technical knowledge required.
Custom Raspberry Pi Image
I built a custom Raspberry Pi OS image using pi-gen (the official Raspberry Pi image builder). The image comes pre-configured with everything the hive monitor needs — the agent software, systemd services, firewall rules, and bootstrap configuration are all baked in at build time. A beekeeper just flashes the image to an SD card, inserts it, and powers on. The CI pipeline builds new images automatically from the repo on every release.
Architecture — How Data Flows
┌─────────────┐         ┌──────────────────┐         ┌─────────────────┐
│  Pi in the  │  MQTT   │   AWS IoT Core   │  Event  │  Cloud Backend  │
│  Beehive    │────────▶│   (us-east-1)    │────────▶│  (API + DB)     │
│             │  8883   │                  │  Rules  │                 │
│ • Sensors   │◀────────│  Device Shadow   │         │ • User auth     │
│ • Cameras   │  cmds   │  (state sync)    │         │ • Hive CRUD     │
│ • Servo     │         └──────────────────┘         │ • Data storage  │
│ • LEDs      │                                      │ • Sharing       │
└─────────────┘                                      └────────┬────────┘
                                                              │
                                                              │ HTTPS
                                                              ▼
                                                     ┌─────────────────┐
                                                     │  Web Dashboard  │
                                                     │  hive-monitor   │
                                                     │  .com           │
                                                     │                 │
                                                     │ • Live sensors  │
                                                     │ • CPU temp      │
                                                     │ • Map view      │
                                                     │ • Multi-hive    │
                                                     │ • User sharing  │
                                                     └─────────────────┘
Hero Shot — Dashboard
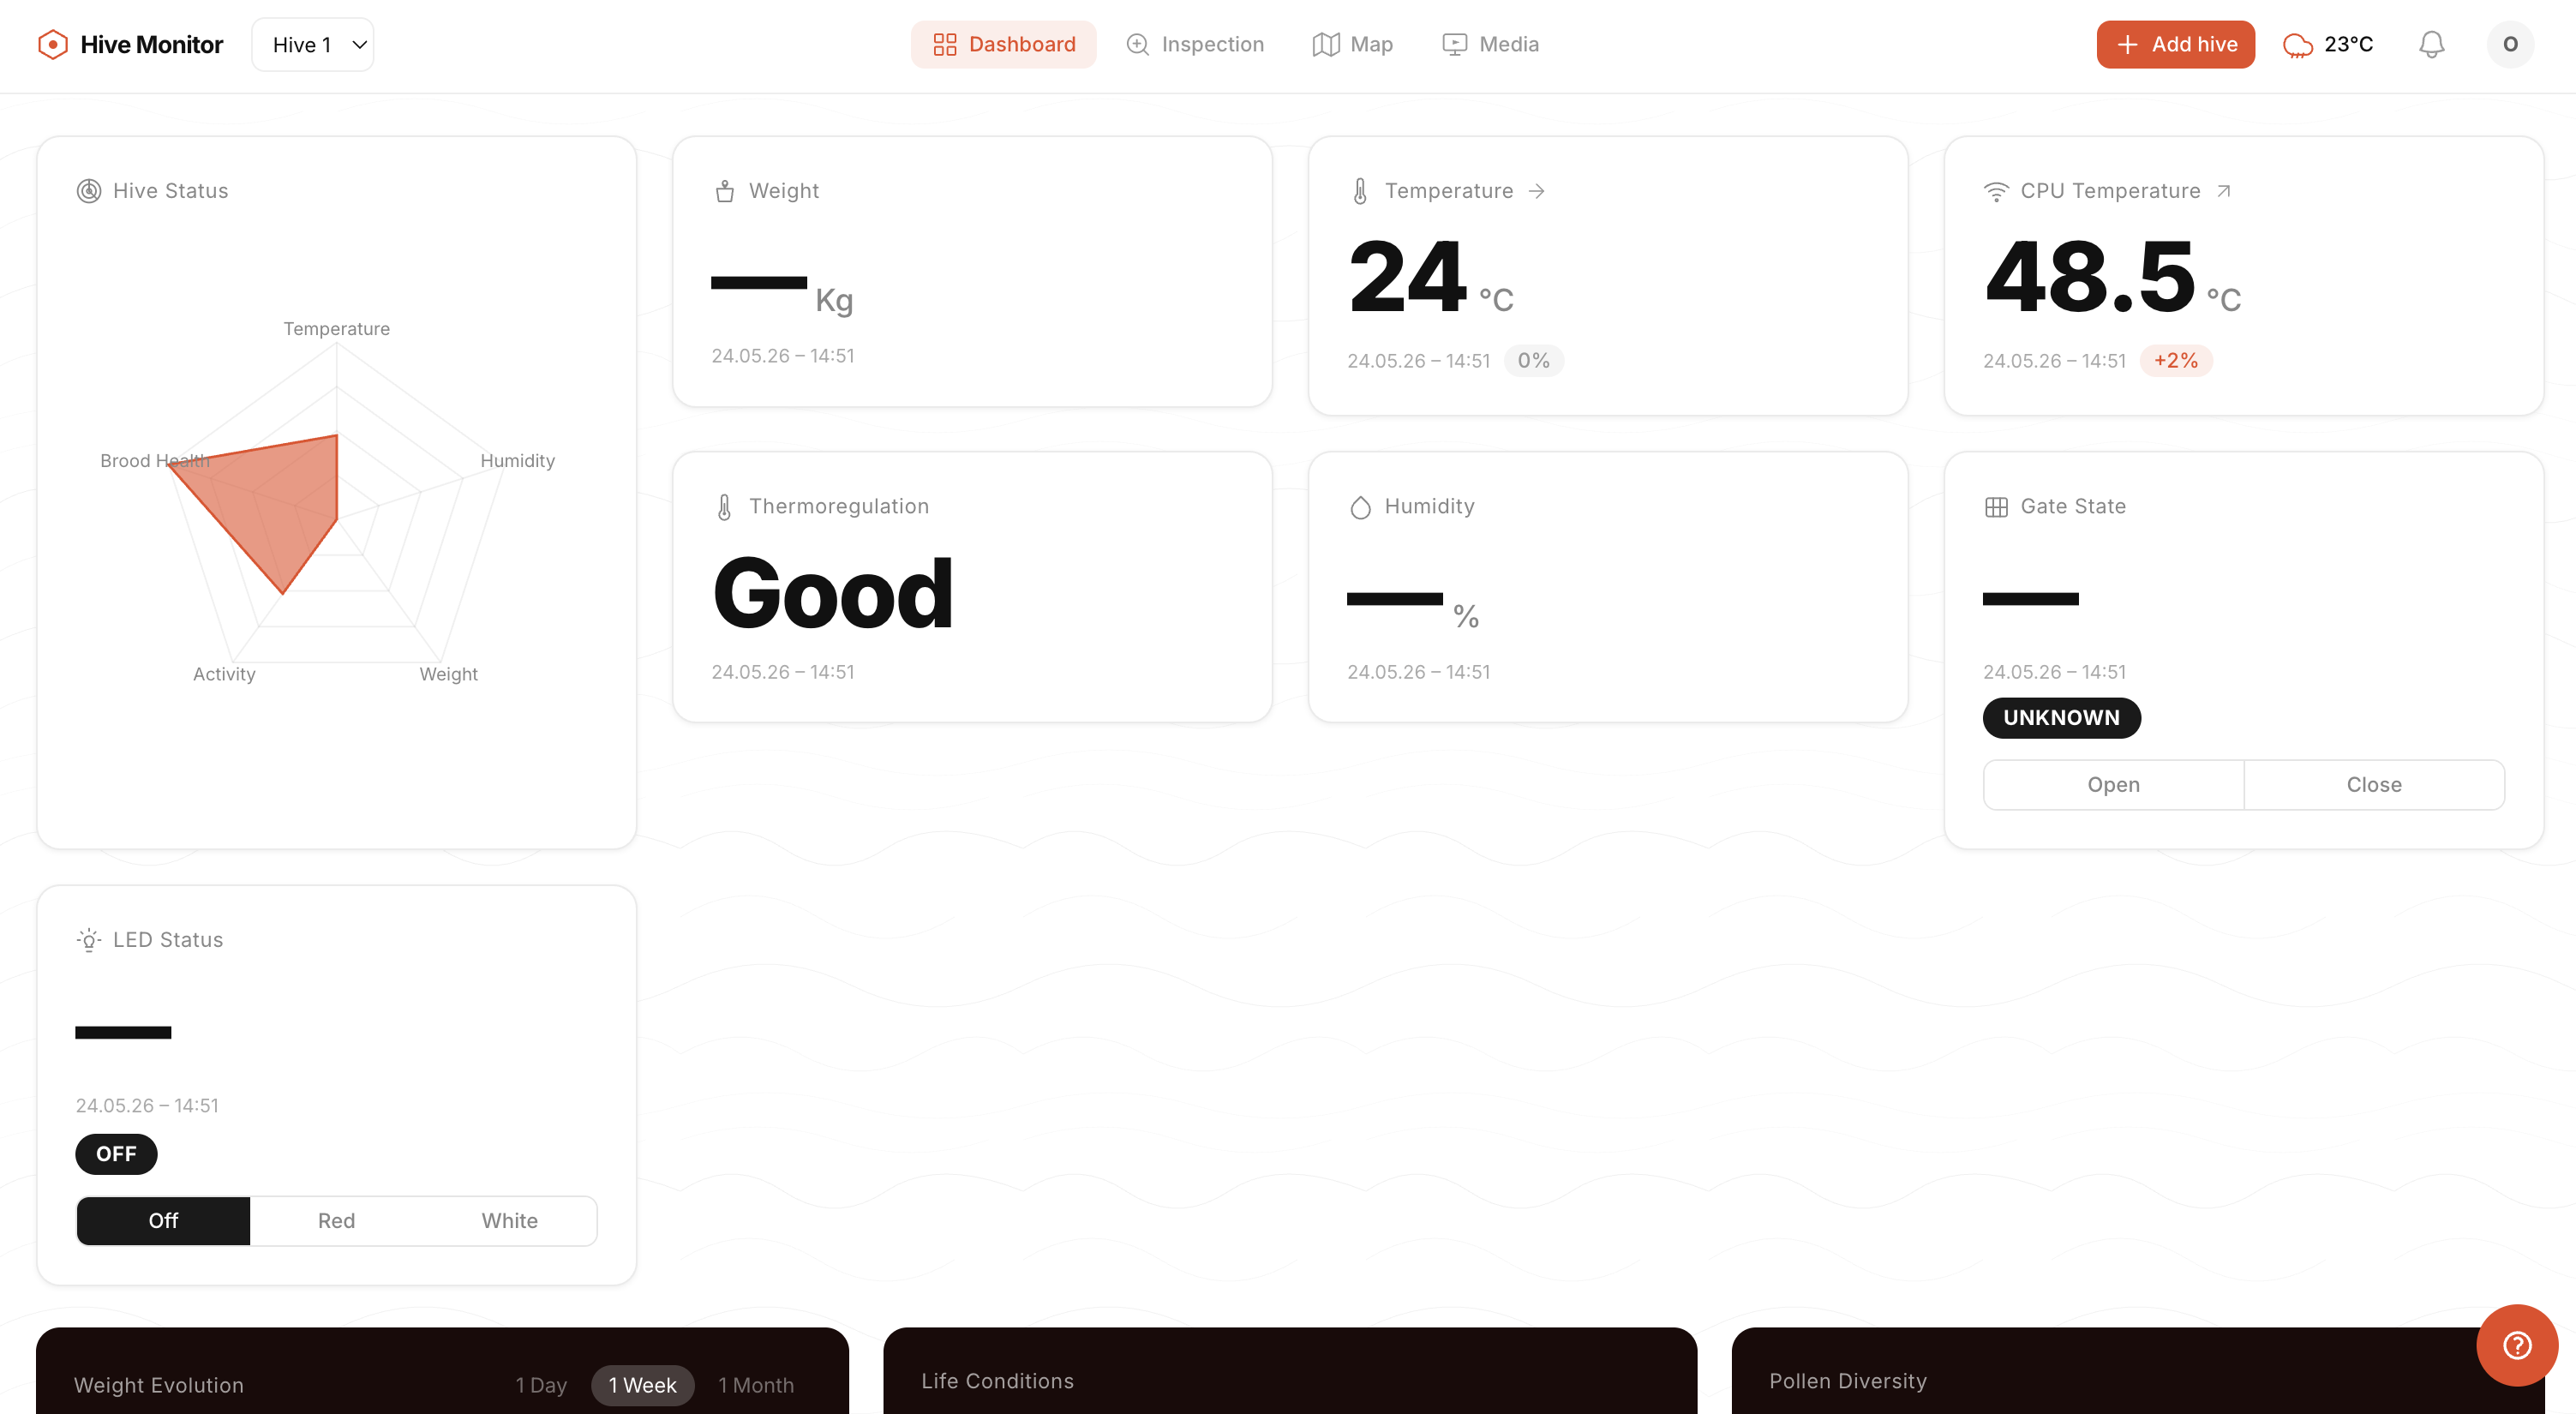
Hive Monitor dashboard — live sensor readings with interactive graphs. Each graph is interactive (hover for values, zoom, pan). Currently working on displaying each sensor individually rather than aggregated.
Building the Dashboard — Step by Step
Here's how the dashboard was constructed from scratch. The system has three main parts: a React frontend, a Spring Boot backend API, and the Pi agent. You can run the frontend and backend locally without any hardware.
Prerequisites
- Node.js ≥ 18 — frontend build tooling
- Java JDK 21 — backend compilation and runtime
- Python ≥ 3.11 — Pi agent development
- AWS account (free tier works for dev) — IoT Core, SQS, S3, ECS, RDS
- Docker — backend container builds
1. Frontend — Create the Project
# Scaffolded with Vite React template
npm create vite@latest frontend -- --template react
cd frontend
npm install

# Core dependencies
npm install react-router-dom recharts zustand axios leaflet react-leaflet
npm install -D tailwindcss @tailwindcss/vite vitest @testing-library/react
2. Frontend Architecture
src/
├── components/
│   ├── layout/          App shells: TopBar, DashboardLayout
│   ├── dashboard/       Reusable dashboard widgets
│   ├── charts/          Recharts wrappers
│   └── ui/              Buttons, spinners, toasts, modals
├── pages/
│   ├── dashboard/
│   │   ├── DashboardPage.jsx    Single-hive view
│   │   ├── DashboardGrid.jsx    CSS Grid that arranges all cards
│   │   └── cards/               Individual metric cards
│   ├── auth/            Login, register
│   ├── hive/            Hive setup wizard
│   ├── map/             Leaflet map page
│   └── settings/        Account settings
├── stores/              Zustand stores (sensor data, notifications)
├── contexts/            React Context (auth, WebSocket, units)
├── hooks/               Custom React hooks
└── lib/                 Axios instance, WebSocket URL builder
3. How the Dashboard Grid Layout Works
The dashboard uses CSS Grid via Tailwind classes. Cards are rendered in source order — the grid fills left→right, top→bottom. To reposition a card, move its component tag in the JSX.
// DashboardGrid.jsx — how cards are positioned
<div className="space-y-4 md:space-y-6">
  {/* Top section: 4-column grid on desktop */}
  <section className="grid grid-cols-1 md:grid-cols-4 gap-4">
    <div className="md:row-span-2">
      <RadarChartCard />
    </div>
    <ConnectionStatusCard />
    <WeightMetricCard />
    <TemperatureMetricCard />
    <SystemDiagnosticsCard />
    <ThermoregulationCard />
    <GateStateCard />
    <LEDStatusCard />
  </section>

  {/* Mid section: 3-column grid */}
  <section className="grid grid-cols-1 md:grid-cols-3 gap-4">
    <WeightEvolutionCard />
    <LifeConditionsCard />
  </section>
</div>
How to put temperature on the left: Move <TemperatureMetricCard /> before <WeightMetricCard /> in the JSX. The grid fills left-to-right.
How to span full width: Add className="md:col-span-3" to the card wrapper.
How to add a new card: Create it in src/pages/dashboard/cards/, import in DashboardGrid.jsx, place in desired position.
4. State Management — Zustand
// src/stores/sensorStore.js
import { create } from 'zustand'

export const useSensorStore = create((set) => ({
  readings: {},  // { [hiveId]: { temperature, humidity, weight, ... } }
  setReading: (hiveId, reading) =>
    set((state) => ({
      readings: { ...state.readings, [hiveId]: reading }
    })),
}))

// In a card component:
function TemperatureMetricCard() {
  const reading = useSensorStore((state) => state.readings[hiveId])
  return <div>{reading?.temperature}°C</div>
}
5. Backend — Spring Boot API
The backend is a Java 21 Spring Boot application (Gradle build). Key pieces:
- Spring Data JPA + PostgreSQL — persistent storage (hives, users, settings)
- Flyway — database migrations (versioned SQL files)
- Spring WebSocket — pushes real-time sensor data to the frontend
- AWS SDK v2 — IoT Core, SQS, S3, Athena integration
- JWT authentication — access + refresh tokens
- Local dev mode — H2 in-memory DB, no AWS needed
# Run locally (no AWS, H2 database)
cd backend
./gradlew bootRun --args='--spring.profiles.active=local'
# API on http://localhost:8080
6. Data Flow — End to End
Pi (sensors) → MQTT → AWS IoT Core
  ├─→ IoT Rule 1 → Firehose → S3/Iceberg  [historical]
  └─→ IoT Rule 2 → SQS queue              [real-time]
                      ↓
Spring Boot API (ECS) ← polls SQS
  → in-memory cache → WebSocket broadcast
                      ↓
React Frontend (CloudFront)
  ← WebSocket /ws/sensors → Zustand → Cards re-render
7. Running Locally (No AWS Needed)
# Terminal 1 — Backend
cd backend && ./gradlew bootRun --args='--spring.profiles.active=local'

# Terminal 2 — Frontend
cd frontend && npm install && npm run dev
# Dashboard on http://localhost:5173
Locally you get: user auth, hive CRUD, dashboard rendering with seed data, WebSocket connections. Real sensor data requires the Pi + AWS IoT Core.
Hardware Required for Full System
- Raspberry Pi 5 (reads sensors, publishes MQTT)
- PoE HAT + Ethernet (power + network)
- SHT45 sensors + I²C multiplexer (temperature/humidity)
- HX711 + load cells via ESP32-C6 (weight)
- AWS account (IoT Core, SQS, ECS, RDS, S3, CloudFront)
- Custom domain ~$12/year (Route 53)
Product Vision — Why This Matters
Smart hive monitors exist as DIY projects on forums and GitHub, but nobody is selling a complete, plug-and-play system that a non-technical beekeeper can set up in 5 minutes. The market is wide open. My goal is to get a working proof of concept this summer, validate it with real beekeepers, and then figure out the manufacturing and cost reduction needed to make it a viable product. The software side (cloud dashboard, mobile app, fleet management) is where the real value is — the hardware is relatively straightforward once the cost is optimized.
Dashboard Framework & Technology Stack
The web dashboard at hive-monitor.com is built with:
- React 19 — component-based frontend framework. Each dashboard card (temperature, humidity, LED status, gate state, CPU temp) is an independent React component that receives data from the global store and re-renders when the state changes.
- Vite — build tool and dev server. Provides fast hot-module replacement during development and optimized production builds.
- Tailwind CSS 4 — utility-first CSS framework for styling all layout and components. No custom CSS files — everything is composed from Tailwind utility classes directly in the JSX.
- Recharts — React charting library for the temperature/humidity time-series graphs. Supports interactive hover, zoom, and pan on the sensor data charts.
- React Leaflet — interactive map component for displaying hive locations with GPS coordinates.
- React Router — client-side routing between dashboard pages (overview, individual hive, map, settings).
Dashboard Layout Design — How I Chose the Panel Layout
The dashboard uses a card-based grid layout where each piece of data gets its own card. I organized the cards by priority — what a beekeeper needs to see first:
| Card |
Data Shown |
Why It's There |
| Hero Card | Hive name, status, last seen | First thing you see — is the hive online? |
| Temperature Cluster | 3× SHT45 readings (brood, super, ambient) | Core health indicator — brood temp tells you if the queen is laying |
| Weight Evolution | Hive weight over time (Recharts line graph) | Tracks honey flow and colony growth |
| Gate State | Open/closed + remote control button | Emergency close during pesticide spraying or transport |
| LED Status | Which LEDs are on (white/red/off) | Confirms camera lighting state |
| CPU Temperature | Pi 5 thermal reading | Alerts if Pi is overheating (throttle = degraded performance) |
| Connection Status | Online/offline + last heartbeat | Detect network outages or hardware failures |
| System Diagnostics | Uptime, memory, disk usage | Operational health of the Pi itself |
The grid is responsive — on desktop it shows 3-4 cards per row, on mobile they stack vertically. Each card component fetches its data from a shared Zustand store that receives real-time updates from the backend via WebSocket (for instant updates) or polling (as fallback).
LED Control — How the Dashboard Talks to AWS to Control the Lights
When a user clicks the LED toggle on the dashboard, here's the full path from click to light:
- Dashboard (React) — user clicks "LED On" button → sends POST request to the backend API
- Backend API — receives the request, validates the user's auth token, then publishes an MQTT message to AWS IoT Core on the topic
hives/{hive_id}/led/command
- AWS IoT Core — routes the message to the Pi's MQTT subscription
- Pi Agent (Python) — receives the MQTT message on the subscribed topic, parses the command JSON
- GPIO (gpiod) — the agent calls
led_line.set_value(1) which drives GPIO 17 HIGH → MOSFET gate goes to 3.3V → LEDs turn on
- Confirmation — the Pi publishes its updated state back to IoT Core via the device shadow, which the dashboard reads to confirm the LEDs are actually on
# Simplified LED command handler on the Pi (from the hive-monitor agent)
import gpiod
import json

LED_PIN = 17
chip = gpiod.Chip('gpiochip4')
led_line = chip.get_line(LED_PIN)
led_line.request(consumer="led-control", type=gpiod.LINE_REQ_DIR_OUT)

def on_led_command(topic, payload):
    """Called when MQTT message arrives on hives/{id}/led/command"""
    cmd = json.loads(payload)
    if cmd.get("state") == "on":
        led_line.set_value(1)  # GPIO HIGH → MOSFET on → LEDs on
    else:
        led_line.set_value(0)  # GPIO LOW → MOSFET off → LEDs off
    # Report new state back to device shadow
    report_shadow({"led_state": cmd.get("state")})
The round-trip from button click to LEDs physically turning on takes about 200-500ms depending on network latency. The device shadow ensures that even if the dashboard disconnects and reconnects, it always shows the current actual state of the LEDs.