Appearance
Week 9 - Input devices
Group Assignment
- probe an input device's analog levels and digital signals
Group working
Input Devices
Input devices are components that receive and process incoming data and instructions. They translate the data into a binary code format composed of electrical signals, which can be interpreted by the digital computer. These devices feed data that can later be measured or analyzed. Common examples of input devices include keyboards, mice, scanners, and sensors. Input devices play a crucial role in allowing users to interact with computers and provide the necessary data for processing and analysis.
Introduction to Sensors
Sensors are specialized input devices that detect and react to specific types of input from the physical environment, such as light, heat, motion, moisture, pressure, or other environmental phenomena. They convert these physical inputs into electrical signals that can be measured and analyzed. Sensors are essential for various applications, from industrial automation to home automation systems. They enable systems to monitor and respond to environmental changes effectively.
There are two main types of sensors:
- Analog Sensors: Analog sensors provide a continuous range of data, where the signal varies smoothly over time. These sensors can measure a wide range of values and provide detailed information about the physical environment. Examples of analog sensors include thermistors, potentiometers, and photoresistors.
- Digital Sensors: Digital sensors produce discrete signals with distinct values, typically represented as either "low" or "high" (binary values). These sensors are simpler and often faster than analog sensors, making them suitable for applications where precise timing and quick responses are needed. Examples of digital sensors include digital temperature sensors, infrared sensors, and magnetic reed switches.
Sensors play a crucial role in various applications, enabling systems to interact with and respond to their surroundings effectively. By providing real-time data, sensors help automate processes, improve efficiency, and enhance safety in numerous industries.
Testing an ultrasonic sensor input
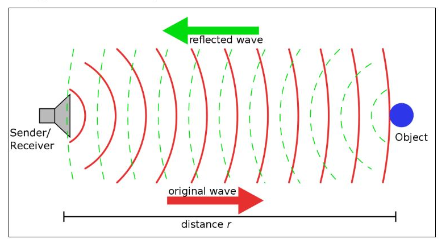
I have used an oscilloscope to detect the input signal from a ultrasonic sensor HC-SR04. The HC-SR04 is a popular ultrasonic sensor used for measuring distances. It operates by emitting ultrasonic sound waves at a frequency of 40 kHz and then listening for the echo that bounces back from an object. The HC-SR04 can measure distances from 2 cm to 400 cm with an accuracy of 0.3 cm, making it suitable for various hobbyist and educational projects. Here's a brief explanation of how it works:
- Emitting Sound Waves: The sensor has a transmitter (trig pin) that sends out a high-frequency sound wave.
- Receiving Echo: The sound wave travels through the air until it hits an object and bounces back as an echo.
- Measuring Time: The sensor has a receiver (echo pin) that detects the returning sound wave. The time taken for the sound wave to travel to the object and back is measured.
- Calculating Distance: Using the speed of sound in air (approximately 343 meters per second), the distance to the object is calculated with the formula: Distance = (Speed of sound * Time) / 2 . The division by 2 accounts for the sound wave traveling to the object and back.
The diagram below gives you a straight illustration of how ultrasonic sensor work.
To begin the test, first I need to connect the ultrasonic sensor to our Ardiuno broad. The ultrasonic sensor's trig pin is connected to Arduino pin 2, the echo pin is connected to Arduino pin 3, and it is powered by connecting the GND and VCC pins to the Arduino's GND and 5V, respectively. Then the code for testing was uploaded as below. This code essentially triggers the ultrasonic sensor to send out an ultrasonic pulse, and the echo pin would later be used to measure the time it takes for the pulse to return, which can be used to calculate the distance to an object.
const int trigPin = 2;
const int echoPin = 3;

void setup() {
  pinMode(trigPin, OUTPUT);
  pinMode(echoPin, INPUT);
  digitalWrite(trigPin, LOW); // Ensure the trigPin is low at the start
}

void loop() {
  digitalWrite(trigPin, HIGH); // Send a HIGH signal to the trigPin
  delayMicroseconds(10); // Maintain the HIGH signal for 10 microseconds
  digitalWrite(trigPin, LOW); // Set the trigPin back to LOW
  delay(100); // Wait for 100 milliseconds before repeating the loop
}
To measure the waveform of the ultrasonic sensor's signal using an oscilloscope, follow these steps:
- Connect the Ground: Connect the oscilloscope's ground (GND) probe to the Arduino's ground (GND).
- Connect the Trigger Signal: Connect the oscilloscope's probe to the trig pin (pin 2 on the Arduino) to observe the trigger signal.
- Connect the Echo Signal: Connect the oscilloscope's second probe (if available) to the echo pin (pin 3 on the Arduino) to observe the echo signal.
The oscilloscope in the image below has key settings configured for measurement: the vertical scale for Channel 1 & 2 is set to 5 volts per division (5 V/div), and the timebase (horizontal scale) is set to 1 microsecond per division (1 µs/div), indicating how the waveform is represented on the screen.
The video for measurement shows the result. We can see that the echo signal length change with hand movement.
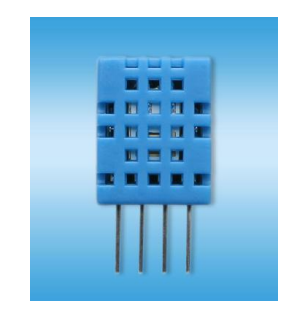
Testing a DHT-11 temperature & humidity sensor input
The DHT11 is a basic, low-cost digital sensor used to measure temperature and humidity. It includes a capacitive humidity sensor and a thermistor to sense the surrounding air, and communicates via a single-wire digital signal, making it easy to interface with microcontrollers such as Arduino or ESP32. See datasheet for DHT-11.
Key Specifications:
- Temperature Range: 0°C to 50°C ± 2°C
- Humidity Range: 20% to 90% RH ± 5%
- Sampling Rate: 1 Hz (one reading per second)
- Operating Voltage: 3.3V to 5.5V
- Output Type: Digital (single-wire serial interface)
The DHT11 transmits temperature and humidity data as a digital pulse train, where logical "1" and "0" are represented by different pulse widths. To observe the digital communication waveform from the DHT11 sensor using an oscilloscope, follow these steps:
1. Wiring Setup
- VCC → Connect to 5V (or 3.3V depending on your board)
- GND → Connect to GND of the microcontroller and oscilloscope
- DATA → Connect to a digital input pin (e.g., D1 on XIAO-ESP32C3) and to the oscilloscope probe
2. Arduino Example Code for DHT11
Make sure the Arduino is running code that initiates communication with the DHT11 sensor. Use a library like DHT.h to make the process easier:
#include <DHT.h>
#define DHTPIN 1
#define DHTTYPE DHT11
DHT dht(DHTPIN, DHTTYPE);

void setup() {
  Serial.begin(9600);
  dht.begin();
}

void loop() {
  float h = dht.readHumidity();
  float t = dht.readTemperature();
  Serial.print("Humidity: "); Serial.print(h);
  Serial.print(" %\t");
  Serial.print("Temperature: "); Serial.print(t);
  Serial.println(" *C");
  delay(2000);
}
3. Connect Oscilloscope Probes
- Probe 1 (CH1): Connect to the DATA line (DHT11 data pin or Arduino D2)
- Ground clip: Connect to the common GND
4. Oscilloscope Configuration
- Timebase: Set to approximately 50 µs/div to capture the bit pulses
- Voltage scale: Set to 800 mV/div, which is typically sufficient
- Trigger: Set to either rising or falling edge on CH1 to stabilize the waveform
- Memory depth: Increase this if your oscilloscope supports it, to capture the full transmission sequence
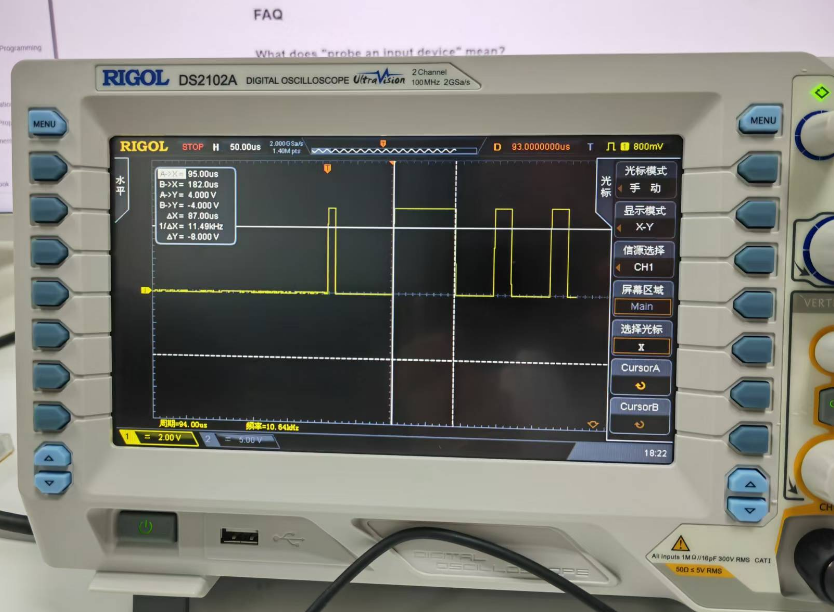
5. Observe the Waveform
A full DHT11 transmission includes:
- start signal
- Sensor response
- 40 bits of data, structured as:
- 8 bits: humidity (integer part)
- 8 bits: humidity (decimal part)
- 8 bits: temperature (integer part)
- 8 bits: temperature (decimal part)
- 8 bits: checksum Use the oscilloscope's cursors or time markers to analyze pulse width and manually decode the digital data if needed. See result video: