Web Page
The web page was created to monitor the real-time operation of the propellers and other components of the wind energy wall prototype. This monitoring system is essential for evaluating the performance and efficiency of the prototype, as it allows the collection of data regarding energy generation and the status of each component under real operating conditions. Additionally, it provides an intuitive interface where users can view charts and statistics about the energy produced, facilitating analysis and decision-making for future improvements and research.
The development of the web page also ensures data accessibility from anywhere at any time, offering a practical solution for managing and supervising the prototype remotely. By integrating advanced technologies such as Next.js and APIs connected to the XIAO ESP32 microcontroller, the page not only enables effective monitoring but also offers the potential to expand the system to include more control and tracking modules.
Interface design
The interface design was done using Figma and developed in two stages: an initial sketch and the final design. The first version was a quick draft without any benchmarking to see how similar pages structured their layouts. From the start, the idea was to simulate a dashboard layout, so there’s no navbar—just the header. Below is the first design with an explanation of each part.
Figma
Figma is a cloud-based design and prototyping tool widely used for creating user interfaces, websites, and mobile applications. Known for its collaborative capabilities, Figma allows multiple users to work on a design simultaneously, making it ideal for team-based projects. With features like vector editing, component libraries, and real-time feedback, Figma streamlines the design process from ideation to final output. Its browser-based platform means it requires no downloads, and it is accessible on any device, enabling designers and developers to share, review, and iterate on projects seamlessly.
First design
Wind wall web page
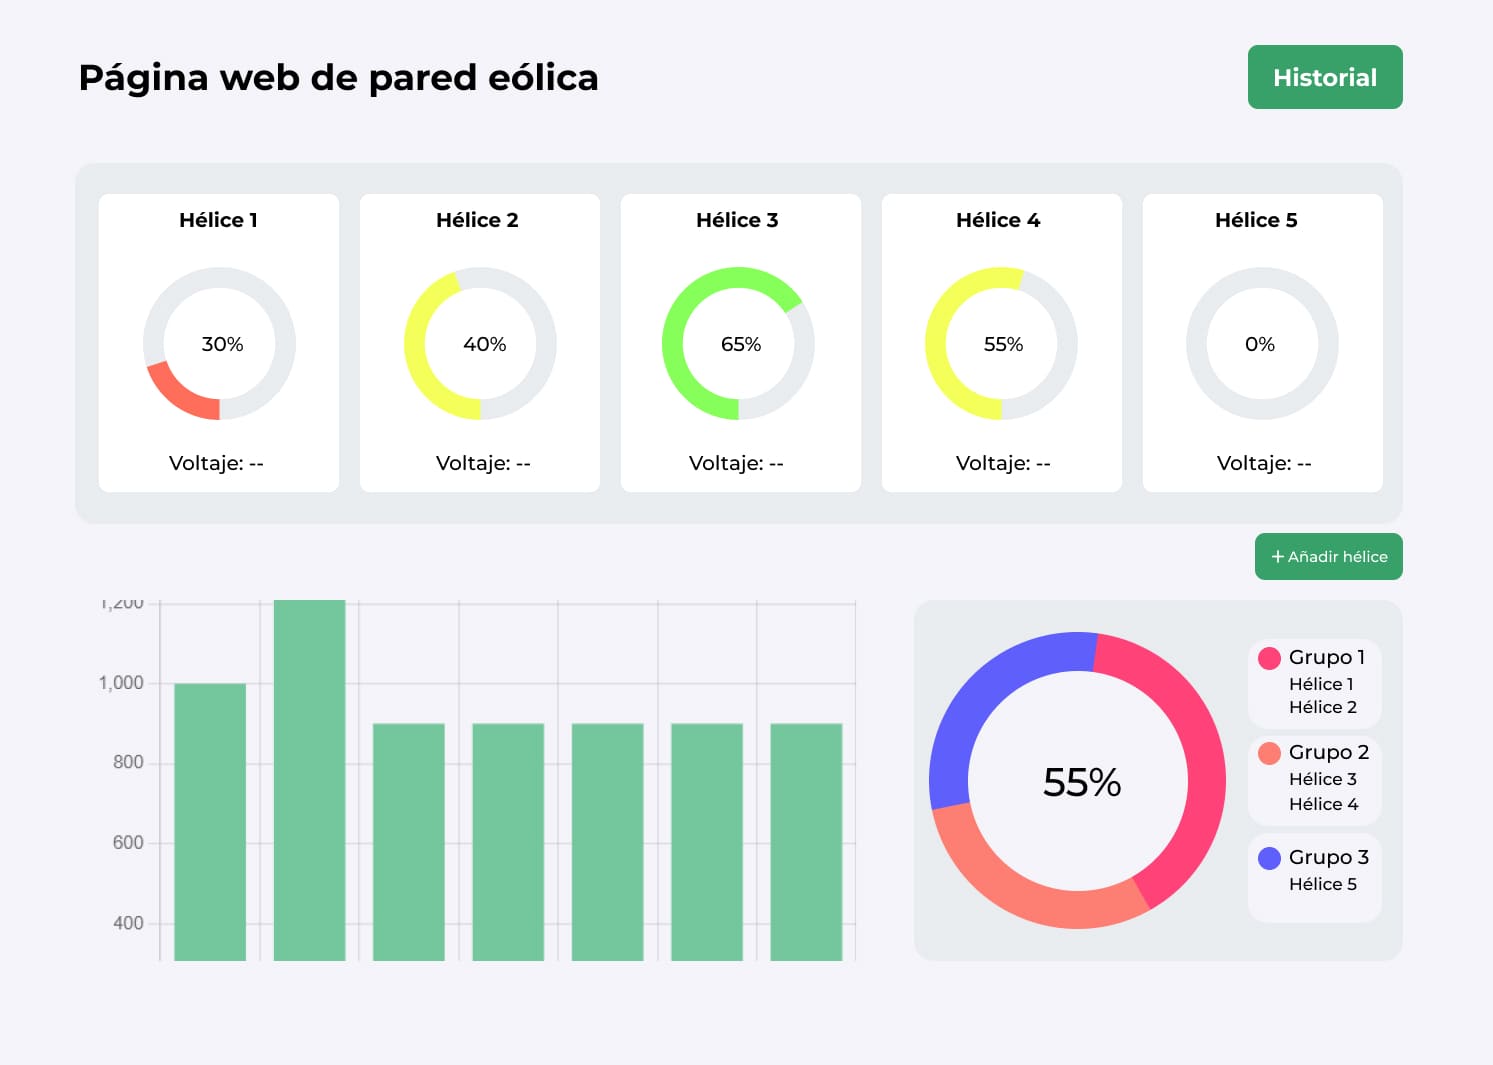
1. Header: In the upper left corner, the title "Wind Wall Web Page" is displayed, indicating the purpose of the page.
2. History Button: In the upper right corner, there is a green button labeled "History" to access the historical data of the propellers.
3. Propeller Monitoring Cards: Just below the header, there are five individual cards, each representing a propeller numbered from 1 to 5. These cards display:
- A ring or circular chart with a percentage indicating the performance or operational level of each propeller.
- The text "Voltage: --" to show the real-time voltage of each propeller.
4. Add Propeller Button: Below the propeller cards, there is a green button with the text "+ Add Propeller," which could be used to add more propellers to the monitoring system.
5. Bar Chart: In the lower left part of the interface, there is a bar chart showing daily generated data for the propellers.
6. Donut or Circular Chart: To the right of the bar chart, there is a circular chart displaying the overall operational percentage, segmented by groups of propellers.
- Group 1: (Propeller 1 and Propeller 2)
- Group 2: (Propeller 3 and Propeller 4)
- Group 3: (Propeller 5)
History Page
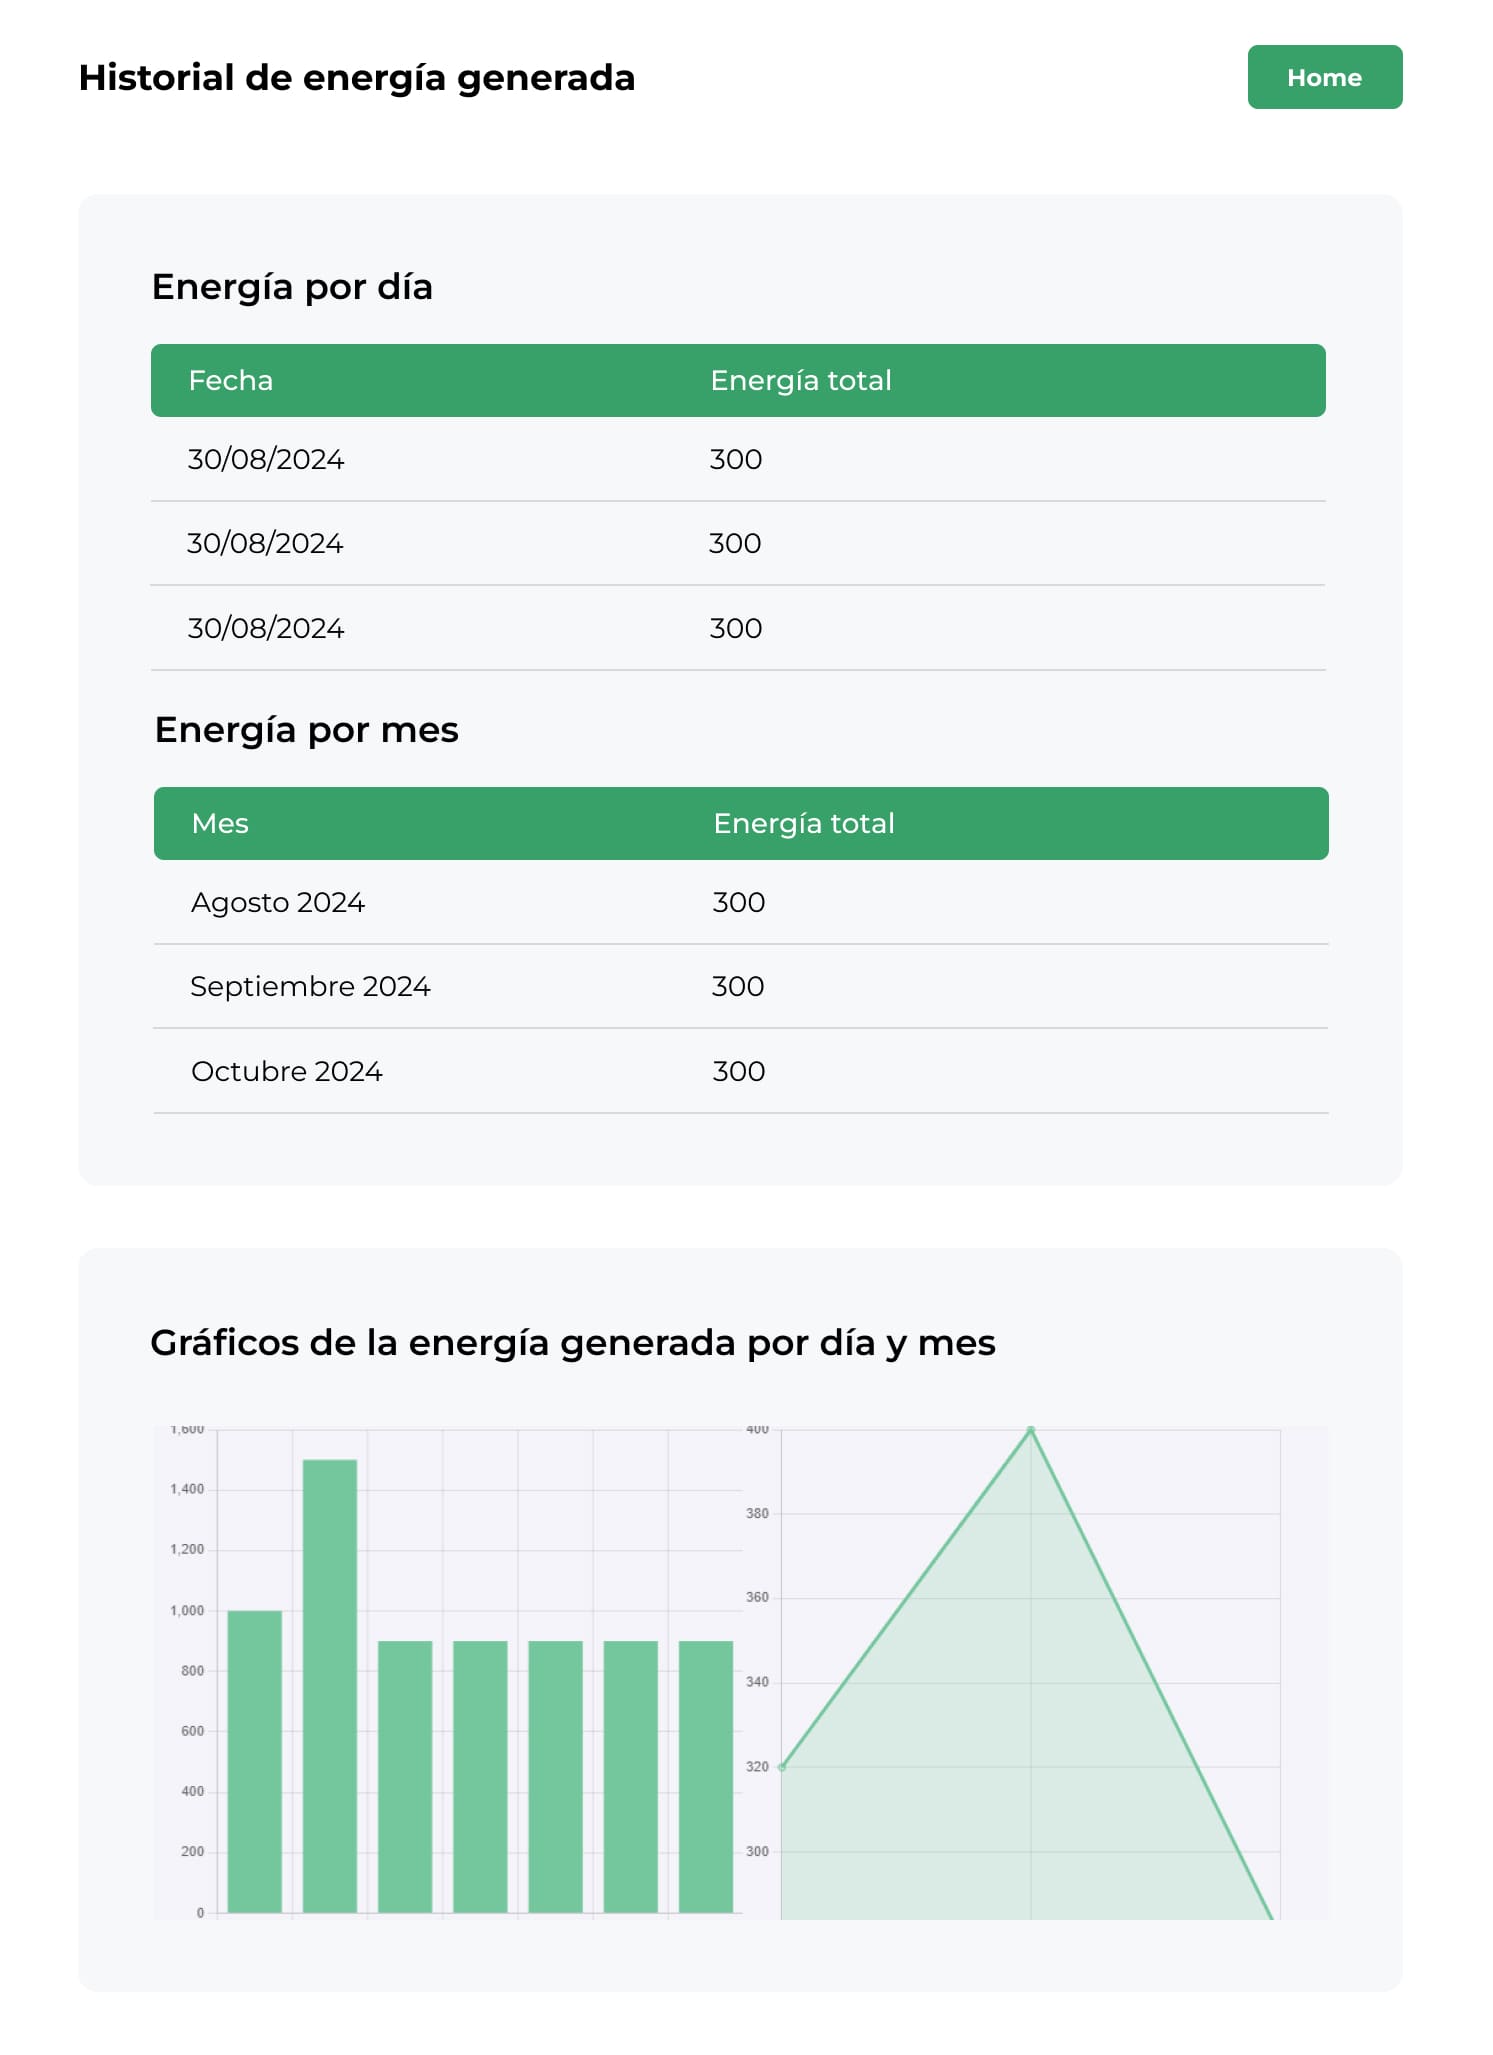
1. Header: At the top left, the title "Generated Energy History" is displayed, indicating that this section allows viewing the energy generation history.
2. Home Button: In the top right corner, there is a green button titled "Home," which facilitates navigation back to the main page.
3. Daily Energy Table: Just below the header, there is a table titled "Energy by Day." This table displays:
- A column for the Date, recording each specific day.
- A column for the Total Energy generated on each specific day.
4. Monthly Energy Table: Below the daily energy table, there is another table titled "Energy by Month." This table includes:
- A column for the Month, showing the corresponding monthly period.
- A column for the Total Energy generated each month, accumulating the daily energy generation values.
5. Energy Generation Graphs: At the bottom of the page, there is a section titled "Energy Generated by Day and Month." This section contains:
- A bar chart illustrating the amount of energy generated daily.
- A line chart showing the total accumulated monthly energy generation, allowing for trend observation over time.
Second design
For the second design, benchmarking was done to analyze the structure of other websites. It was interesting to see the different layouts, but most of them followed a dashboard format. Following this trend, the decision was made to stick with a dashboard design. In this new version, a hamburger menu was added on the left side, along with three screens: the first for the home, the second to display information for each propeller individually, and the last to view the history. Below is the result of the benchmarking conducted.
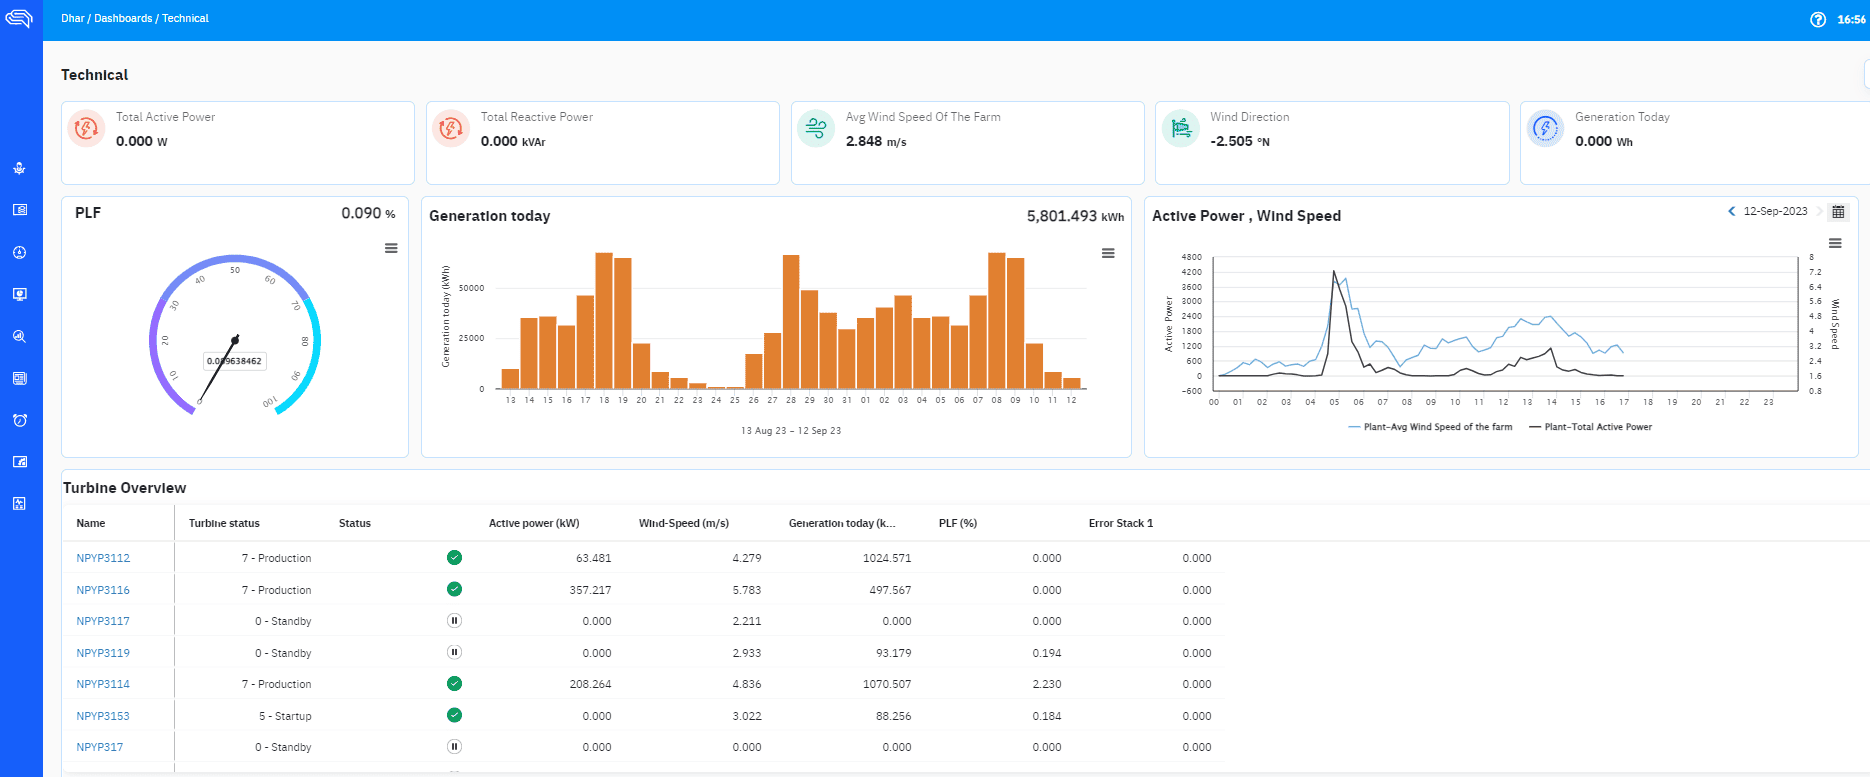
The inspiration to add a menu came from the following pages.
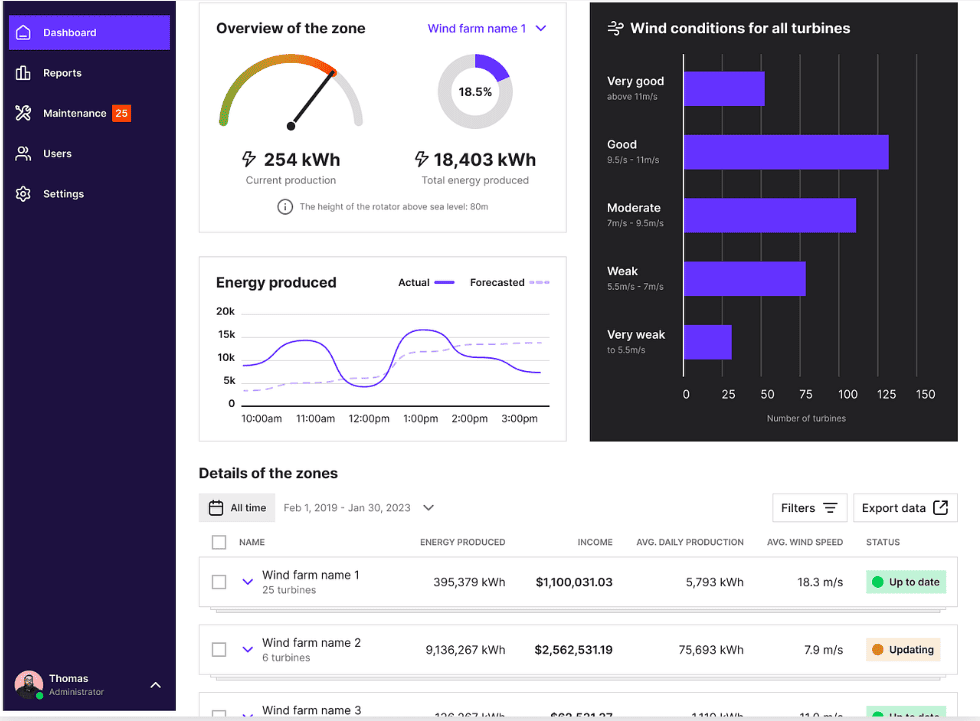
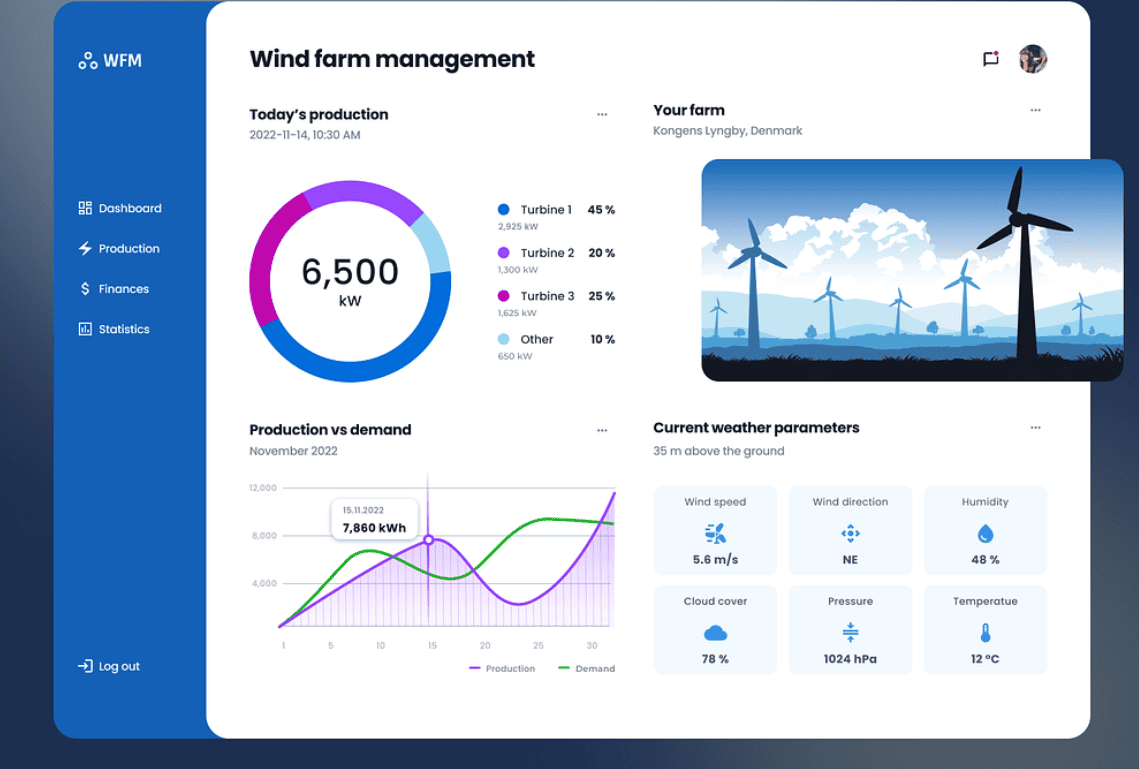
Also the following two images show how it is structured, that is, it was a great help to accommodate the elements and components.
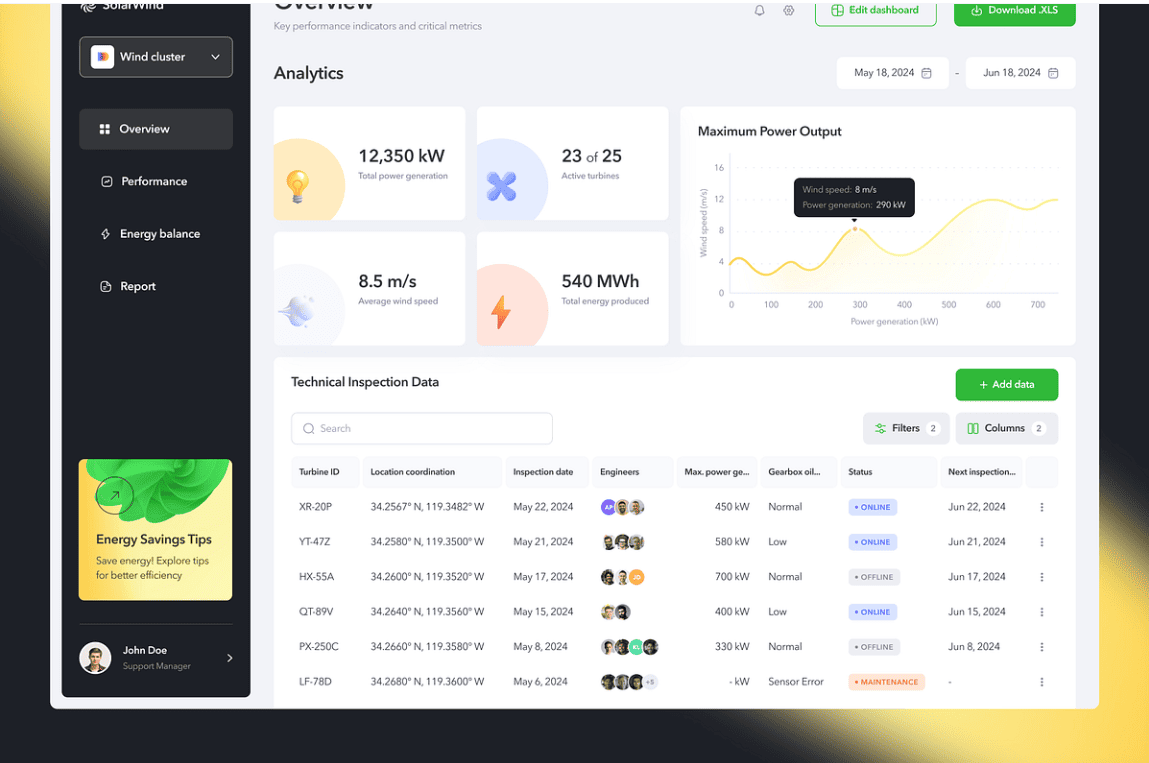
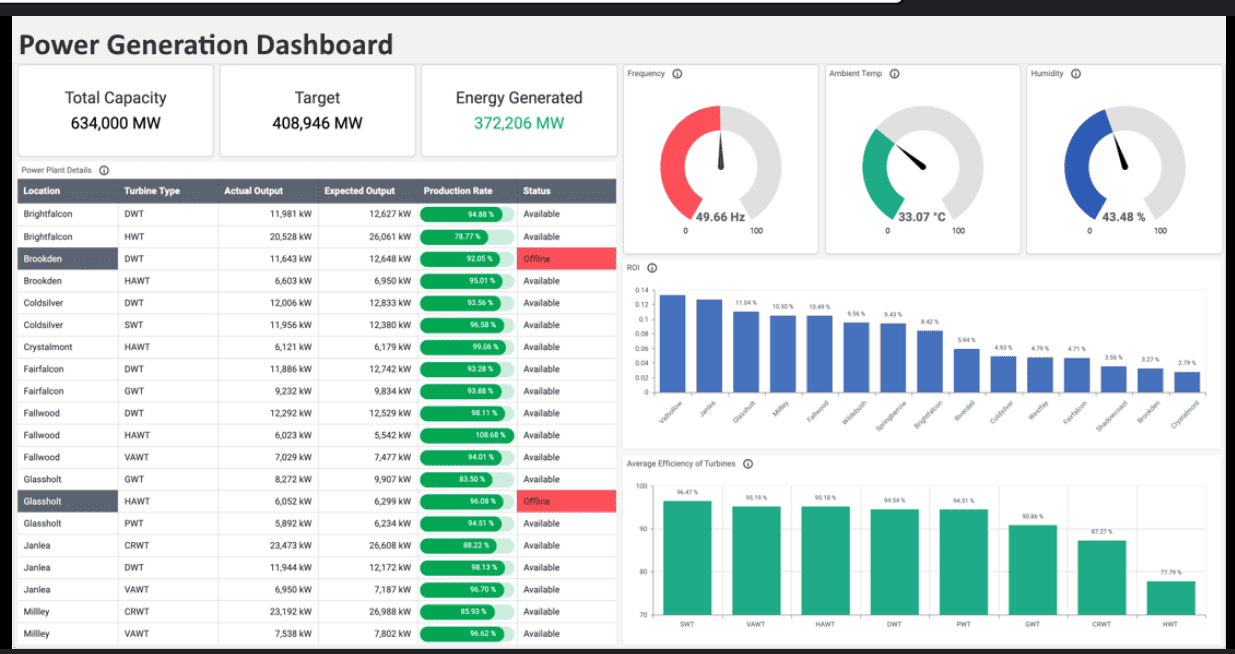
Finally, putting more graphics and that these can be understood so that the user does not complicate to understand what is happening was thanks to the following pages.
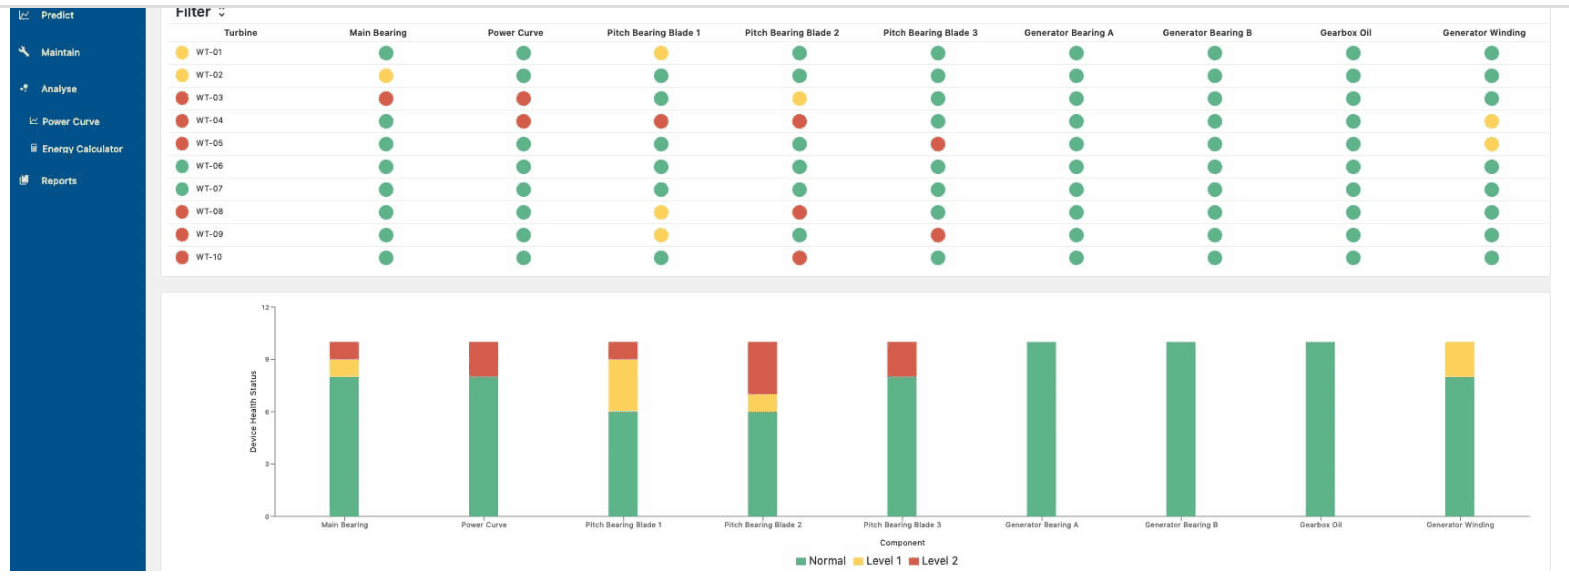
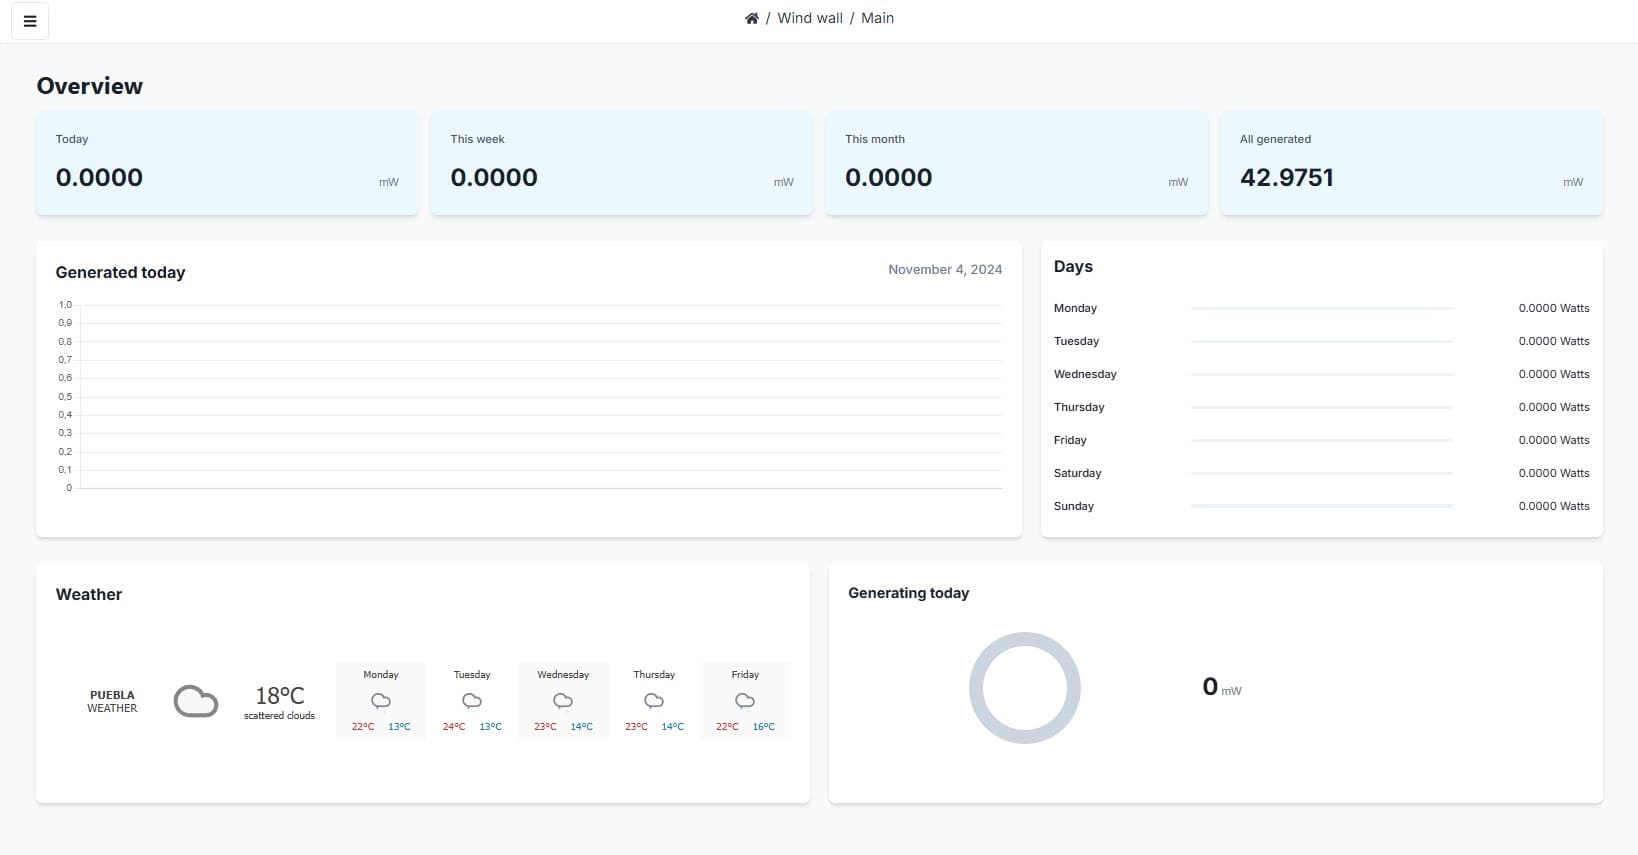
Home Screen: Overview
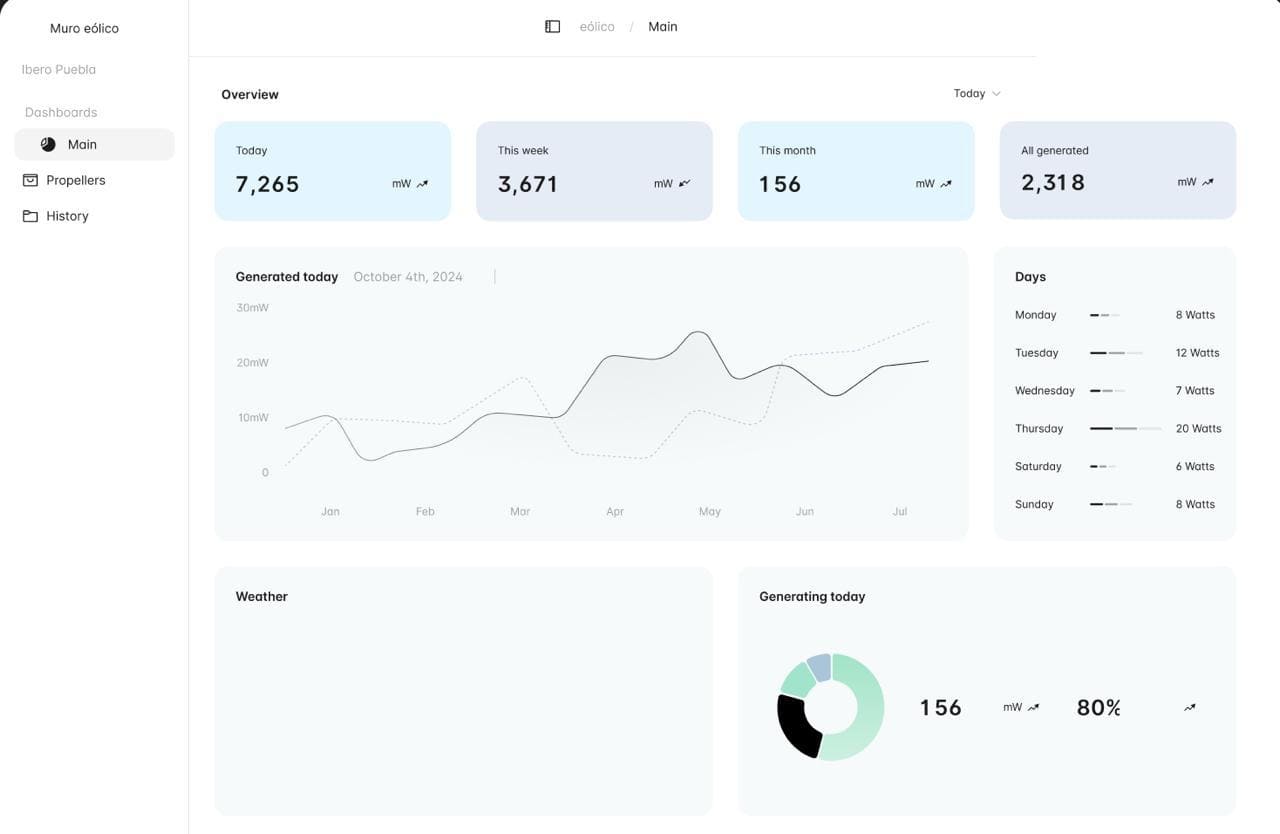
• Navigation Sidebar: On the left, there is a navigation panel titled "Wind Wall" with options to navigate between three sections: "Main," "Propellers," and "History." The "Main" section is highlighted, indicating that it is the current screen.
• Energy Generation Summary: At the top center, there is a summary of energy generation across different time periods. It includes:
- Today: Shows the energy generated on the current day.
- This Week: Indicates the amount of energy generated during the current week.
- This Month: Presents the energy generated over the current month.
- Total Generated: Displays the total accumulated energy generated to date.
• Daily Generation Graph: Just below the summary, there is a line graph showing energy generation in mW throughout the year. The graph shows variations in energy generation over the months.
• Daily Generation Table: To the right of the graph, there is a list of days of the week (from Monday to Sunday) with the amount of energy generated on each day in watts. This allows a quick view of daily energy generation differences.
• Weather Section: Below the generation graph, there is a space titled "Weather" reserved to display weather information, which could influence the energy generation of the propellers. The space intended for this graph is currently empty; it will be populated during development.
• Daily Generation Chart: To the right of the weather section, there is a circular chart showing the proportion of energy generated on the current day.
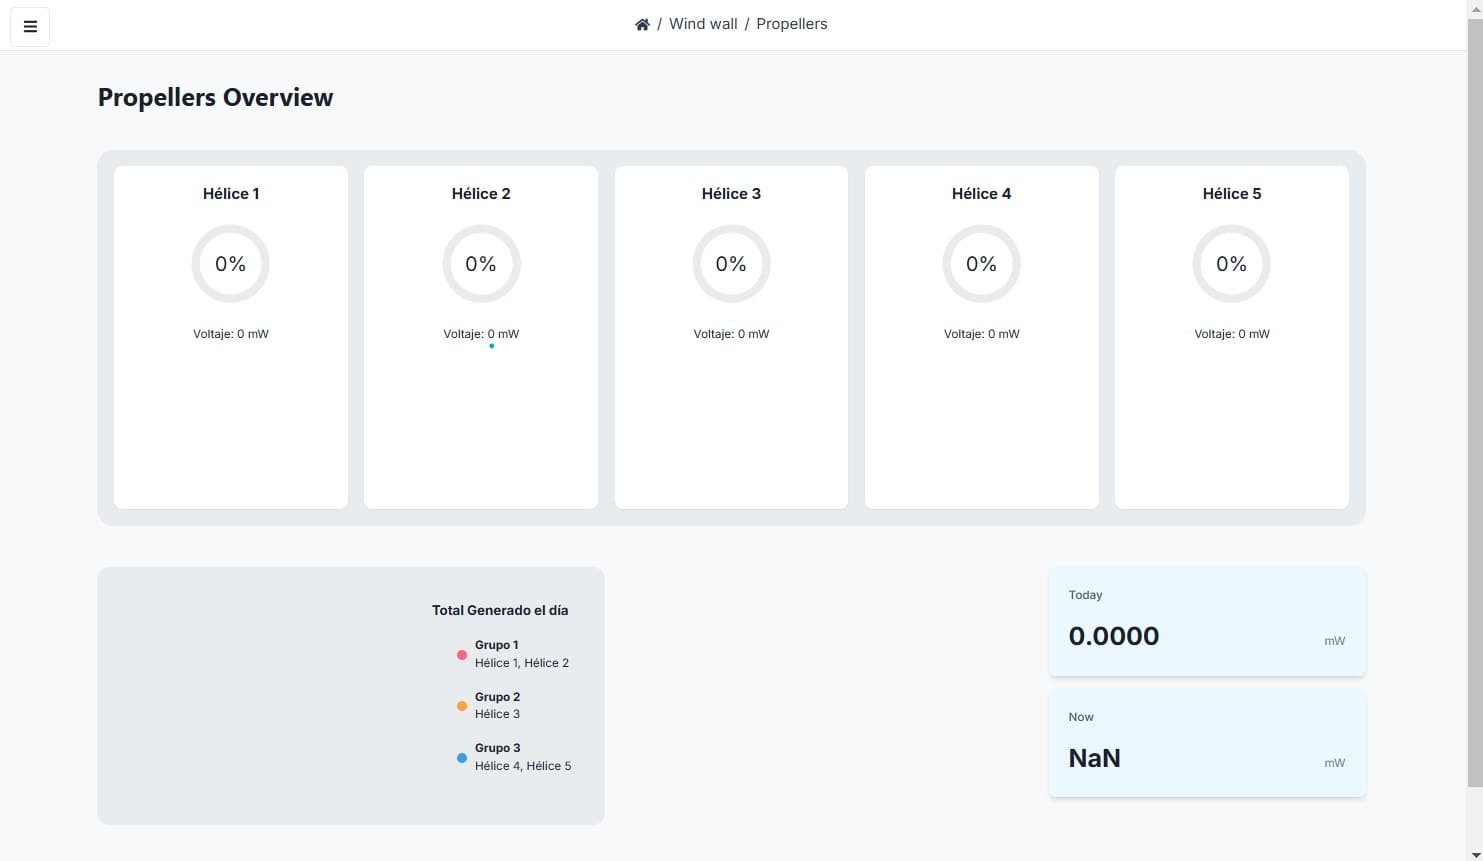
Propellers Screen: Details per Unit
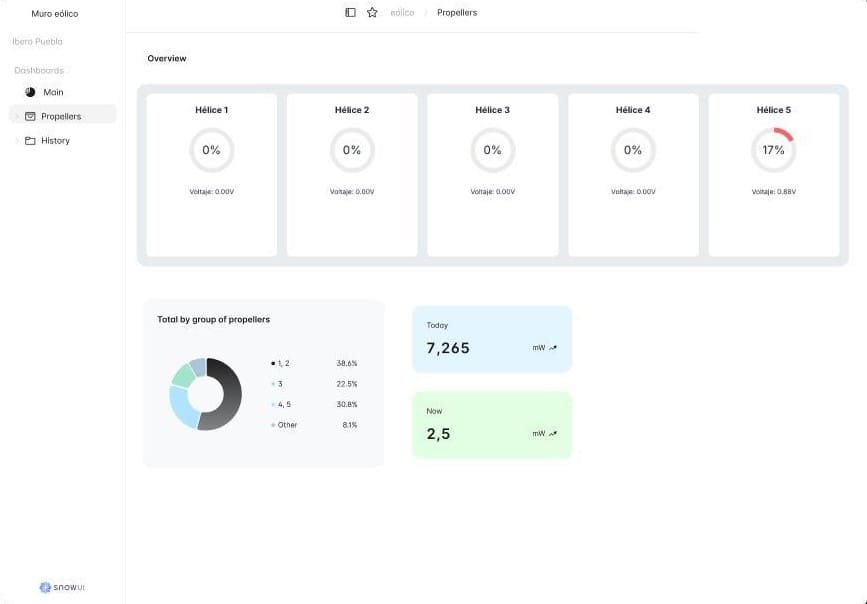
Navigation Side Panel: On the left, there is a navigation panel titled "Wind Wall," with options to access the sections "Main," "Propellers," and "History." The "Propellers" section is highlighted, indicating that this is the current view.
Propeller Overview: At the top of the page, there is a set of cards displaying the current status of each propeller, numbered from 1 to 5. Each card includes:
- A circular indicator showing the current operating percentage of each propeller.
- The voltage generated by each propeller at that moment (in volts).
Circular Chart by Propeller Group: Just below the propeller overview, there is a circular chart that categorizes the propellers into groups. This chart shows the distribution of propellers by group in percentages:
- Group 1 and 2
- Group 3
- Group 4
Generated Energy Indicators: To the right of the circular chart, there are two cards displaying:
- Today: The amount of energy generated in the current day, in milliwatts (mW).
- Now: The real-time energy generation.
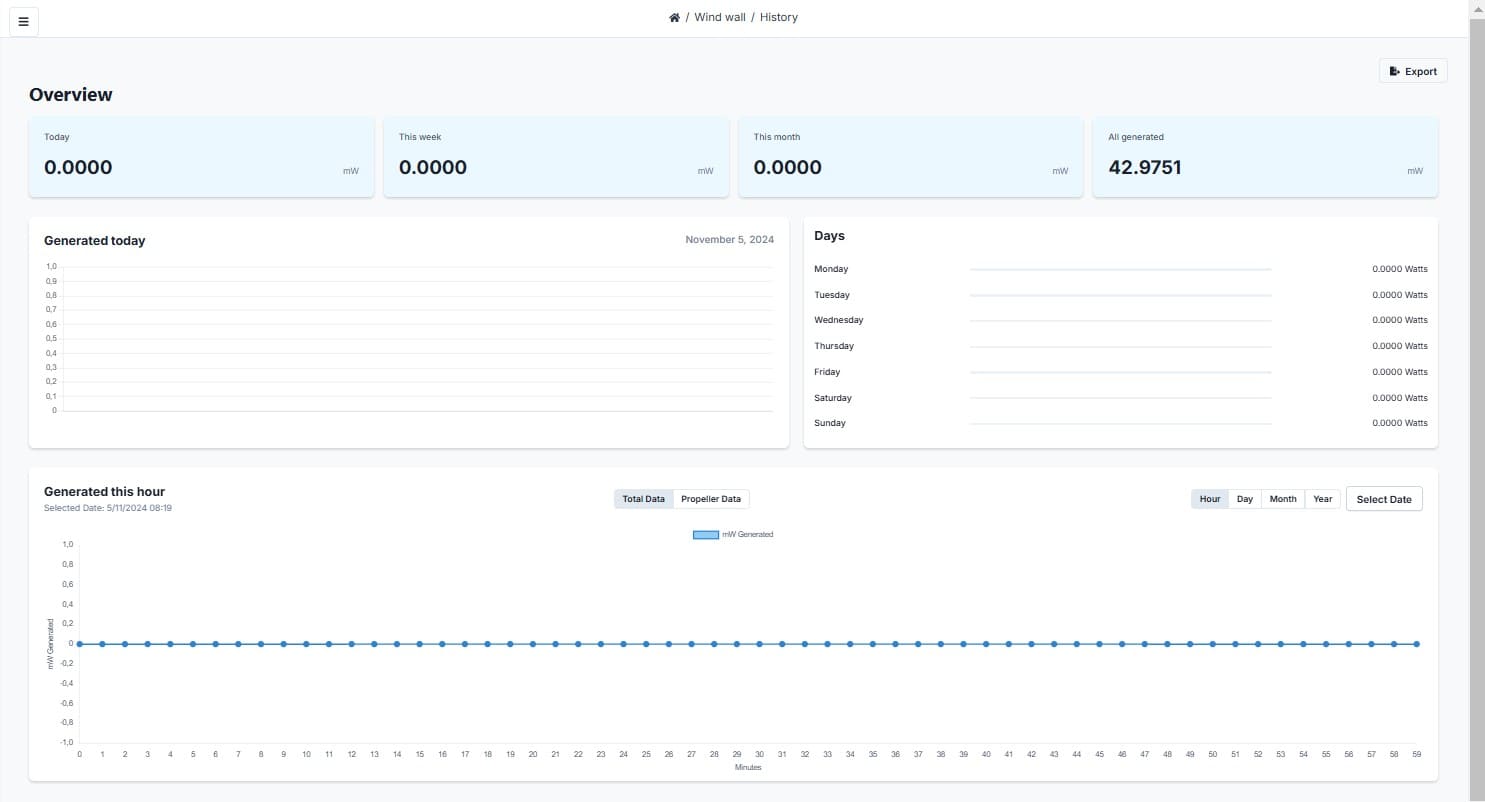
History Screen: Activity Log
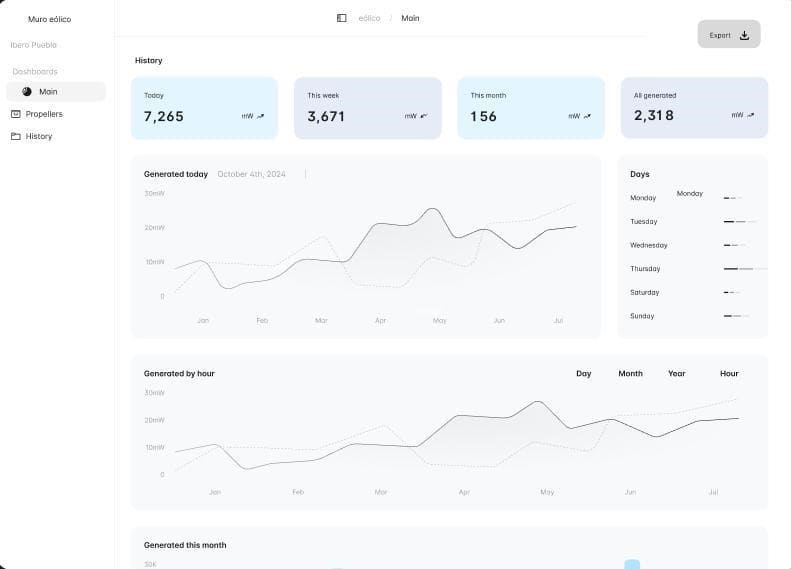
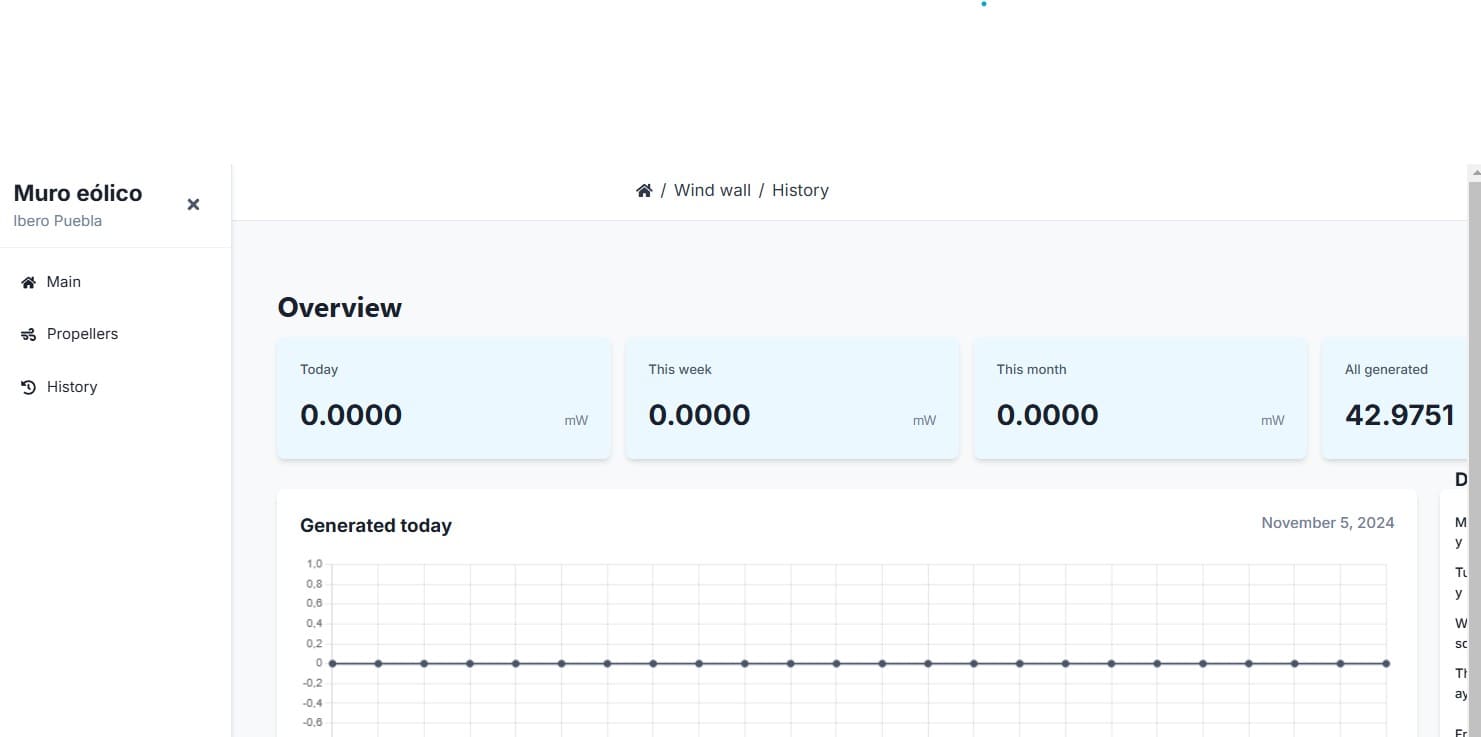
Navigation Side Panel: On the left, there is a navigation panel with the title "Wind Wall" and options to switch between the "Main", "Propellers", and "History" sections. The "History" section is highlighted, indicating that it is the current view.
Export Data: In the upper right corner, there is an "Export" button that allows the user to download or export the energy generation data.
Energy Generation Summary: At the top center, there is a summary displaying the amount of energy generated over different time periods, including:
- Today: Energy generated on the current day.
- This Week: Energy generated during the current week.
- This Month: Energy generated during the current month.
- Total Generated: Cumulative total energy generated to date.
Today's Energy Generation Graph: Just below the summary, there is a line graph that shows the energy generation for the current day in milliwatts (mW). This graph allows viewing generation changes throughout the hours.
Hourly Generation Graph: Below the daily graph, another line graph is displayed, detailing energy generation in hourly intervals. This allows for a more specific analysis of energy generation variations throughout the day.
Monthly Generation Graph: Further down, there is a line graph showing the energy generated during the current month. This graph allows observing energy generation trends month by month.
Days of the Week Table: To the right of the graphs, there is a list that shows each day of the week (Monday to Sunday) along with the energy consumption or generation in watts. This list allows the user to quickly view daily performance.
Time Interval View Controls: Below the hourly generation graph, there are options to adjust the view by "Day", "Month", "Year", and "Hour" intervals, allowing the user to easily change the temporal perspective of the displayed data.
Interface development
The interface was developed using Next.js, organizing the project into different screens and key functionalities.
Next.js
Next.js is a web development framework built on React that supports both server-side and client-side rendering. It includes features such as hybrid rendering (static and dynamic), automatic routing, and built-in API creation. We used Next.js for our project due to its ability to optimize the delivery of dynamic content, facilitating a faster and more efficient user experience. Additionally, we implemented Chakra UI, a React component library that provides accessible and highly customizable styled components, enabling us to build elegant and consistent interfaces quickly.
1. Installing Next.js
First, Next.js was installed using Node.js and npm. After verifying the installation of Node.js and npm, the basic application was created by running:
This generated the initial project structure and configurations needed to get started.
2. Project Structure and Initial Setup
With the project created, the directory was accessed with cd project-name. This folder structure allowed the project to be organized into reusable components. Each screen (Home, Propellers, and History) was developed as a component within the pages folder in Next.js, utilizing automatic routing for easy navigation between them.
3. Commands for Running the Project
To enable real-time development, the following command was used to view changes as the code was updated:
This runs the application on http://localhost:3000, allowing preview and testing of the main screens.
4. Component-Based Development
Each screen was designed as an independent component, which facilitated code organization and reusable interface elements. This modular approach also made project maintenance easier, allowing efficient adjustments to specific sections.
5. Styling and Design with Chakra UI
For the design and styles, Chakra UI was used, a UI component library that offers a set of customizable and responsive elements. This tool allowed for modern styling to be applied quickly and consistently across the interface.
Installing Chakra UI
Chakra UI
Chakra UI is a modern, accessible component library for React that offers a set of customizable and responsive elements. It provides built-in styles and theming options, allowing developers to create visually appealing, consistent interfaces quickly. Chakra UI is ideal for building applications that require a clean, functional design with minimal configuration.
6. Data Visualization with Chart.js
Since the interface included multiple charts for data visualization, Chart.js was used, a library that integrates easily and flexibly with different chart types. This made it easier to create interactive, customized charts within the interface.
Chart.js
Chart.js is a popular open-source JavaScript library for data visualization, designed to integrate easily into various applications. It supports multiple chart types, such as line, bar, and pie charts, making it versatile for displaying data. With customizable options and interactive capabilities, Chart.js enables developers to create dynamic, visually engaging charts to represent data effectively.
Vercel
Vercel is a hosting and deployment platform optimized for frontend applications built with frameworks like Next.js. It offers serverless infrastructure and seamless integration for fast deployment, with built-in support for CI/CD (Continuous Integration and Deployment). We chose Vercel to host our web page due to its excellent compatibility with Next.js and its ability to scale automatically based on demand.
API Development
API
An API (Application Programming Interface) is a set of protocols and definitions that enable communication between different software systems. In our project, we developed an API that retrieves data generated by the XIAO ESP32 microcontroller, facilitating the transfer of information from the device to our web application. We used Postman as a tool to test and validate the API's functionality, which helped us identify and fix potential errors in data requests and responses.
The API for this project, developed in Python using Flask, enables real-time communication between the wind energy generation system and the web-based user interface. Through this API, data generated by the propellers is sent to the server, where it is stored and can be retrieved for visualization and analysis.
Infrastructure and Environment
The API is hosted on Render, a cloud platform that not only enables API deployment but also offers database management. In this project, a PostgreSQL database provided by Render is connected directly to the API, storing data generated by the propeller system.
Render
Render is another hosting platform that provides services for web applications, APIs, and databases. Unlike other services, Render is an all-in-one solution that can host both the frontend and backend as well as other application components. In our project, we used Render to host specific API services, ensuring stability and fast response times.
Main Functionality
The API serves two main functions:
- Receiving data from the propeller system.
- Retrieving data for visualization on the web platform.
Data Reception (POST Method)
The API includes a POST endpoint that receives data sent by the XIAO ESP32-C3 microcontroller. This microcontroller sends JSON data, including information on the energy generated by each propeller. Below is an outline of how these data are processed:
- Timestamping: The API records the current date and time on the server when each data set is received, allowing for tracking energy generation over time.
- Data Validation: The API verifies that the received data includes valid values for each propeller. If any value is missing or improperly formatted, the API returns an error.
- Total Calculation: The API sums the energy generated by all propellers and organizes the data for storage in different sections (daily, monthly, and total).
- Conditional Storage: Data is stored only if the total generated energy exceeds a minimum threshold, preventing the storage of irrelevant or insignificant data.
Data Retrieval (GET Methods)
The API provides several GET endpoints for retrieving stored data. These endpoints facilitate real-time monitoring and historical analysis on the web platform. Key GET endpoints include:
- Latest Data: An endpoint allows retrieval of the most recent data entry, providing a current reading of each propeller’s energy generation.
- Complete History: This endpoint enables retrieval of all stored records, useful for long-term analysis.
- Data by Day and Hour: Some endpoints return energy generation data divided by hours on a specific day or by minutes within a specific hour for detailed summaries.
- Weekly and Monthly Totals: These endpoints provide the total energy generated in the current week or month, offering a broader view of the system's performance.
Example GET Endpoint Usages
- Retrieve Latest Entry: Provides an instant reading of the most recent energy generation data for each propeller.
- Retrieve Complete History: Returns all recorded data, which is useful for reviewing the generation history.
- Daily and Monthly Totals: Allows users to view accumulated generation data for the current day or month, aiding in long-term monitoring.
- Hourly and Minute Data: Hourly and minute data endpoints allow users to analyze generation patterns over shorter periods.
Total Update Functions
The API includes specific functions to calculate and update daily, monthly, and overall totals:
- Daily Totals: Stores the energy generated each day, organized by propeller groups.
- Monthly Totals: Accumulates energy generated during the current month.
- Overall Total: Maintains a cumulative record of all energy generated since the system started.
These functions ensure that the system accurately records and updates energy generation totals.
Data Management (DELETE Methods)
To keep the database organized and avoid unnecessary data storage, the API includes DELETE endpoints that allow for the removal of unwanted records:
- Full Reset: Deletes all data from the database, useful for maintenance or testing purposes.
- Temporary Data Cleanup: Deletes temporary data used for real-time monitoring without affecting historical records.
- Removal of Zero Records: Deletes records where no energy was generated by the propellers (all values are zero), optimizing storage.
Connection to the Web Platform
The API is designed to integrate seamlessly with the web platform. Through the XIAO ESP32-C3 microcontroller, the API receives and stores energy generation data and enables real-time queries. The GET endpoints are essential for displaying information interactively and in real-time on the web interface.
- POST: Receives data from the propeller system and stores it in the database.
- GET: Provides data for real-time monitoring, allowing for historical and analytical visualization.
Security and Configuration
The API implements several security and access control configurations to ensure data integrity:
- CORS: The API uses Flask-CORS to enable communication between the backend and frontend, even if they are on different domains.
- Input Validation: The API performs checks on each request to ensure the data is in the correct format and structure.
- Environment Variables: Sensitive details, such as database configuration, are stored in an
.envfile to avoid exposing credentials in the code.
Final result
Page1
Page2
Page3
Page4
