Electronics Design
Alan’s Assignment
- [x] Linked to the group assignment page
- [x] Use the test equipment in your lab to observe the operation of a microcontroller circuit board (in minimum, check operating voltage on the board with multimeter or voltmeter and use oscilloscope to check noise of operating voltage and interpret a data signal)
- [x] Document your work to the group work page and reflect on your individual page what you learned
characterizing 5v power supplies
sometime in the middle of class, I bought a Siglent SDS1104X-E 100MHz 4-ch Oscilloscope. Having spent a lot on 3d printers and other machines, it’s a long overdue purchase.
usb 5v vs ~5v boost circuit from 3v power supply noise
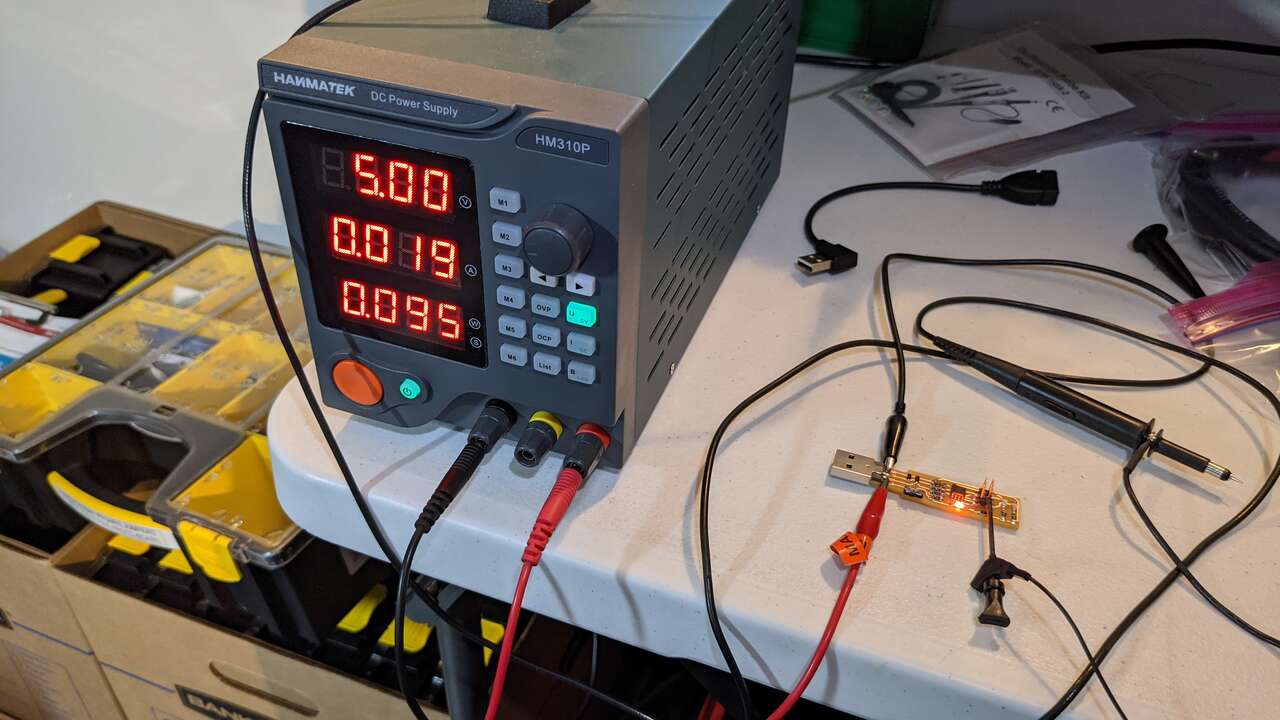
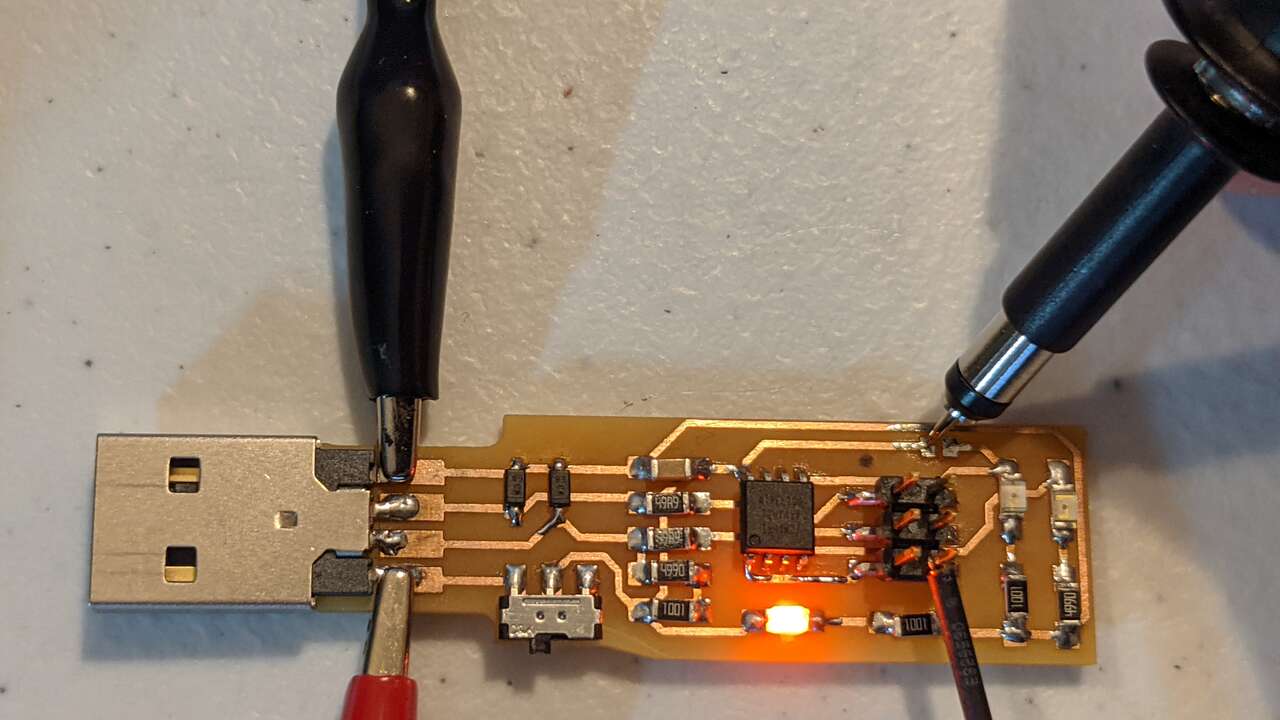
5v boost circuit
test circuit uses the AP3012, a boost converter IC with a reasonable amount of external components required for operation. It is setup such that the voltage is dropped over a 1.5kOhm resistor, to see if I can power a load.
the boost converter operates at a high frequency, so that the external inductor can be minimized.
the dominating design decision is the voltage divider that feeds into the Feedback Pin (FB). this voltage is compared to an internal reference voltage of 1.25V, and is used to determine the output voltage.
the dominating equation:
vout = 1.25V * (1 + r1/r2)
I selected components to obtain ~5V: @ r1 = 9.1k, r2 = 3k
vout = 5.042V
oscilloscope self calibration
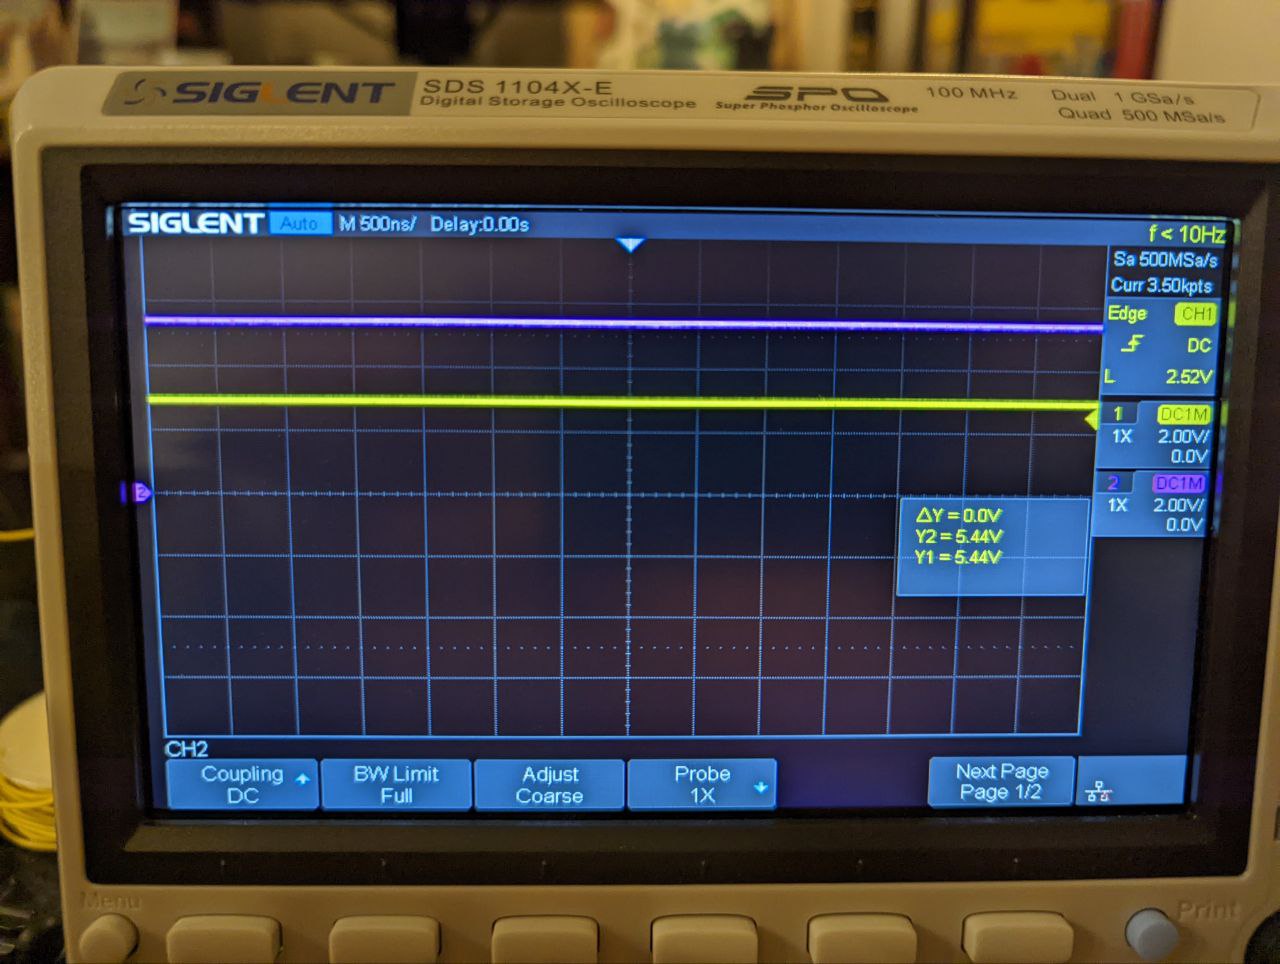
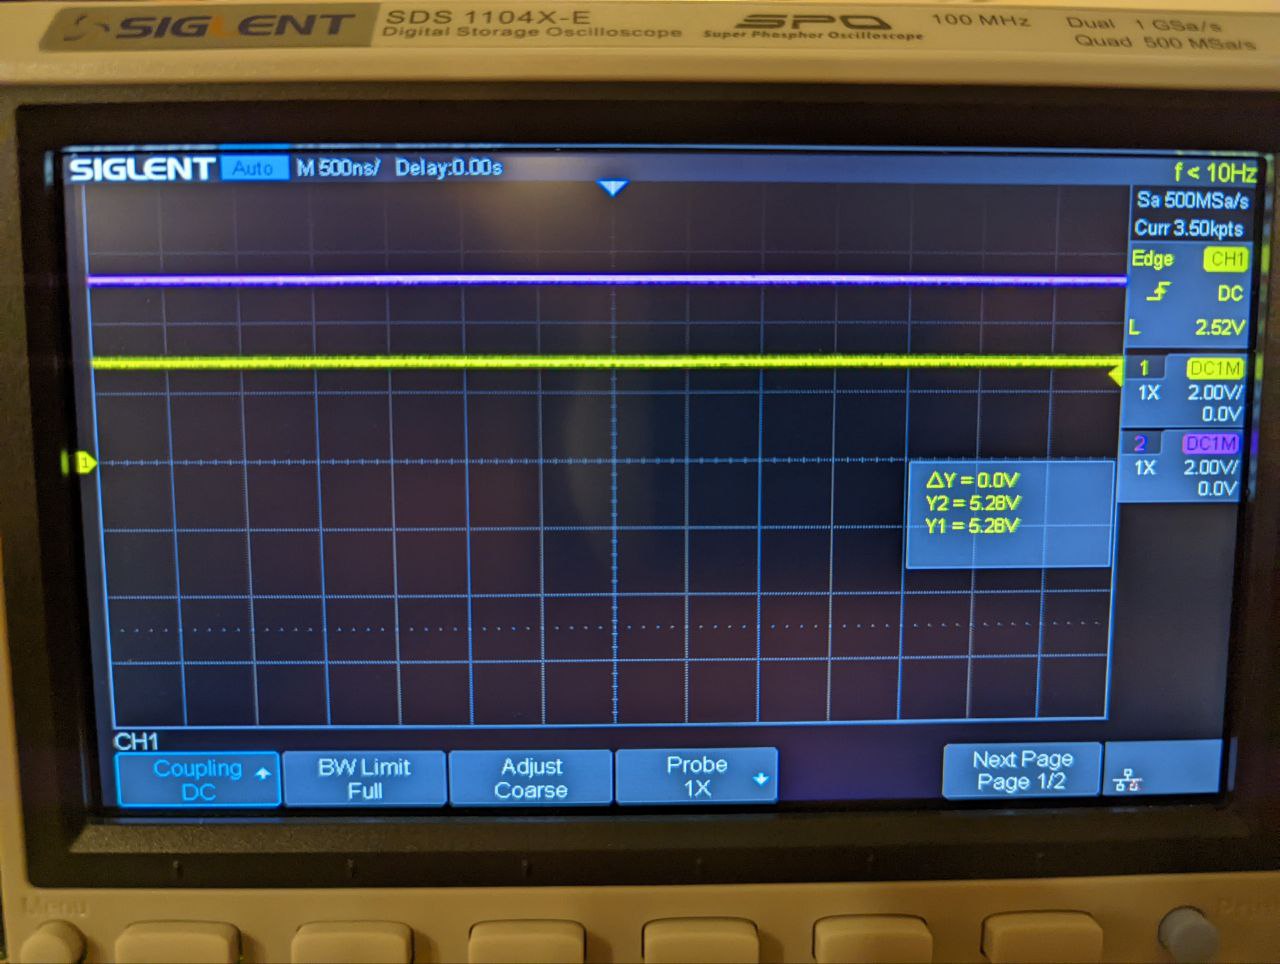
I expected close to 5.042V, but instead got ~5.4V, which is dangerously close to the 5.5V upper limit operating voltage the attiny1624 expects.
After comparing measurements from my power supply and 2 DMMs, I noticed that the oscilloscope’s measurement was the only outlier within these instruments. This pushed me to track down the self calibration setting in the oscilloscope menus.
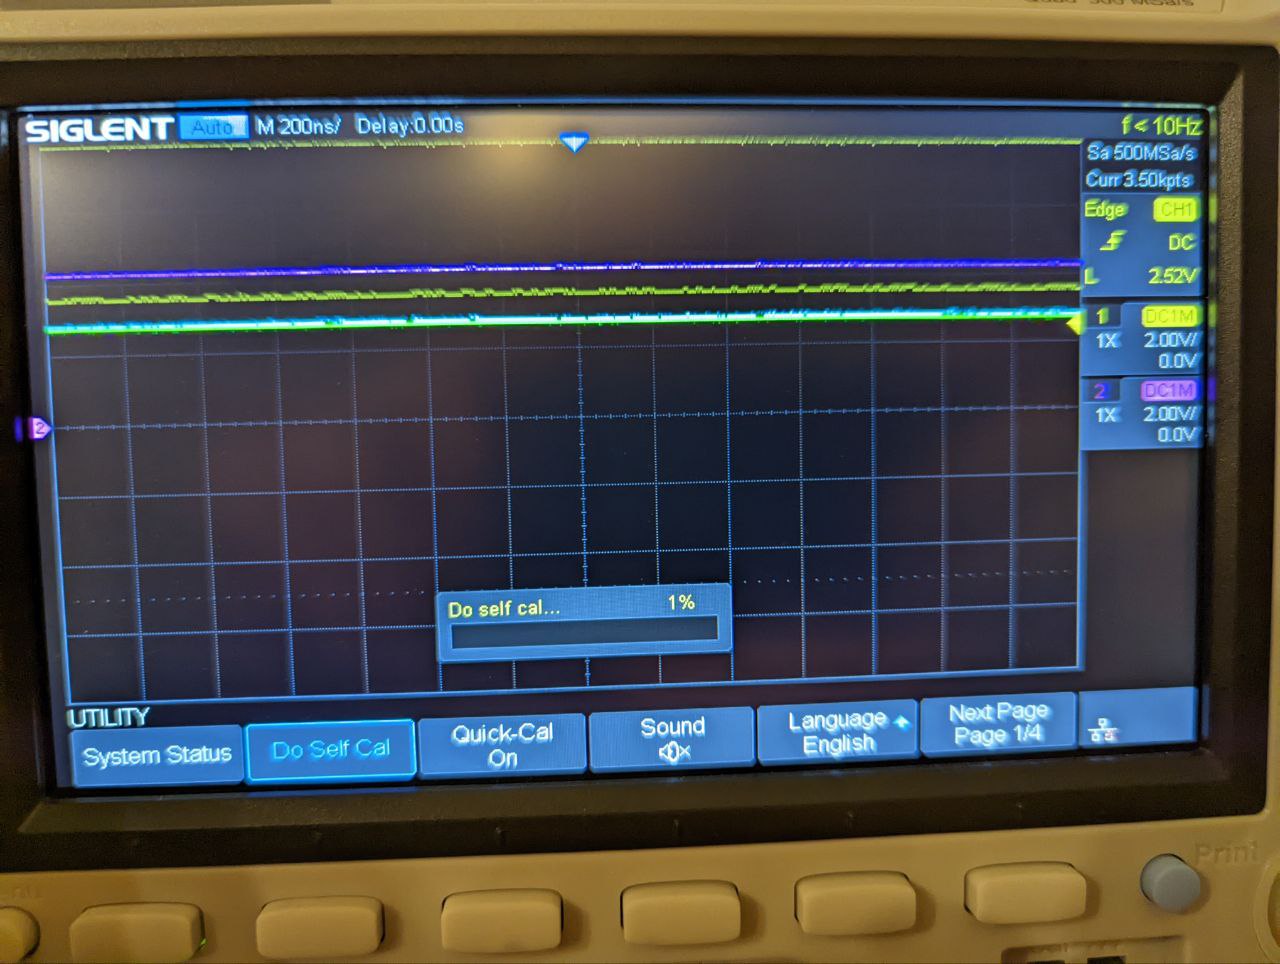
the self calibration is a process that is usually found under the utility menu. The scope will ask you to disconnect any probes and instruments, so it can run a calibration algorithm that compares with internal references against a standardized set of measurements.
From the screenshot, you can see how there are various erroneous signals on the screen. Although I didn’t take video, the screen would periodically flash more “noise” as it underwent calibration.
The entire process took ~10min.
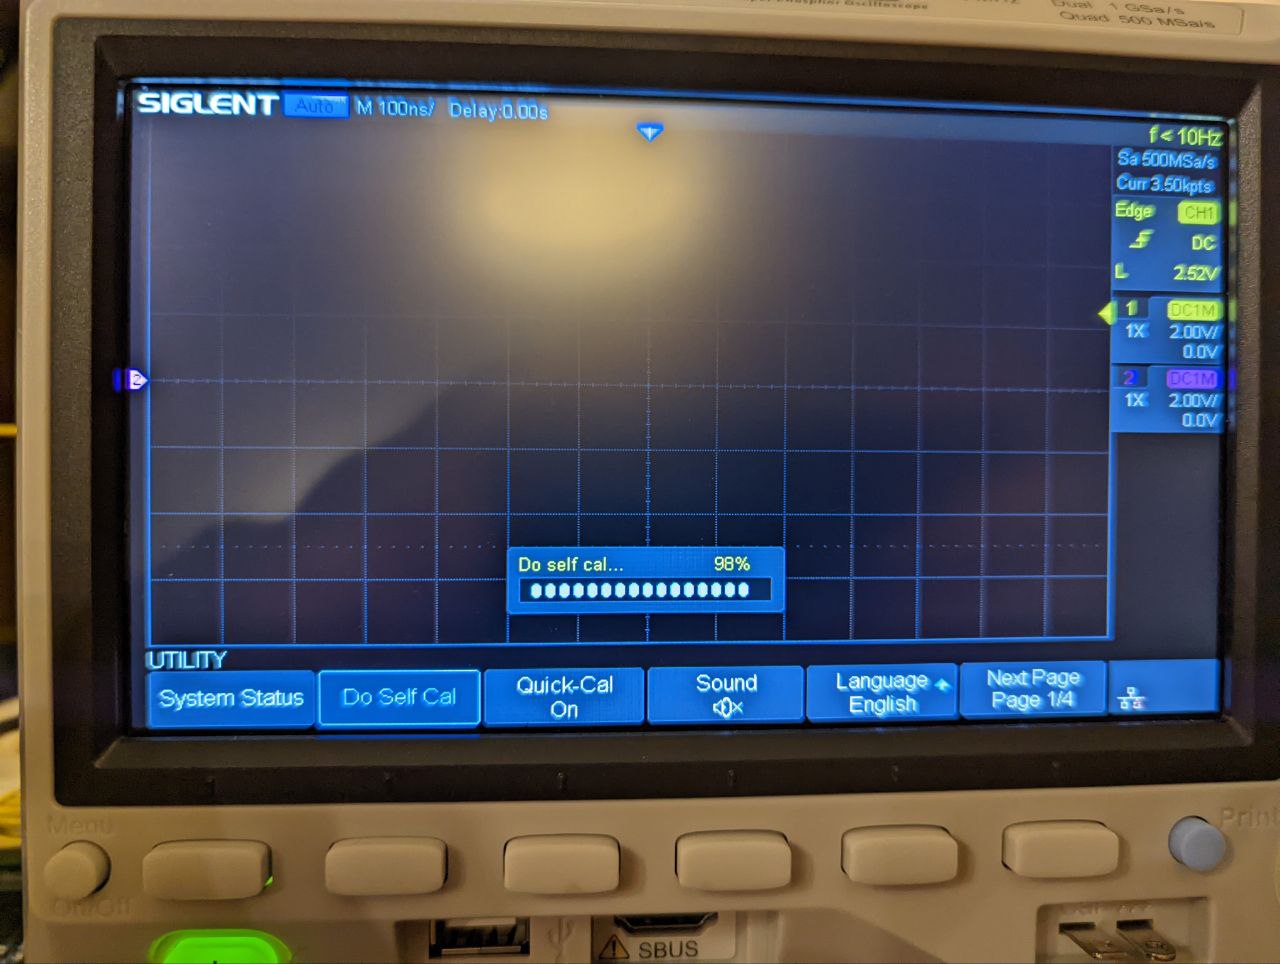
The end result was reading of ~5.2V, which is reasonably closer to 5.04V.
Equipment is something we tend to take for granted, even though we are faced with constant reminders that things break. That is one of the major takeaways for me from this class.
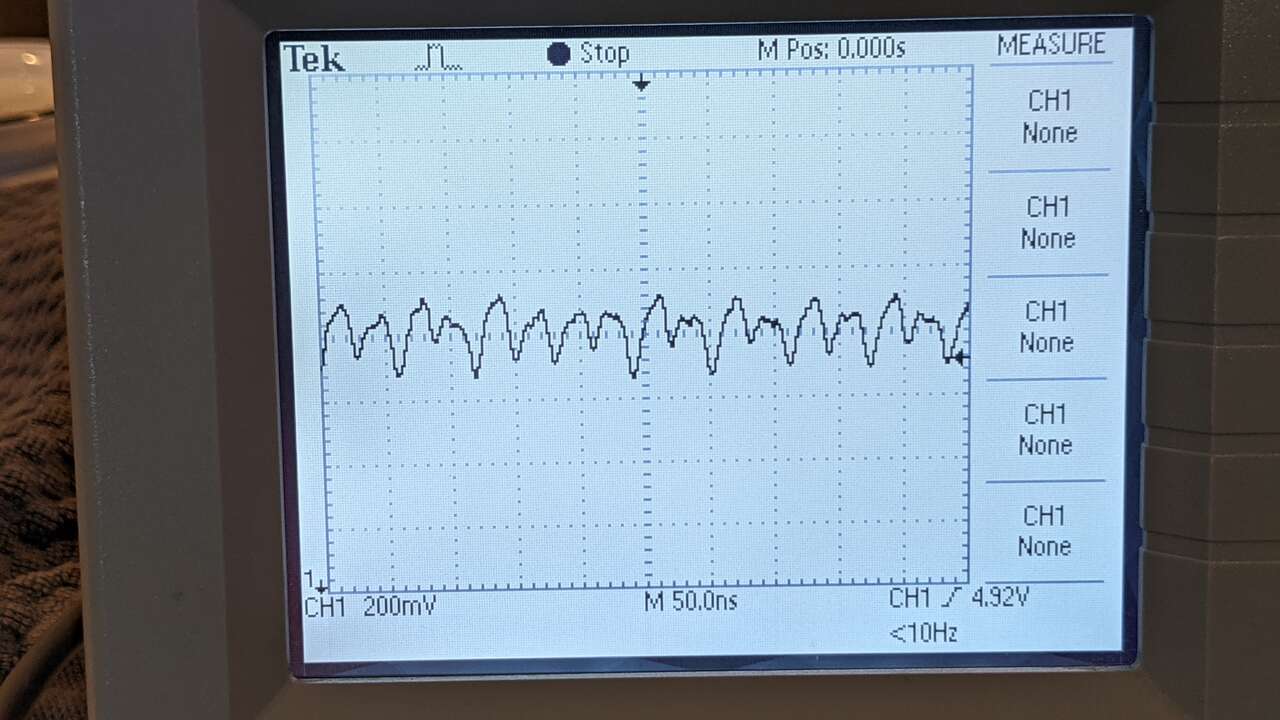
compared with usb 5v
the ripple of the ~5v boost circuit is noticeably worse than the ripple of the usb 5v supply (104mV - 64mV = 40mV).
- ch1 yellow shows usb 5v
- ch2 pink shows ~5v boost circuit
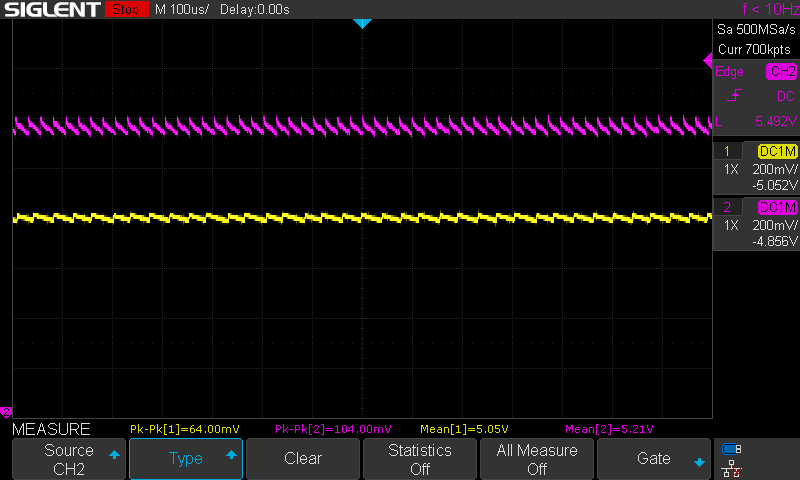
as you can see, at this point I also figured out how to obtain screenshots easily from the scope, as well as use the measurement functions to automagically display critical measurements, instead of eyeballing measurements with the cursor.
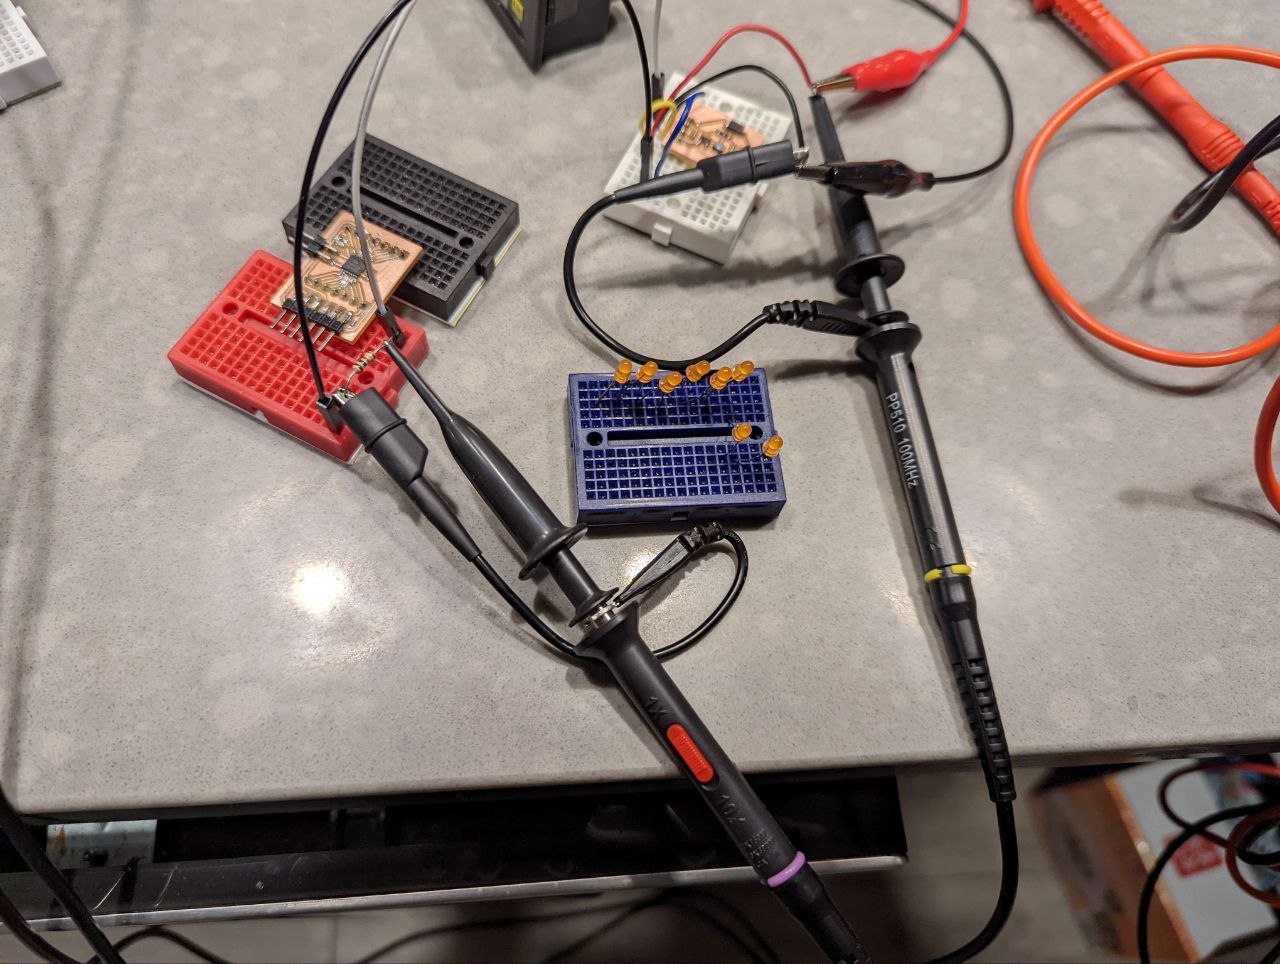
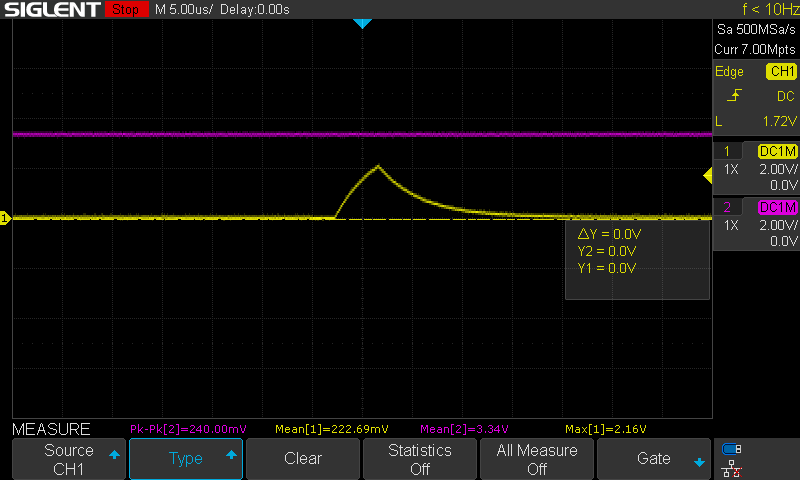
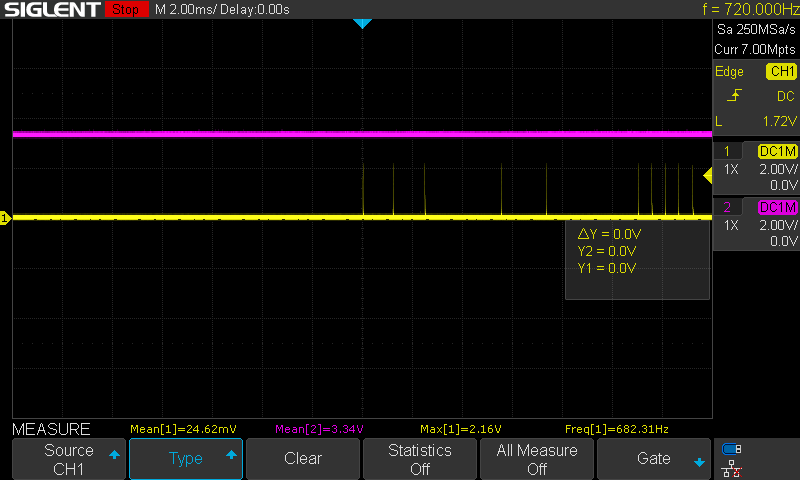
digital step signal from samd11c for a4988 stepper driver
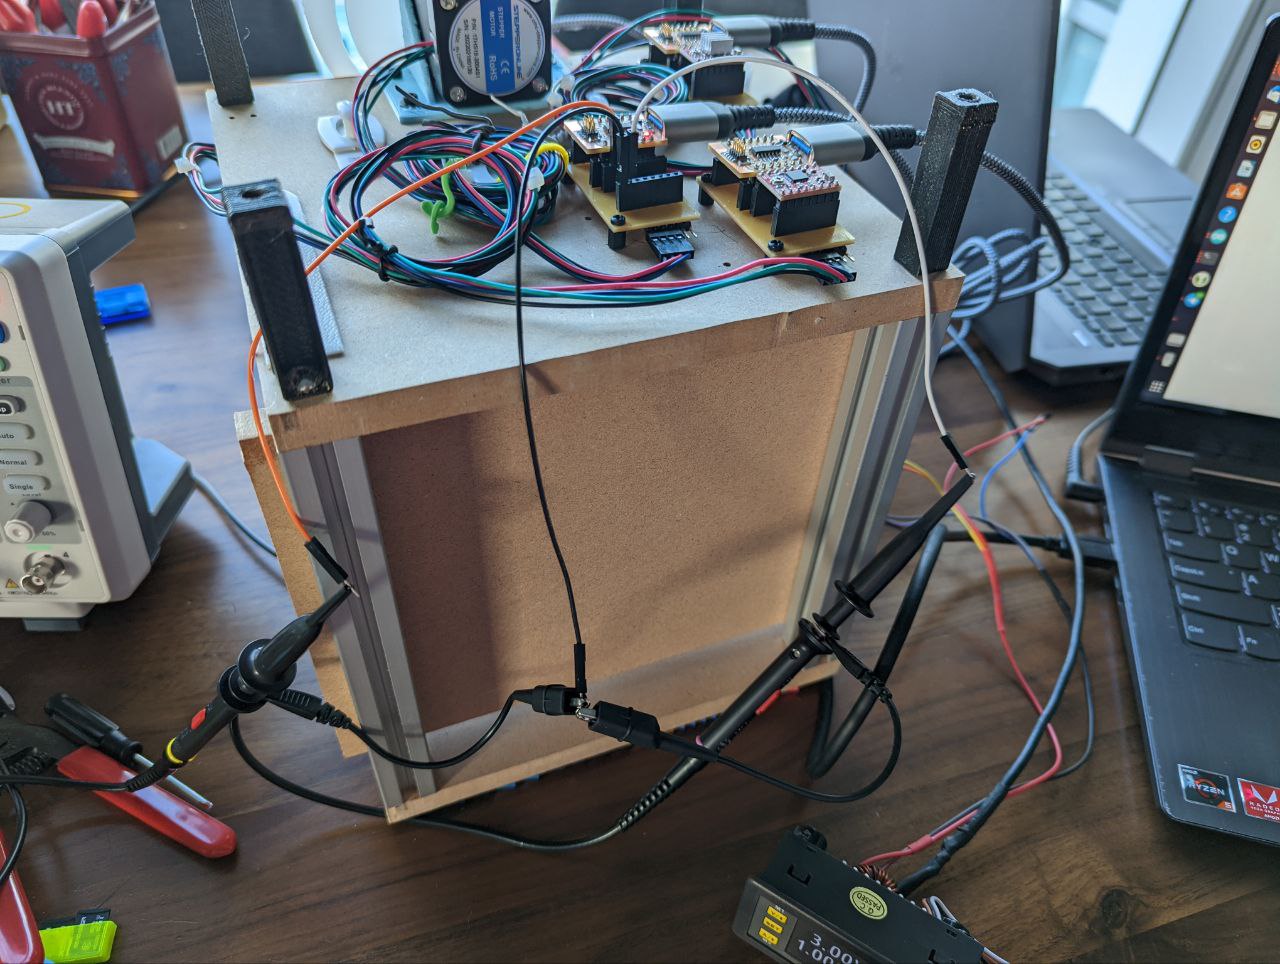
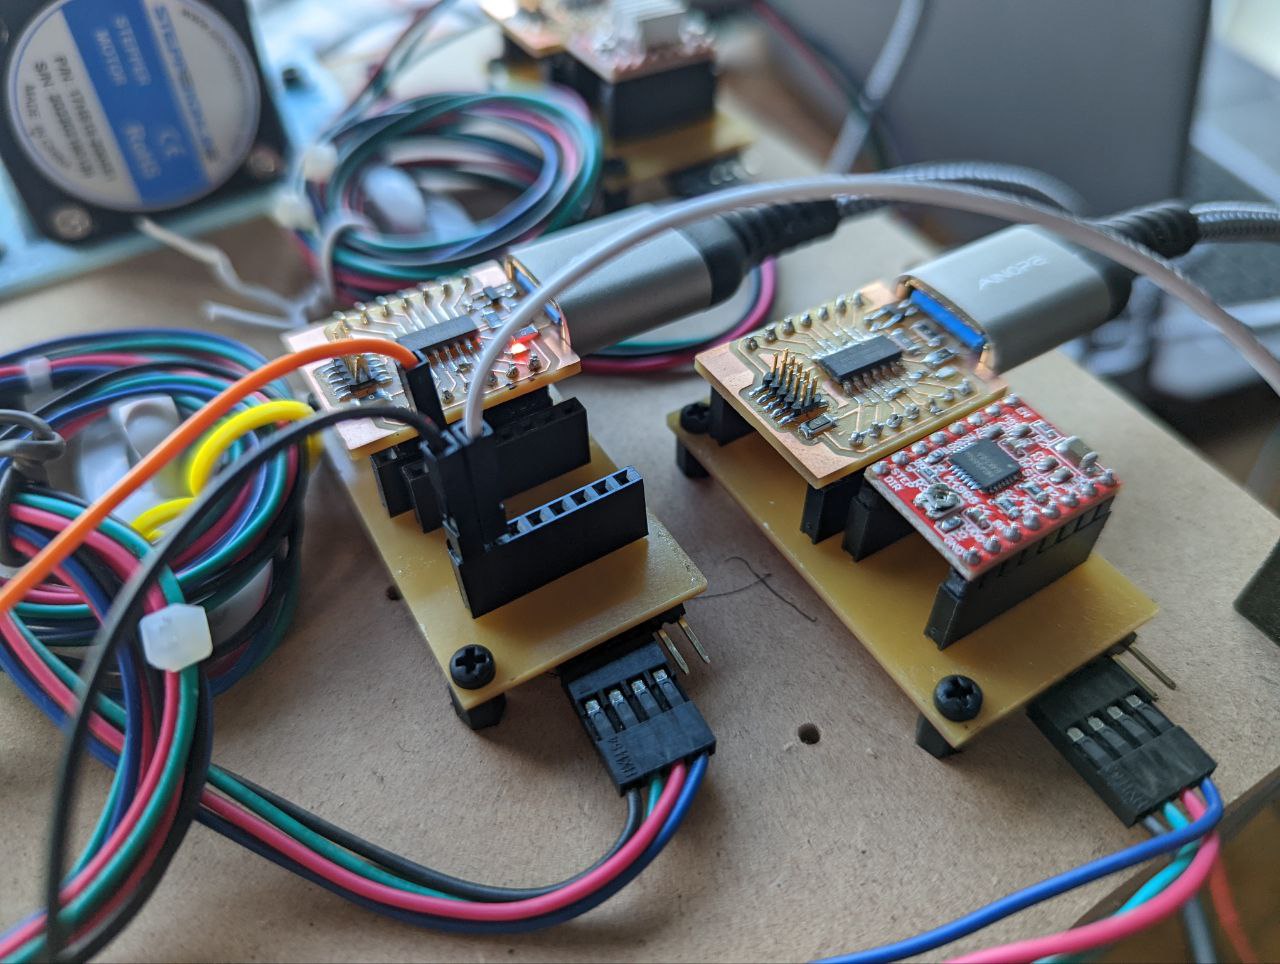
These pictures show my setup for monitoring the step signal.
- ch1 yellow shows the step signal
- ch2 pink shows the powersupply (3.3v)
I used triggering to grab screenshots of these digital waveforms.
single step pulse
varying frequency of step pulses based on the instructions being passed to motor
Dan’s Assignment
| Have you? | Done |
|---|---|
| Group assignment: | ⬇ |
| Use the test equipment in your lab to observe the operation of a microcontroller circuit board | |
| check operating voltage | Yes |
| use oscilloscope to check noise of operating voltage | Yes |
| use oscilloscope to interpret a data signal | Yes |
| document your work (in a group or individually) | Yes |
Check Board with Oscilloscope
By Dan Meyer
I used the SparkFun Electronics How to Use an Oscilloscope video to get me started with the Oscilloscope I have. I have never really used an Oscilloscope before, but I have seen others use one and understand the basic reason for using one. Specifically helpful for me to learn my Tektronix TDS 1002 oscilloscope are these documents: Really great video to help me learn all the knobs and buttons: Tektronix Oscilloscope Tutorial Part 1 The original manual for my model of oscilloscope was great too!: TDS1000- and TDS2000-Series Digital Storage Oscilloscope hosted by Neurophysics Lab at UC San Diego
 Lab power supply at 5vdc
Leads for 5vdc test
Check noise of operating voltage
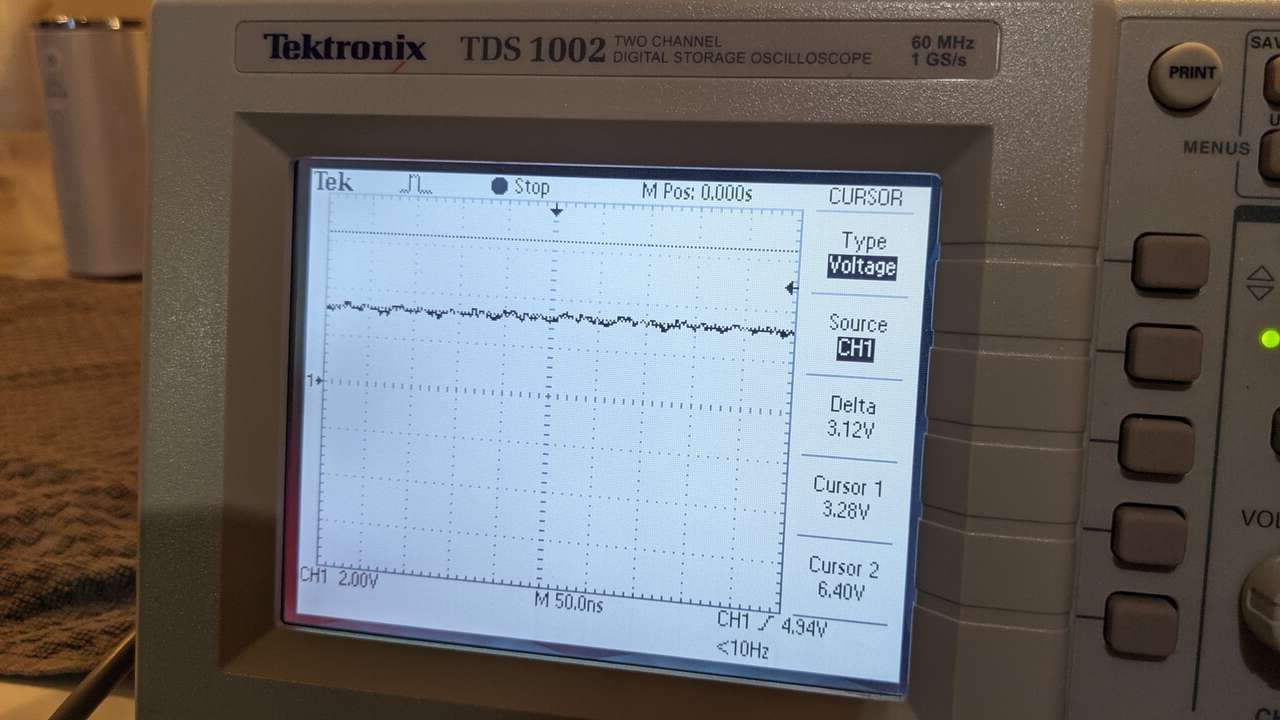
O-scope reading of 5vdc from lab power supply, at this point I have learned how to zoom in on curves and move horz and vert. I am very zoomed in at 200mV per grid.
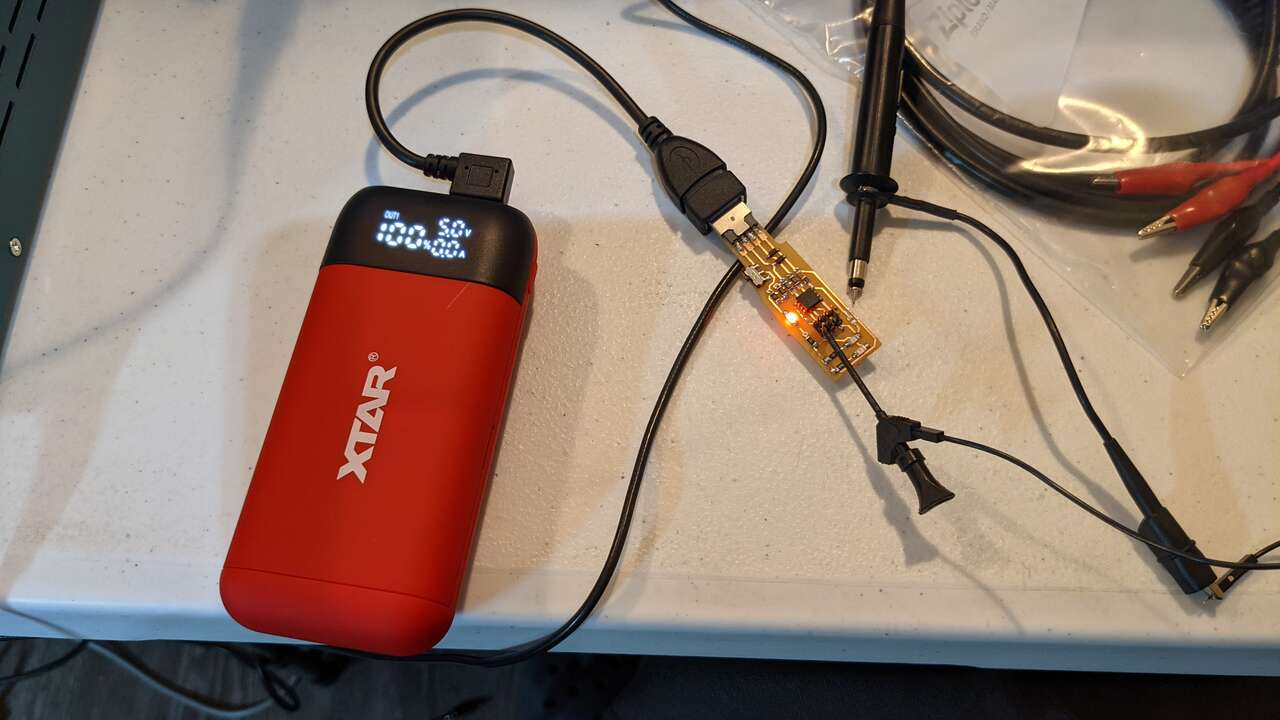
Let’s try and see if the 5vdc from this xtar 18650 USB power bank look any different.
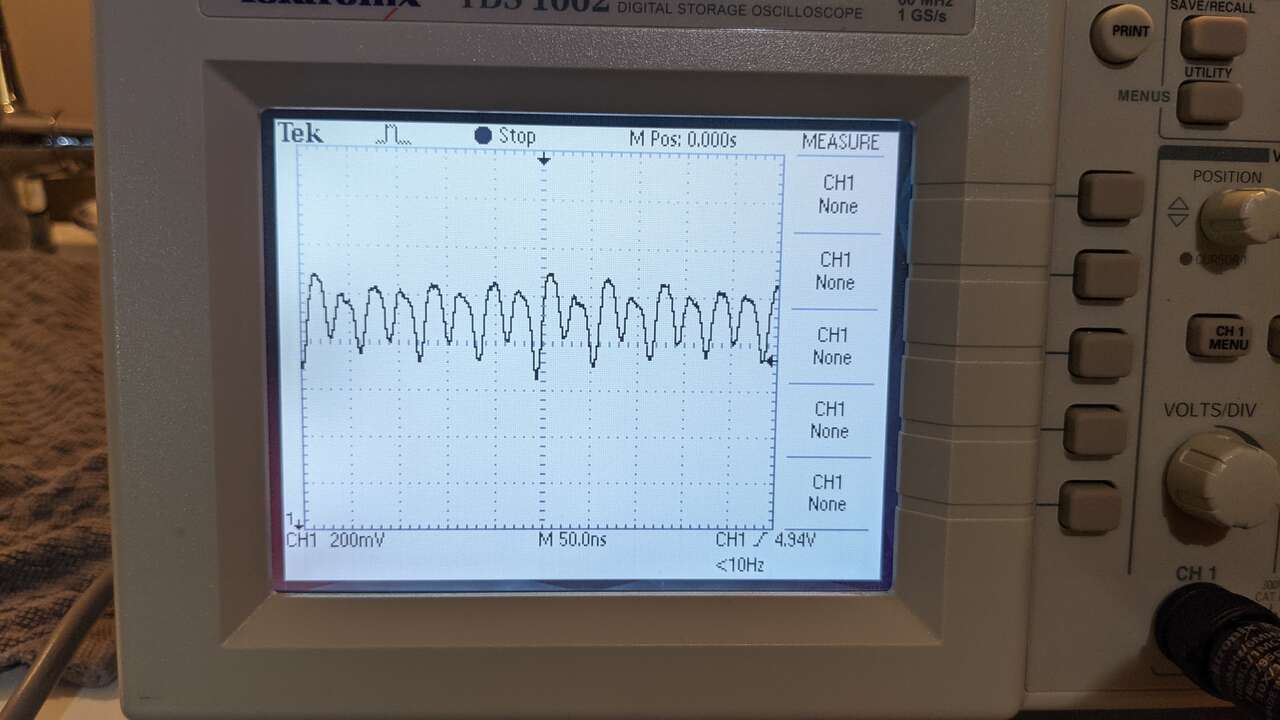
Yep it looks different, a little wider 5vdc sweep, but not much more sweep at all, I am very zoomed in at 200mV per grid.
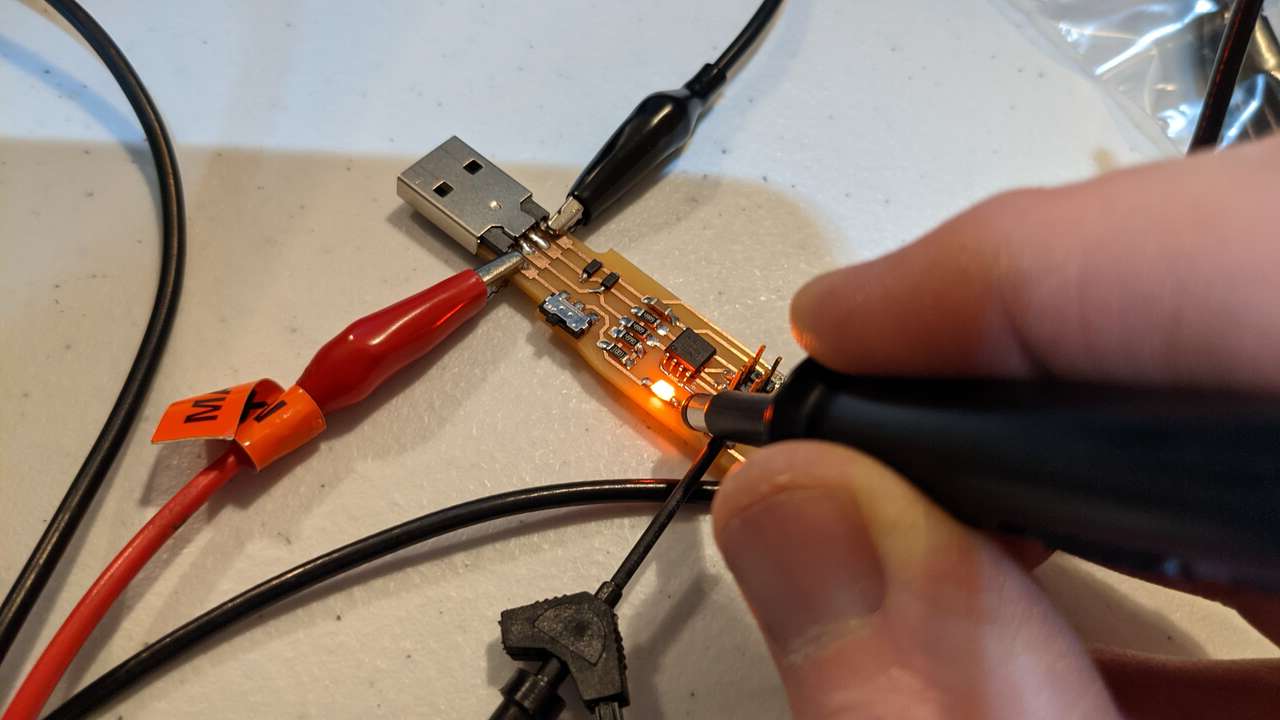
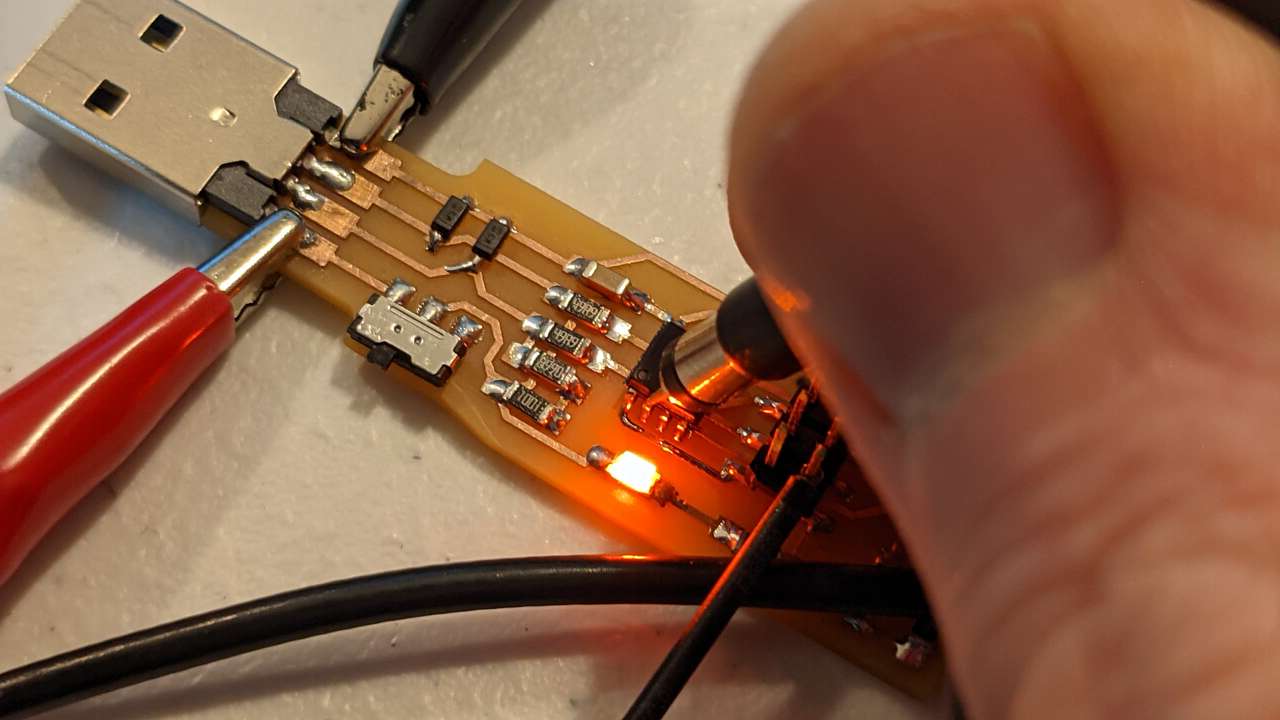
Let’s try measuring this point just after the ORG LED.
Here is the reading, I learned how to move cursor at this point. The reading is 3.28V at the cursor.
 What’s the voltage on the pin 2 of the MCU?
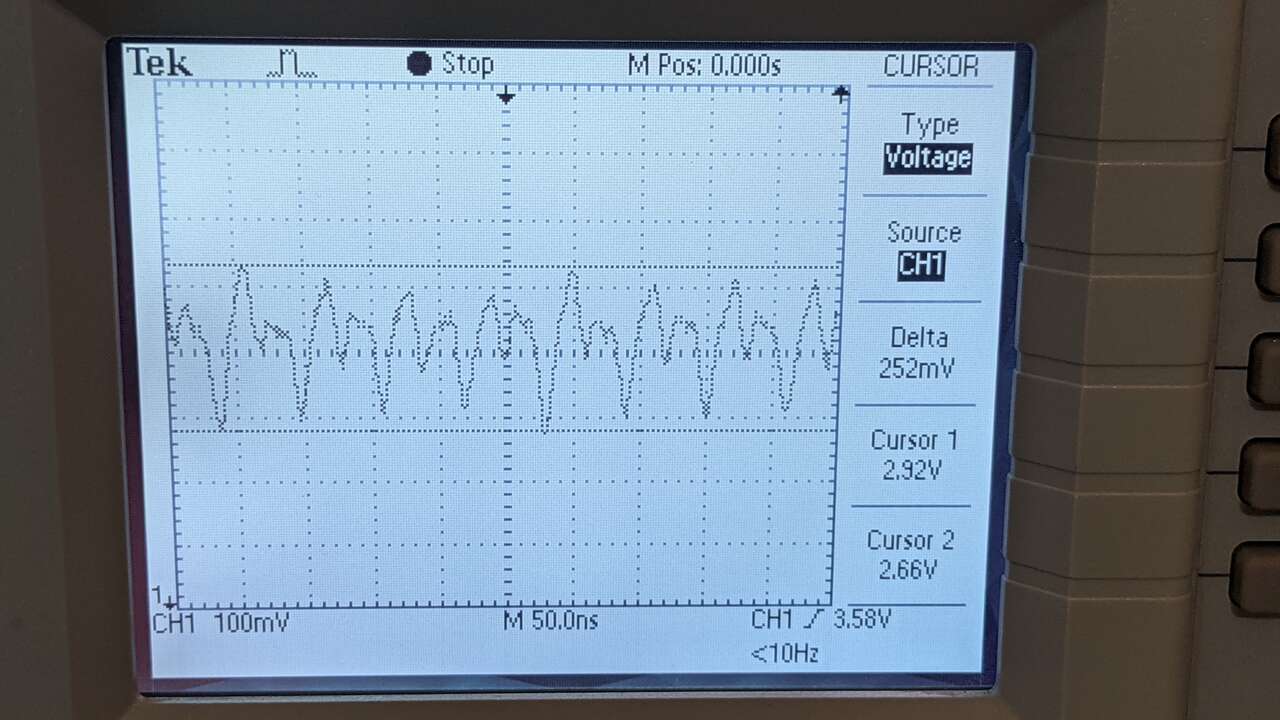
Here I learned how to move two cursors and I zoomed in to 100mV per grid section. Delta is 252mV, Max 2.92V Min 2.66V
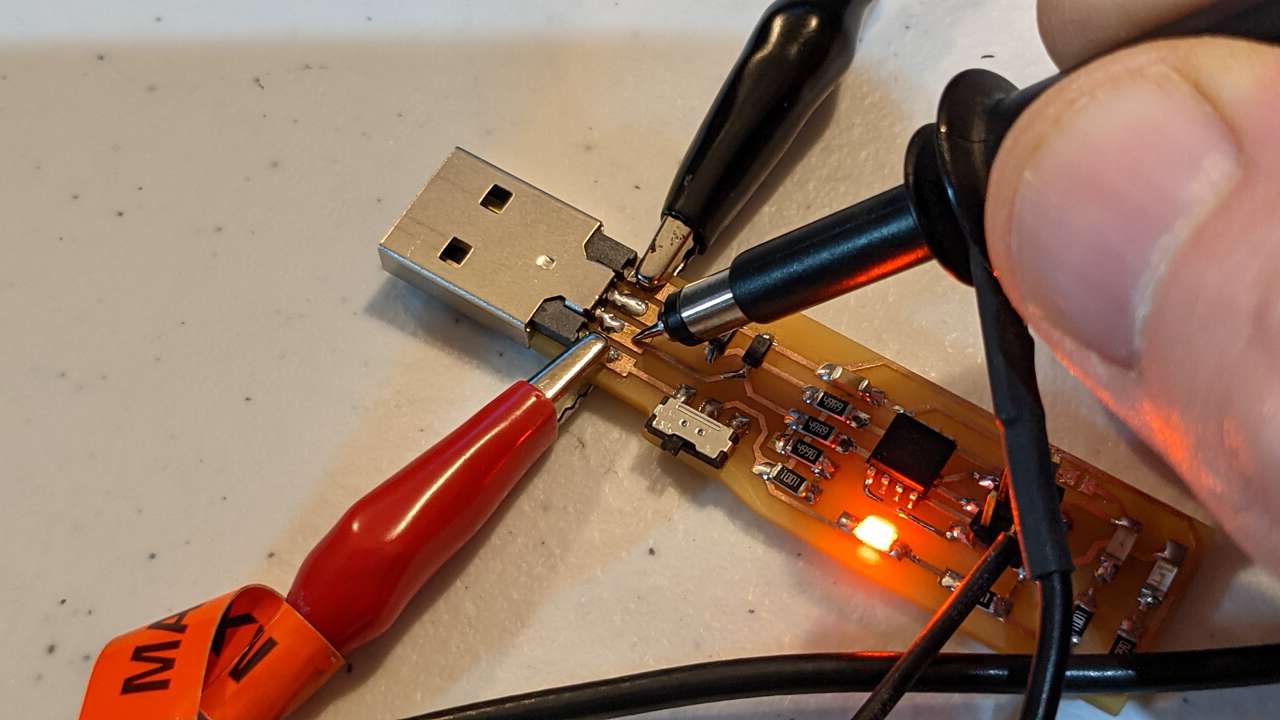
Let’s measure the voltage at this pad on the USB
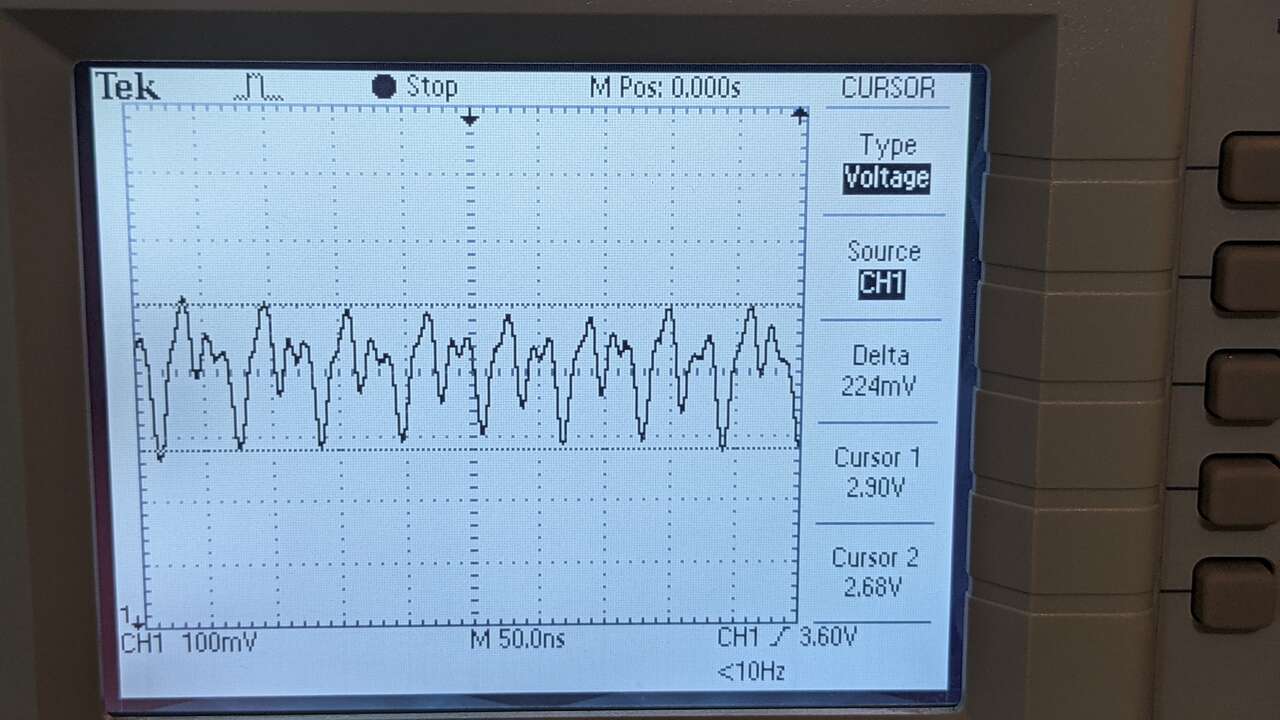 Delta is 224mV, Max 2.90V Min 2.68V
Interpret a data signal
I just purchased the low cost $180 Miniware DS213 Oscilloscope for our Fab Lab. This is my first time measuring signals on an Oscilloscope, let’s see what happens! I watched the video Tutorial. DS213 Oscilloscope to learn.
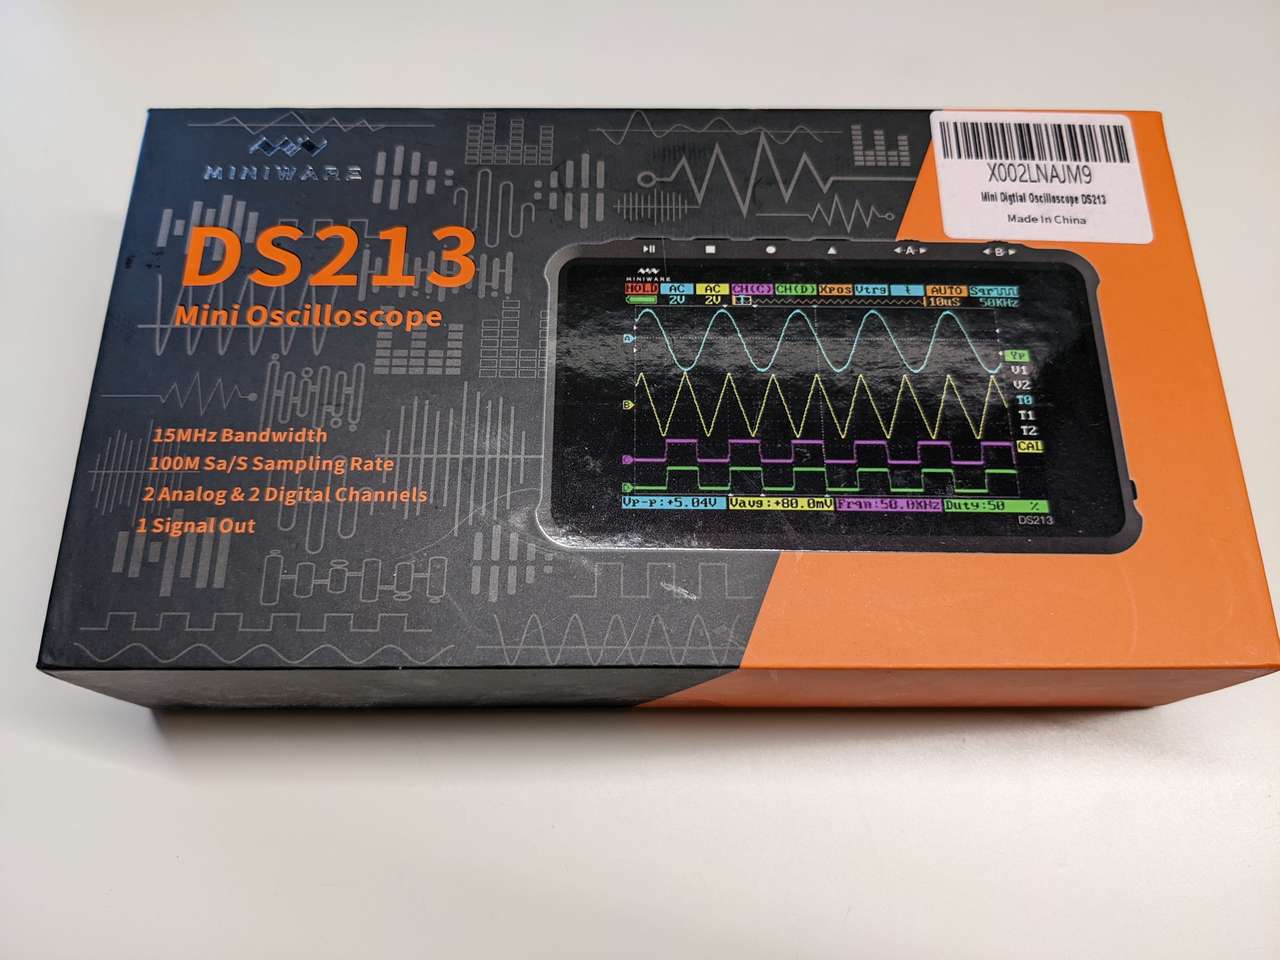 Box
Box
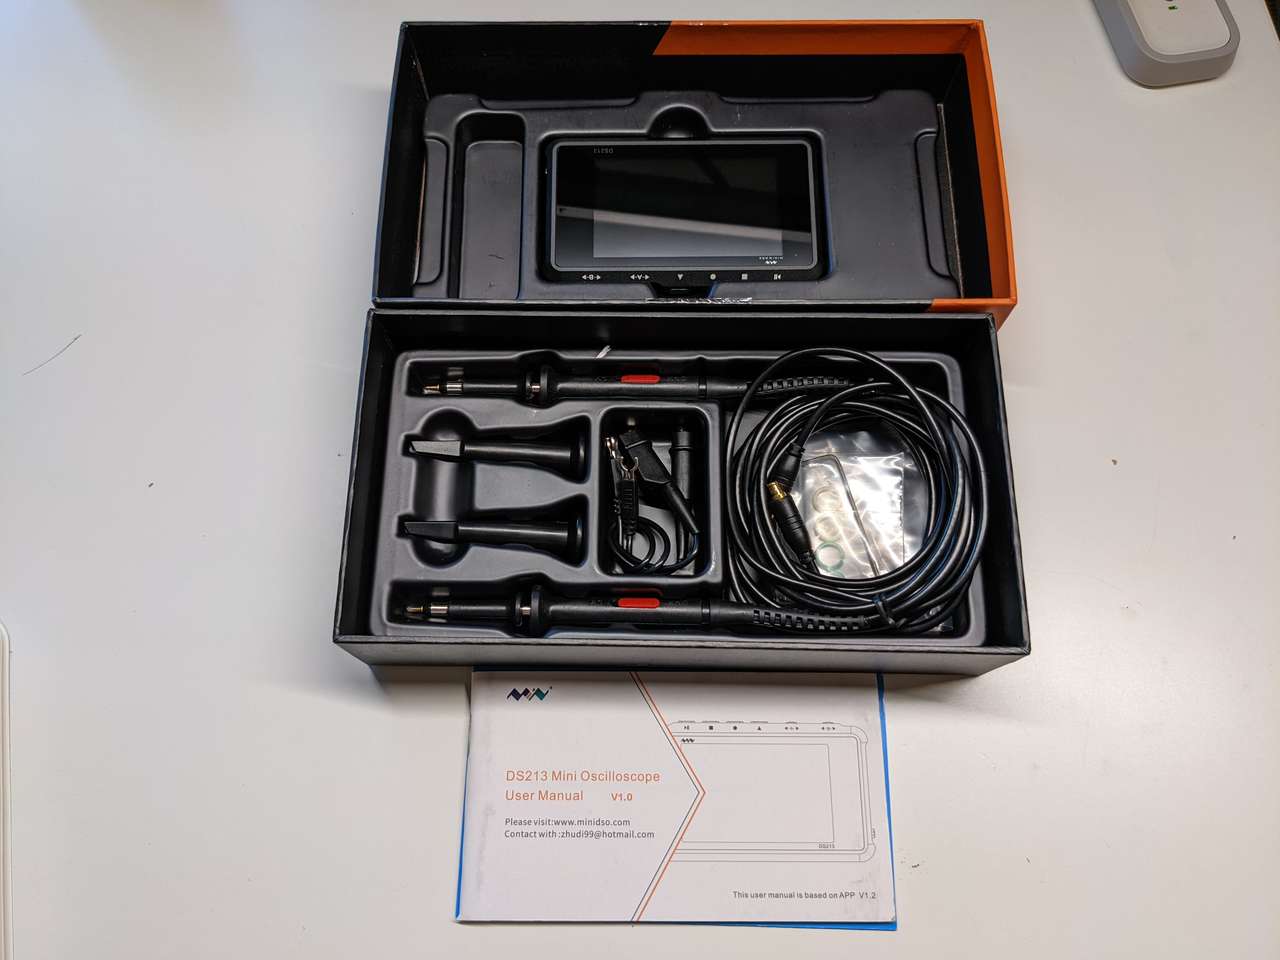
Inside box
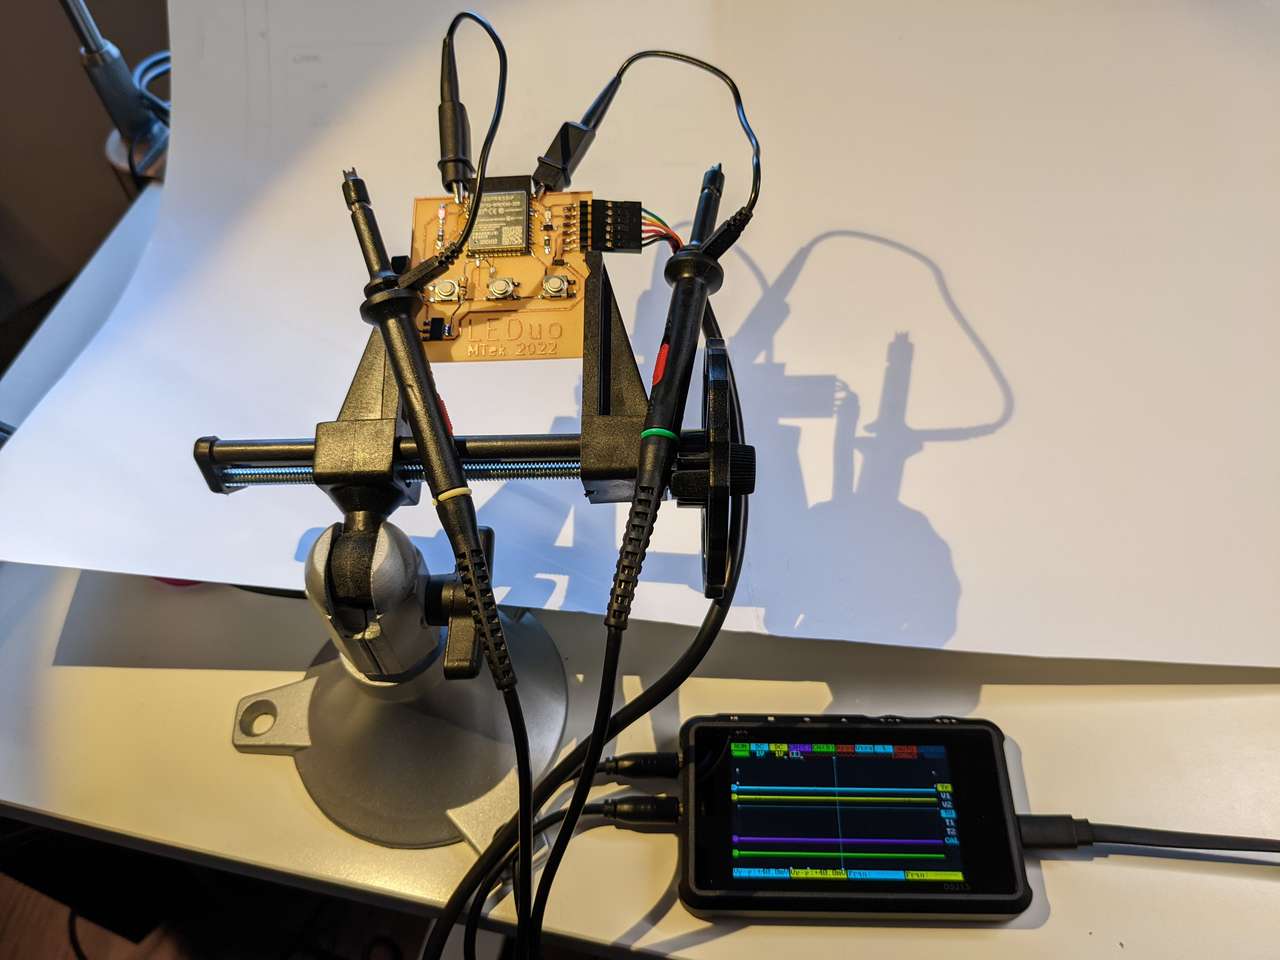
Ground and probes connected LEDuo board.
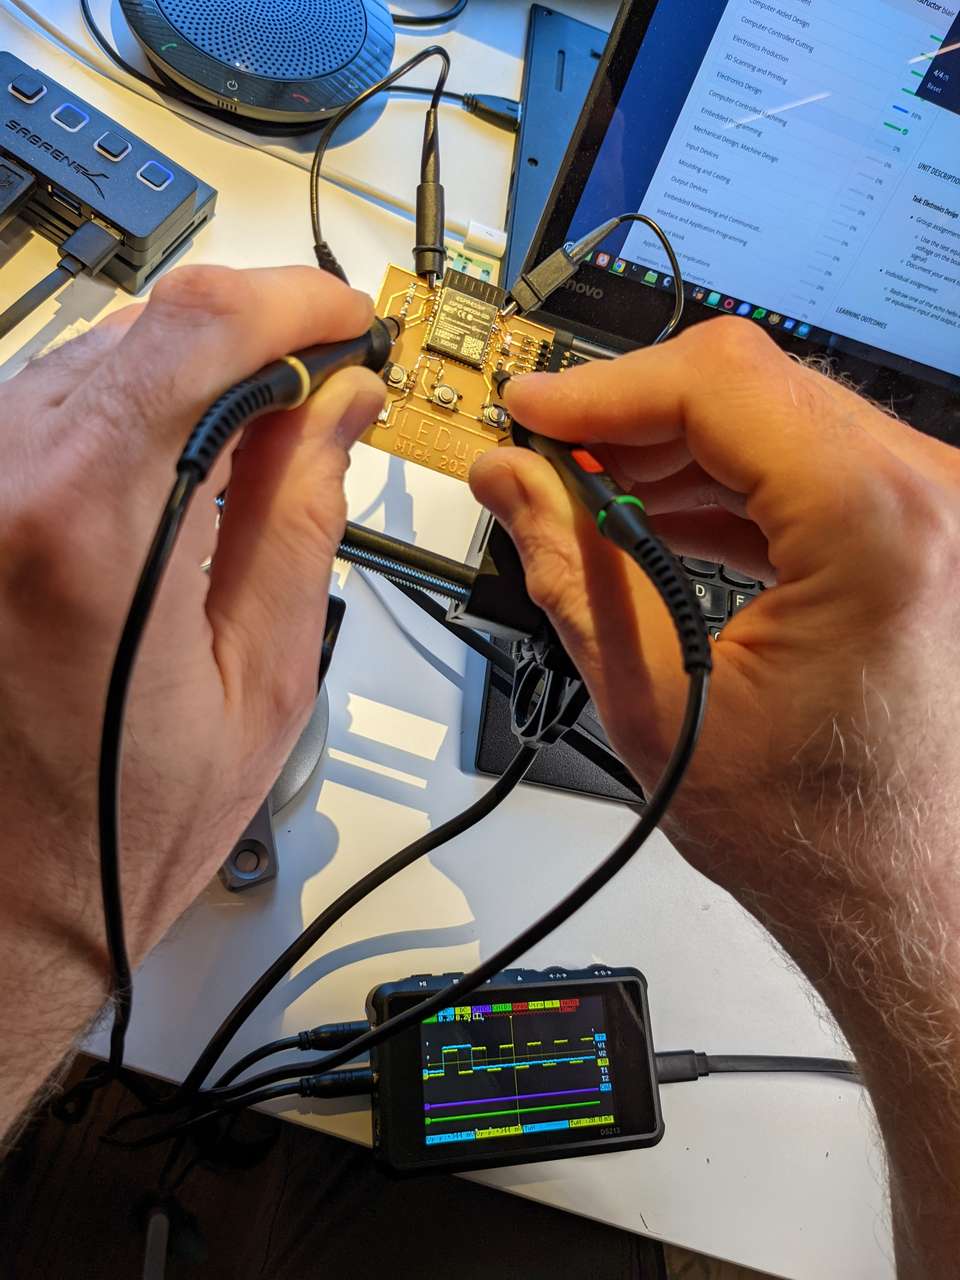
Probing LED outputs.
I set the CHA and CHB to DC, and the horizontal grid to 0.2V for both channels. I moved CHA and B to a point in the middle bottom of the horizontal trigger line. I changed the vertical grid to 50ms
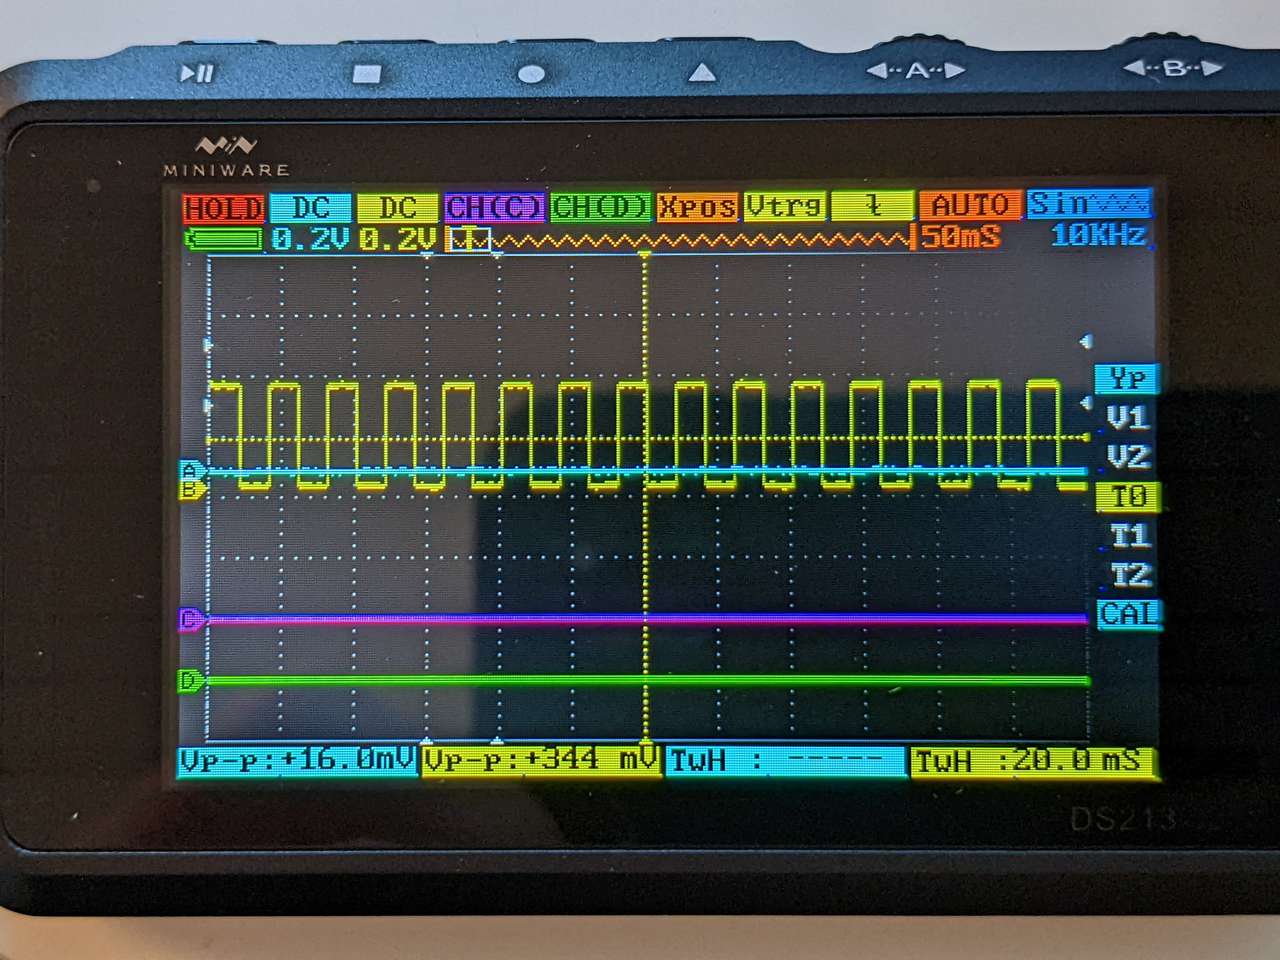
In the photo above you can see Channel B (Yellow Line) TwH (Time Width High) is 20.0ms, this means the LED on Channel B is on for 20.0 ms.
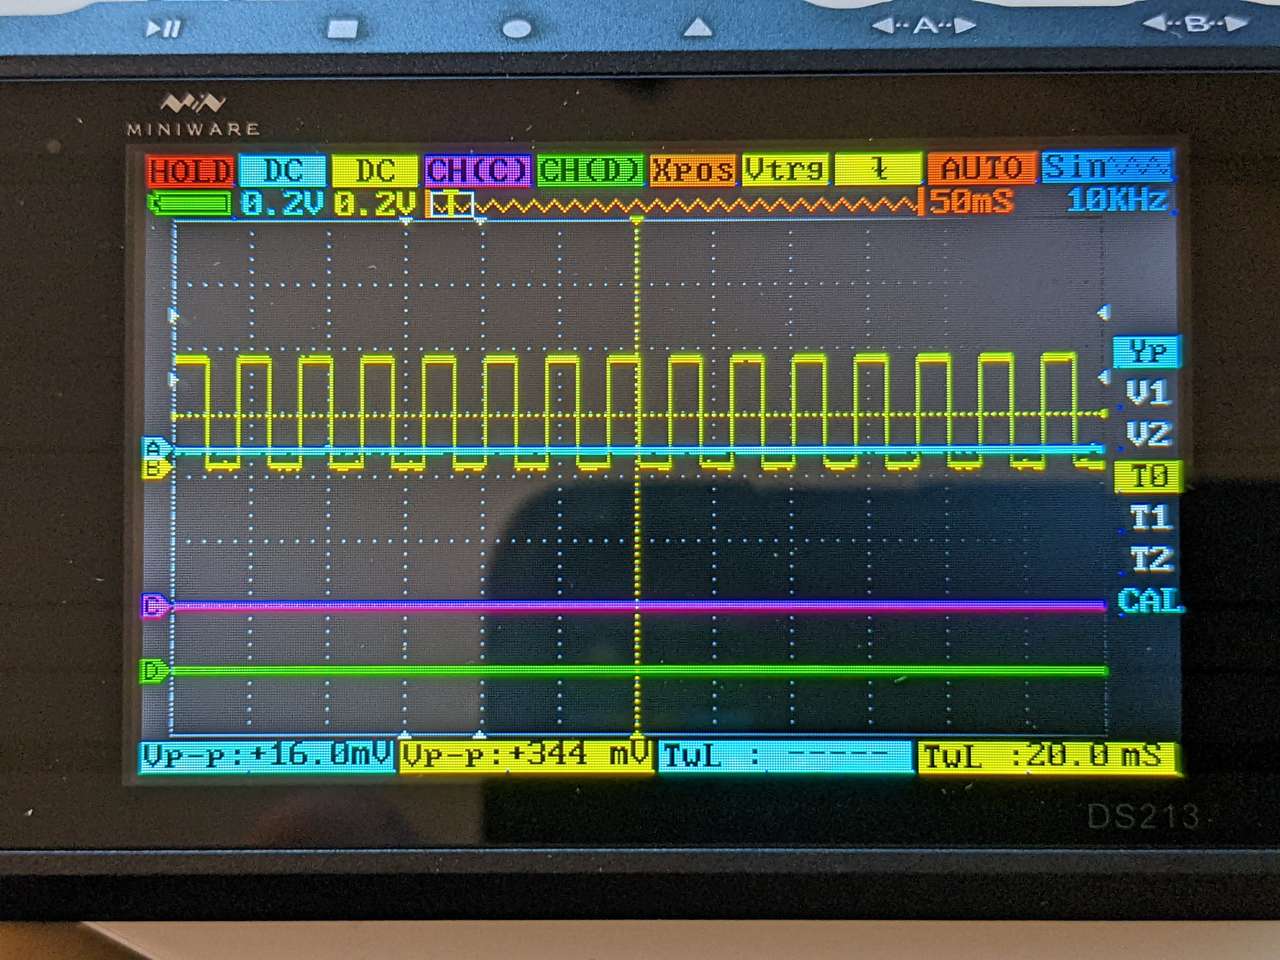
In the photo above you can see Channel B (Yellow Line) TwL (Time Width Low) is 20.0ms, this means the LED on Channel B is off for 20.0 ms.
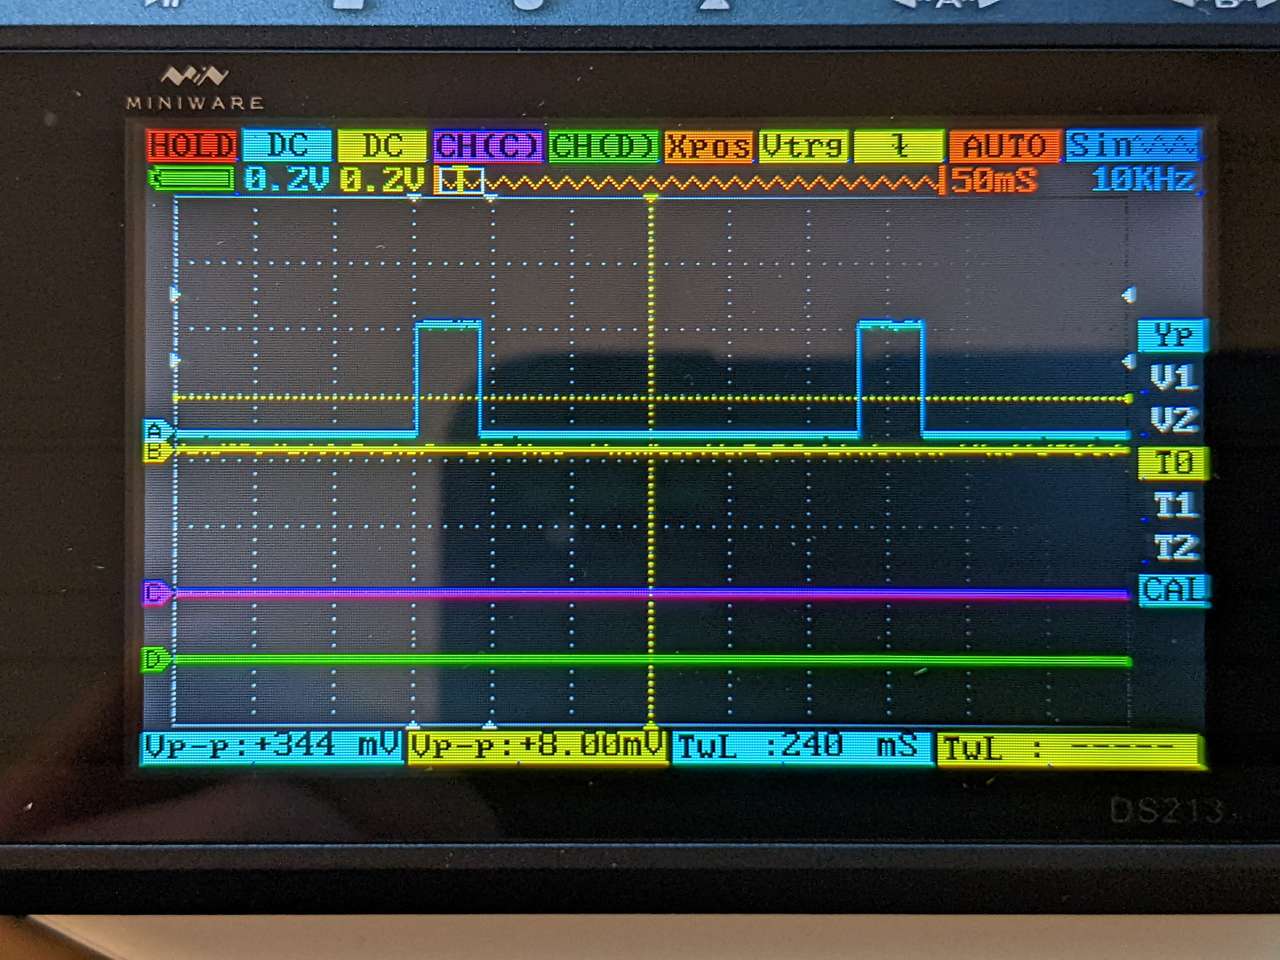
In the photo above you can see Channel A (Blue Line) TwL (Time Width Low) is 240 ms, this means the LED on Channel A is off for 240 ms.
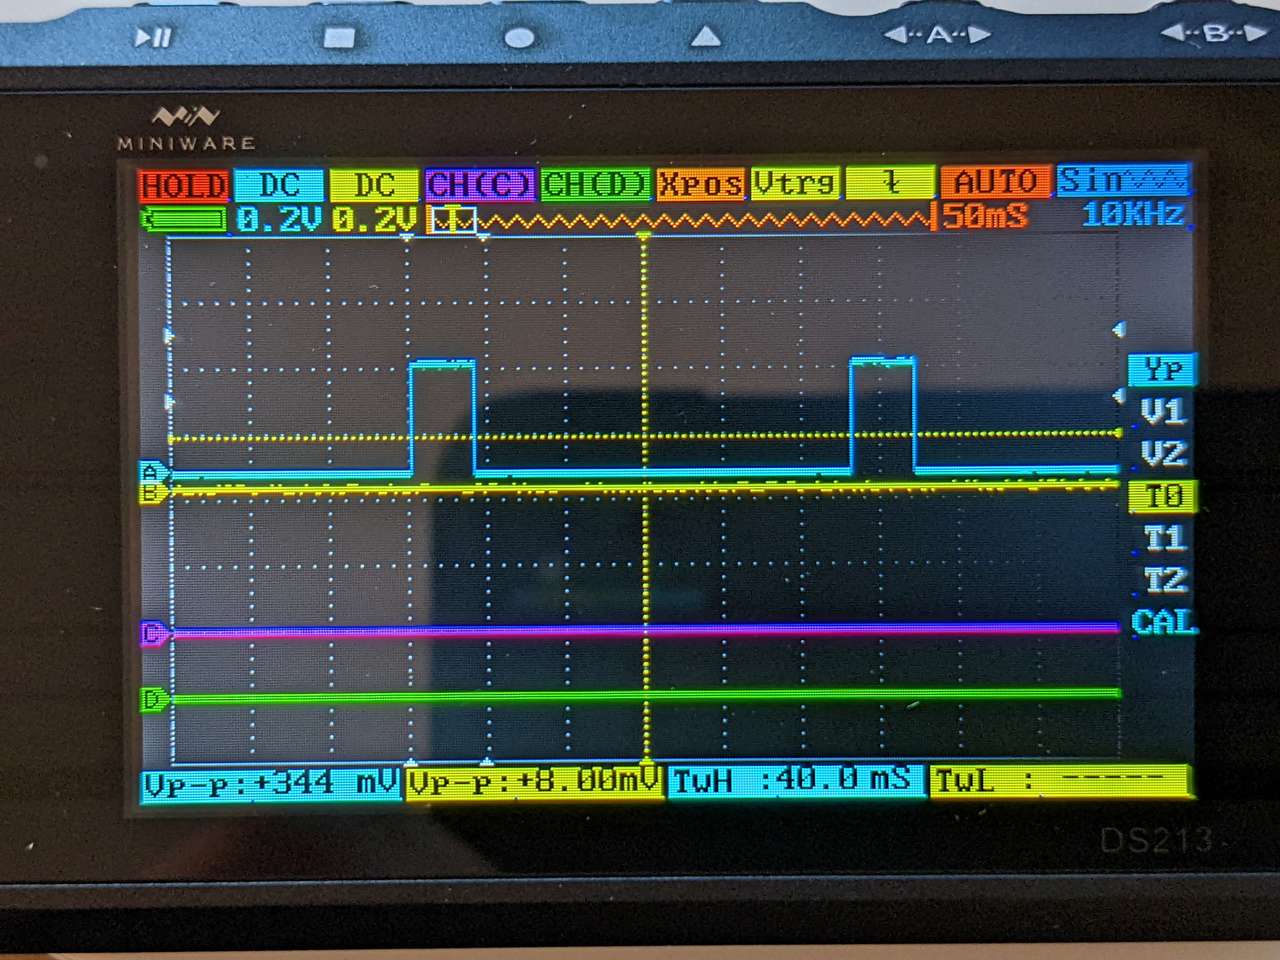
In the photo above you can see Channel A (Blue Line) TwH (Time Width High) is 40 ms, this means the LED on Channel A is on for 40 ms.
Using the Oscilloscope is a great way to check to see if the code I loaded on my board is doing what it was commanded in the real world.
The Miniware DS213 Oscilloscope works great! Also it’s limited options makes it less intimidating than more featured packed Oscilloscope.
Kyle-Pierre’s Assignment
Digital Multimeter (DMM) usage
Digital multimeter (DMM).
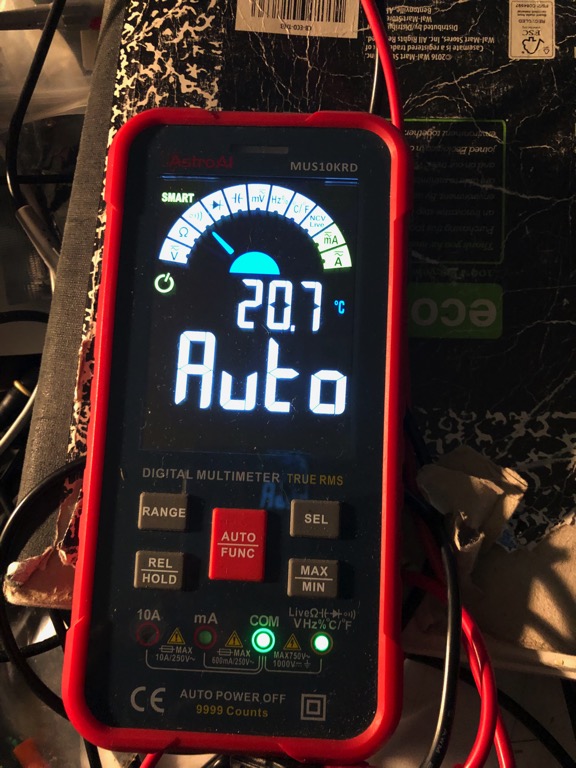 I used a multimeter to measure basic electrical quantities. It is a convenient device to make quick and basic measurements of components and circuitry. For this segment I used an AstroAI MUS10KRD Digital Multimeter . It detects impedance, voltage, current and capacitance automatically.
Measure resistance
Measure resistance of probe “short circuit.”
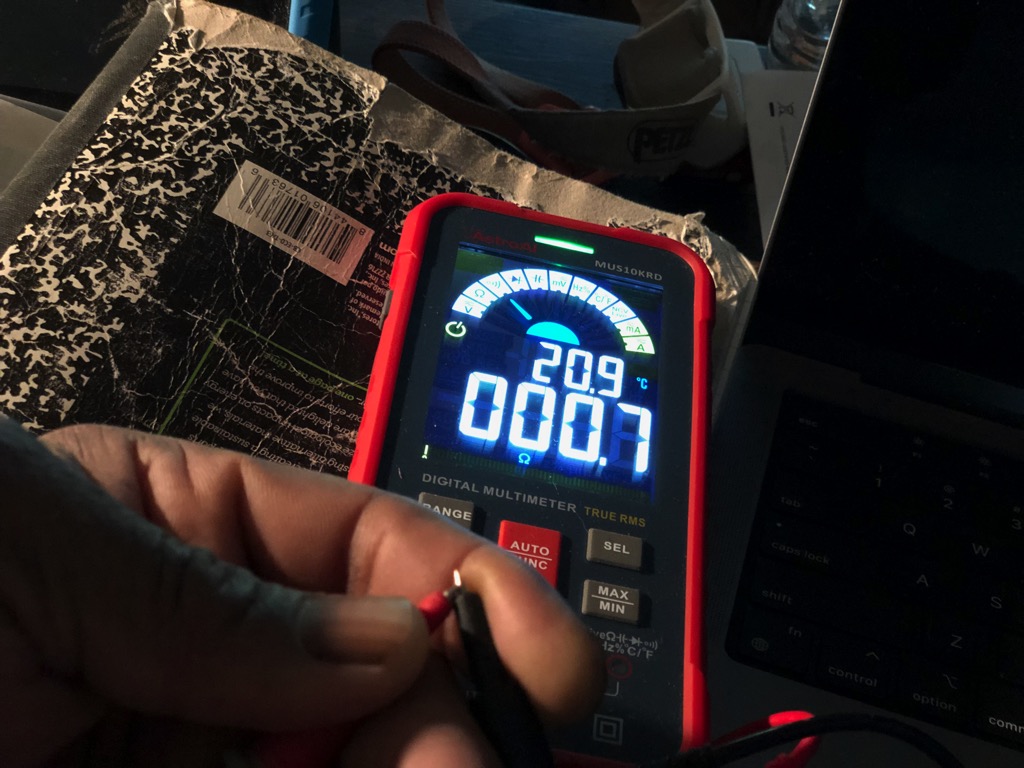 For most machines used in Fab Academy, it is a good idea to calibrate the meter or establish a baseline before using it.
One way to determine the precision of a DMM is to touch together the “live” and common probe tips. This creates a short circuit in the meter and should return zero ohm resistance. The picture above shows the resistance for my meter. The o.7 ohm resistance not zero, but it is negligible for my resistance measurements.
For most machines used in Fab Academy, it is a good idea to calibrate the meter or establish a baseline before using it.
One way to determine the precision of a DMM is to touch together the “live” and common probe tips. This creates a short circuit in the meter and should return zero ohm resistance. The picture above shows the resistance for my meter. The o.7 ohm resistance not zero, but it is negligible for my resistance measurements.
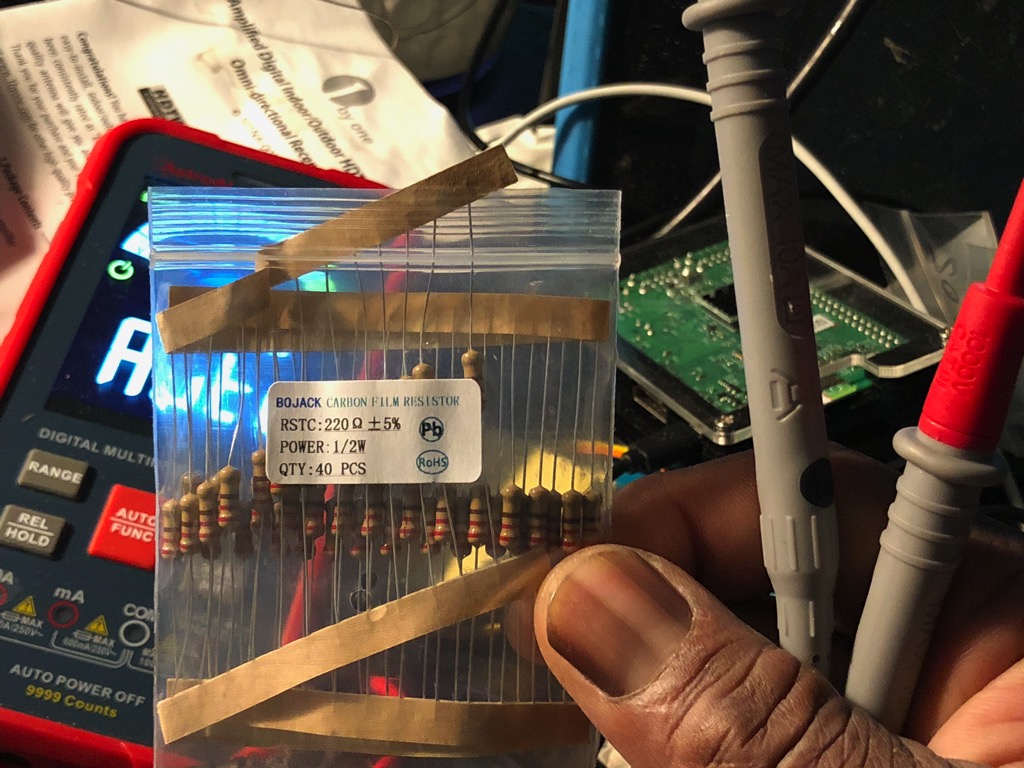
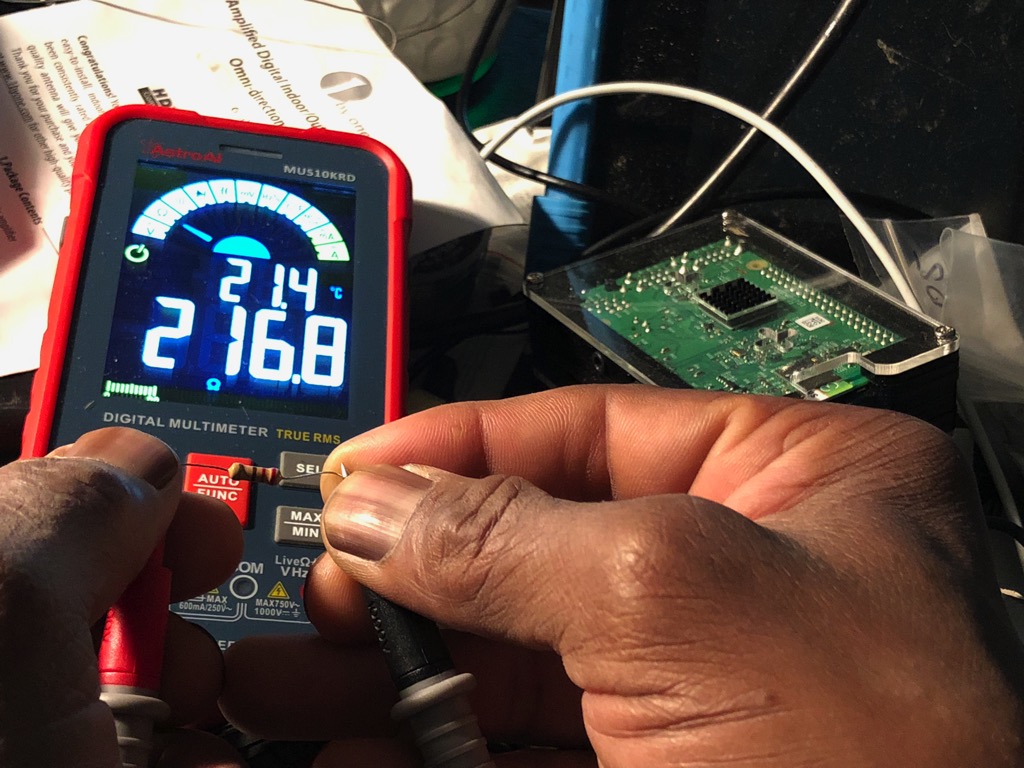
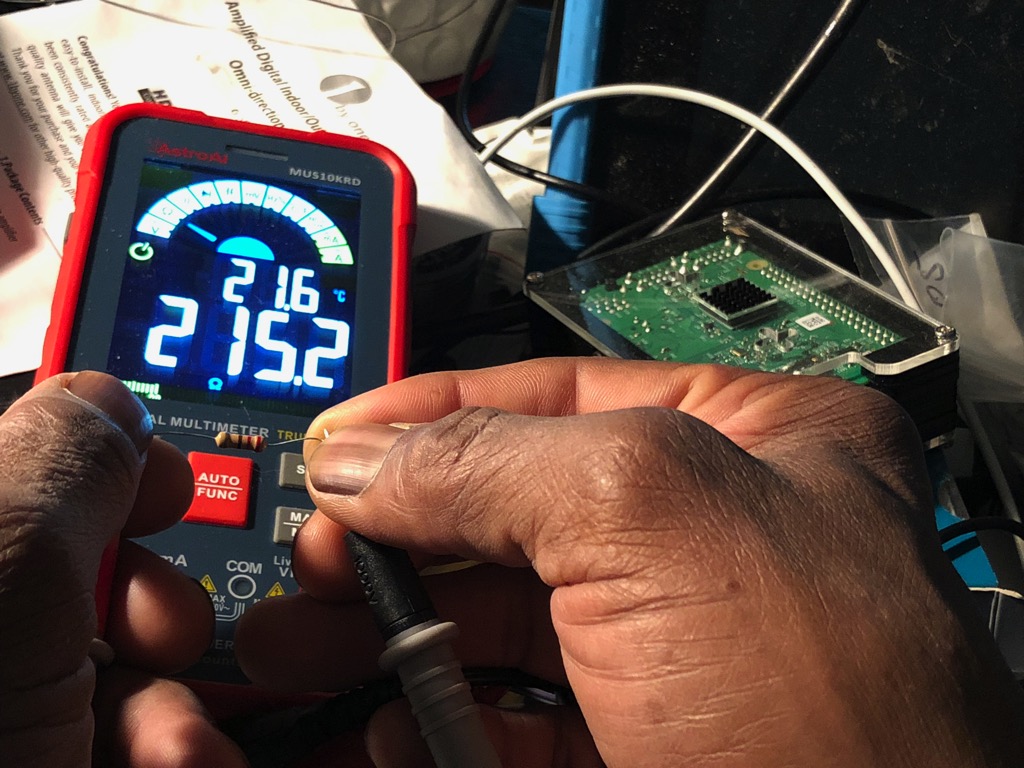 Measure resistance of 220 ohm resistor
Next, I compared stated resistor values to measured quantities. From the package that contains the resistor, I expect a reading of 220 ohms. Also, from the label, I expect a deviation as high as +/- 5%. Further, we could determine these values from the resistor bands (red, red, brown, yellow) printed on the resistor.
The two readings above of 215.2 ohms and 216.8 ohms respectively, fall within the 209-231 ohms range indicated (1.8% average deviation). I took the readings while holding the resistor and probes in my hands. Placing the resistor in a breadboard and then taking the readings may have improved the measurement precision.
Measure resistance of 220 ohm resistor
Next, I compared stated resistor values to measured quantities. From the package that contains the resistor, I expect a reading of 220 ohms. Also, from the label, I expect a deviation as high as +/- 5%. Further, we could determine these values from the resistor bands (red, red, brown, yellow) printed on the resistor.
The two readings above of 215.2 ohms and 216.8 ohms respectively, fall within the 209-231 ohms range indicated (1.8% average deviation). I took the readings while holding the resistor and probes in my hands. Placing the resistor in a breadboard and then taking the readings may have improved the measurement precision.
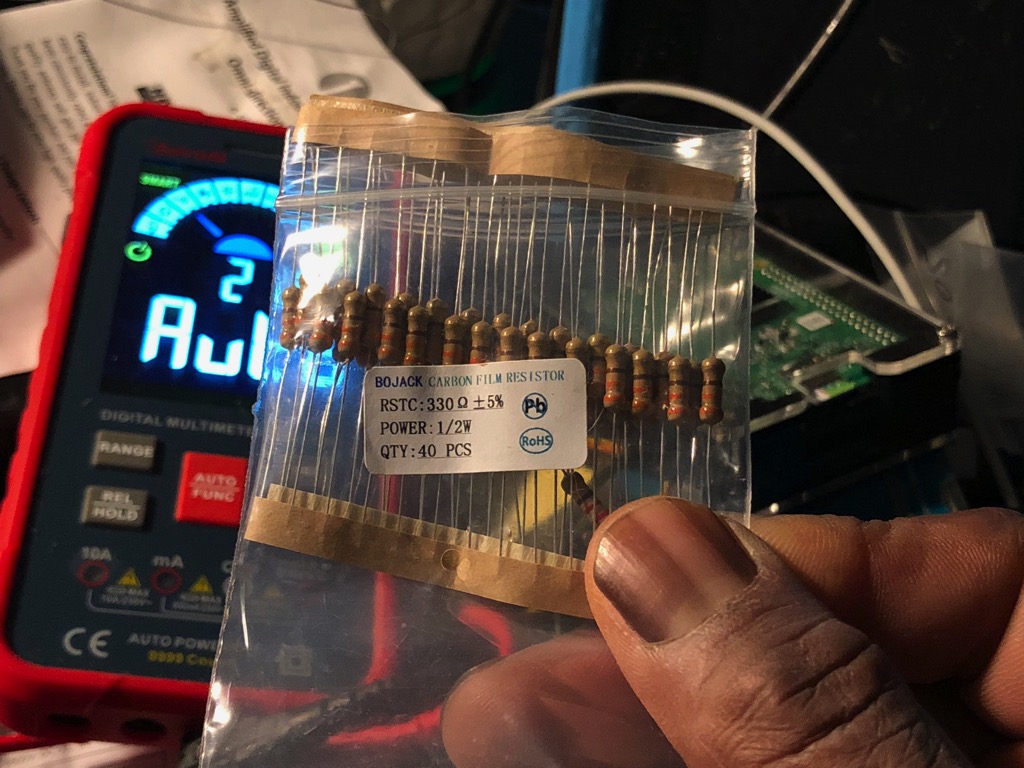
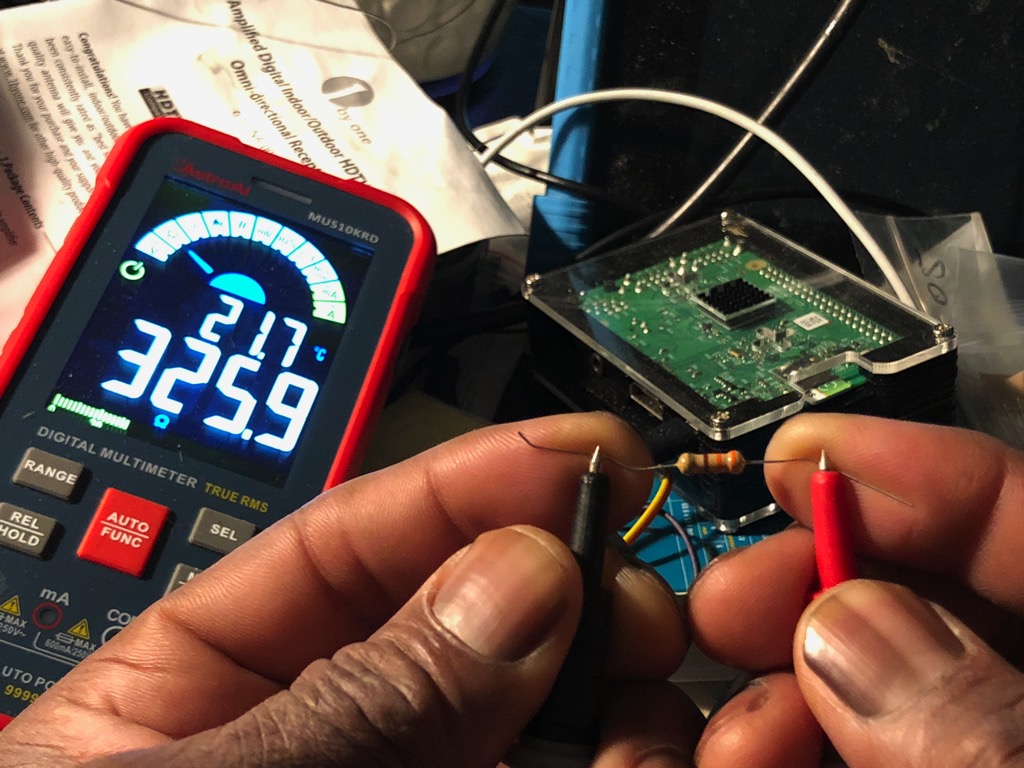 Measure resistance of 330 ohm resistor.
The 330 ohms resistor produced similar results; 325.9 ohms and 3e26.4 ohms. These quantities also fall within the 5% tolerance (1.2% average deviation from expected values).
Measure resistance of 330 ohm resistor.
The 330 ohms resistor produced similar results; 325.9 ohms and 3e26.4 ohms. These quantities also fall within the 5% tolerance (1.2% average deviation from expected values).
Measure voltage
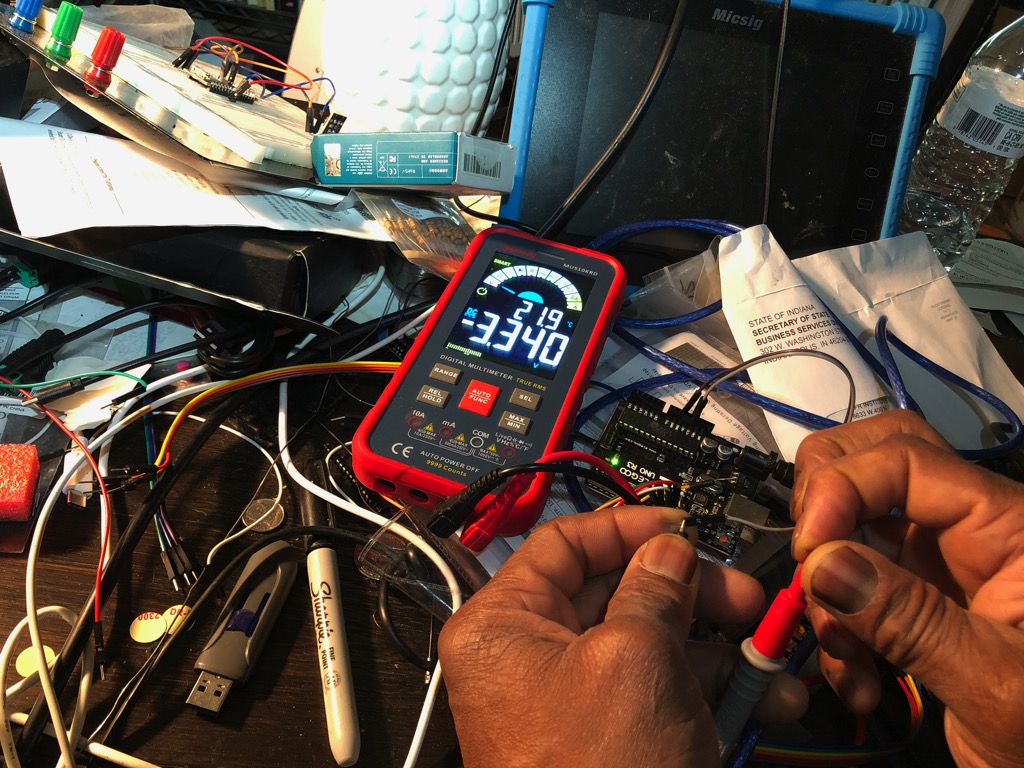
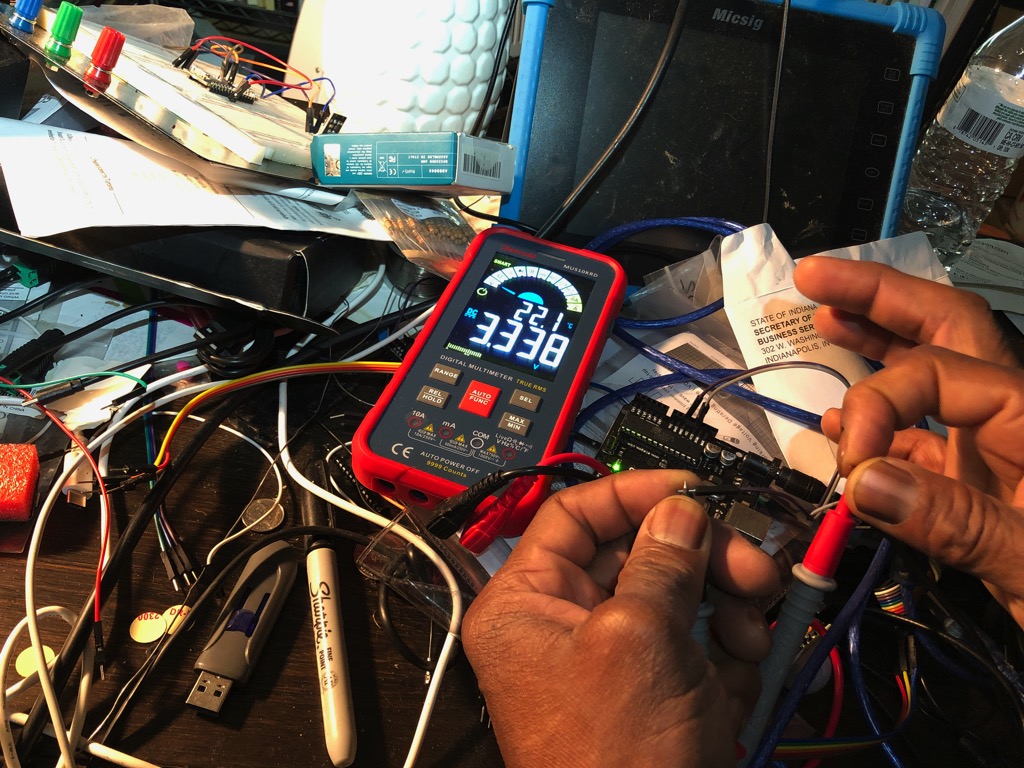 Measure voltage across 3.3V and GND pins of UNO.
This multimeter can measure voltage for direct and alternating current circuits. The Arduino Uno provides pins of 3.3v and 5v. These can be used to drive components such as sensors and actuators that require these voltages as long as the current requirements remain low enough.
The images at the top of this section show the voltage drop between the ground and 3.3v pins. I used USB from a Macbook Pro to power the Arduino. I took one reading with common connected to the ground pin and the other with common touching the 3.3v pin. They returned the 3.3v as expected.
Measure voltage across 3.3V and GND pins of UNO.
This multimeter can measure voltage for direct and alternating current circuits. The Arduino Uno provides pins of 3.3v and 5v. These can be used to drive components such as sensors and actuators that require these voltages as long as the current requirements remain low enough.
The images at the top of this section show the voltage drop between the ground and 3.3v pins. I used USB from a Macbook Pro to power the Arduino. I took one reading with common connected to the ground pin and the other with common touching the 3.3v pin. They returned the 3.3v as expected.
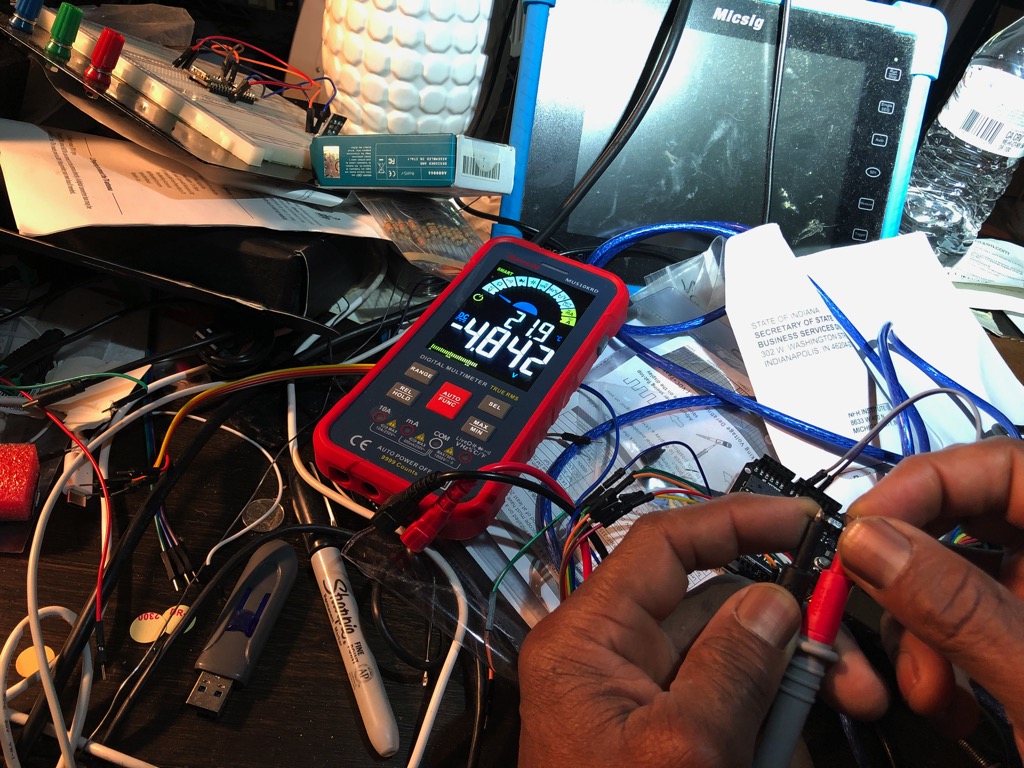
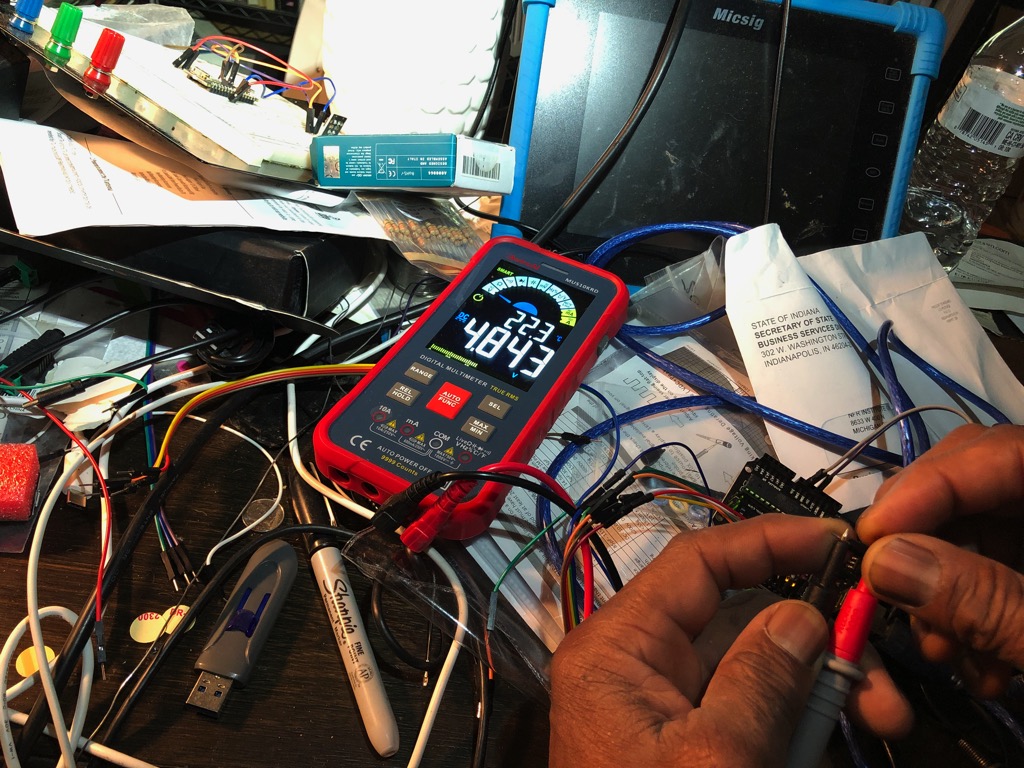 Measure voltage across 5.0V and GND pins of UNO.
The 5v readings recorded lower than expected values for the 5v pin. I believe that the USB hub that I used reduced the voltage output from the notebook computer. Perhaps, I will try this reading again with an external power supply.
Measure voltage across 5.0V and GND pins of UNO.
The 5v readings recorded lower than expected values for the 5v pin. I believe that the USB hub that I used reduced the voltage output from the notebook computer. Perhaps, I will try this reading again with an external power supply.
Oscilloscope usage
Probably the least understood yet most useful tool in the shop–certainly in the test equipment suite. It does not make anything and has few analogs in everyday life. We have several o-scopes in the lab. I chose to use the Micsig TO1104 for this assignment because it offers a “UART trigger.” (More on triggers later.) I followed the AddOhms episode 28, oscilloscope tutorial.
Start in known state.
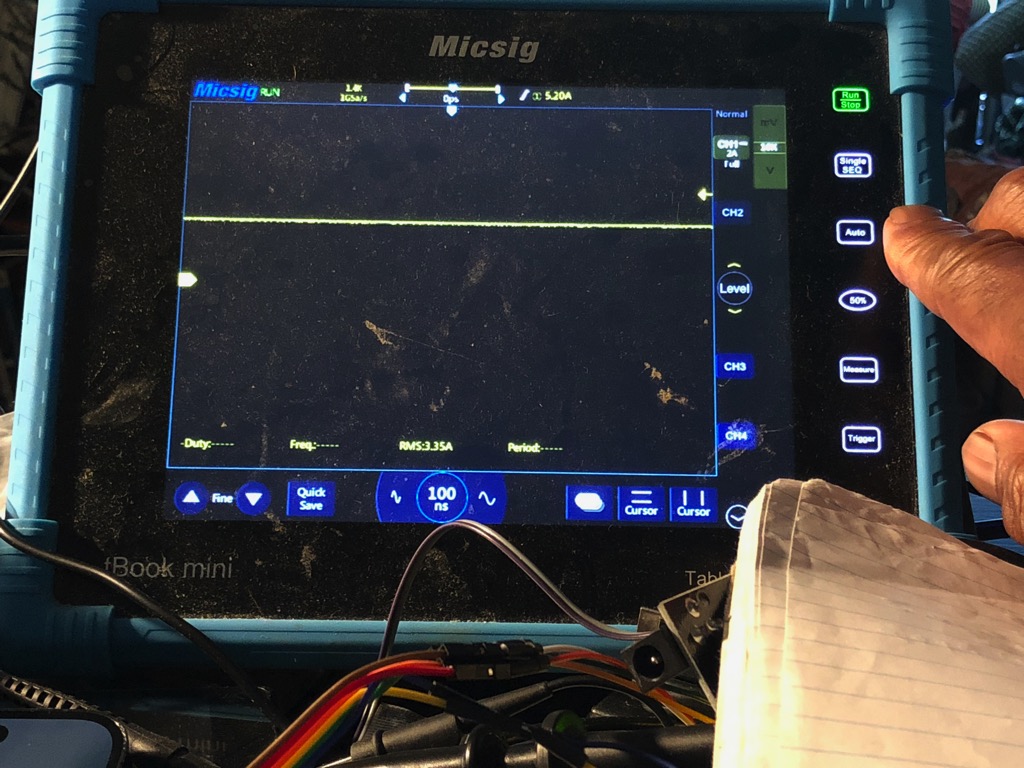 .
Use “Auto Set” to set oscilloscope with default values.
.
Use “Auto Set” to set oscilloscope with default values.
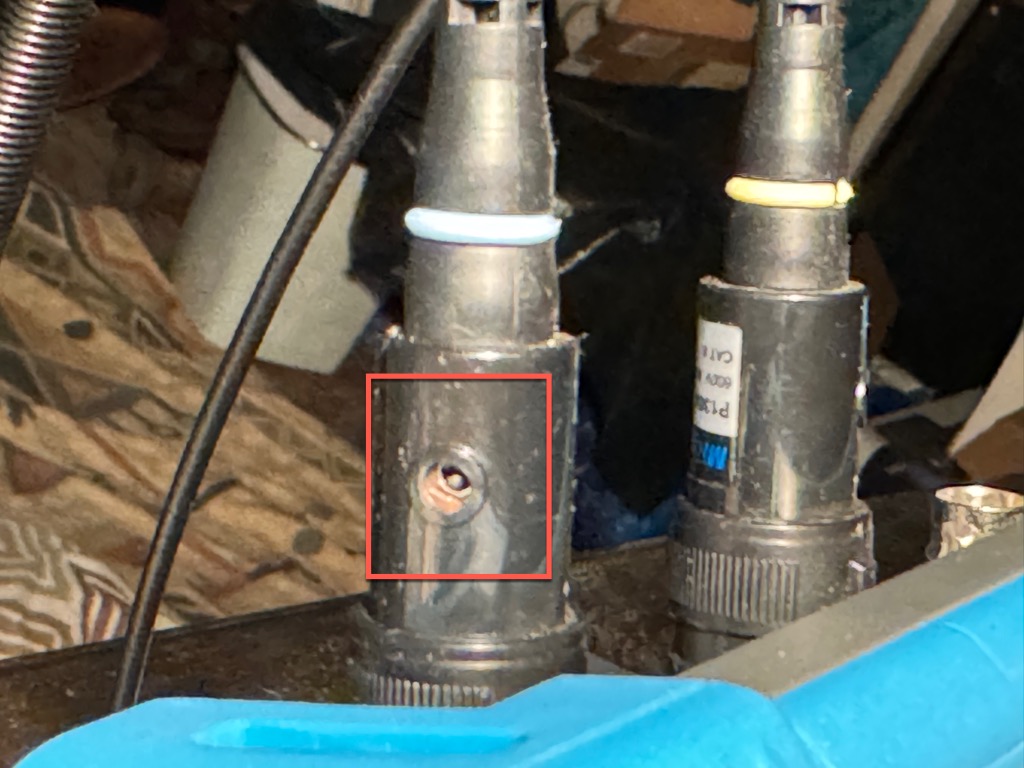
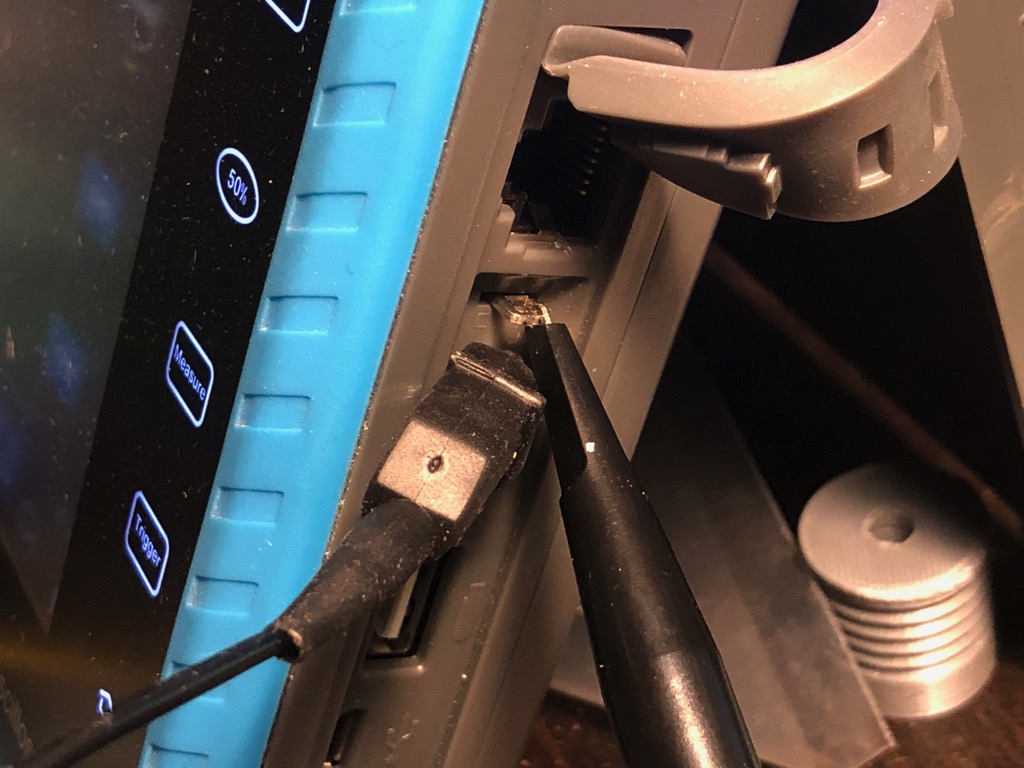 Connect one of the channel probes to one of the test terminals. Connect the ground lead to the other one.
 The peak, valley and several periods of the sine wave should appear on the scope.
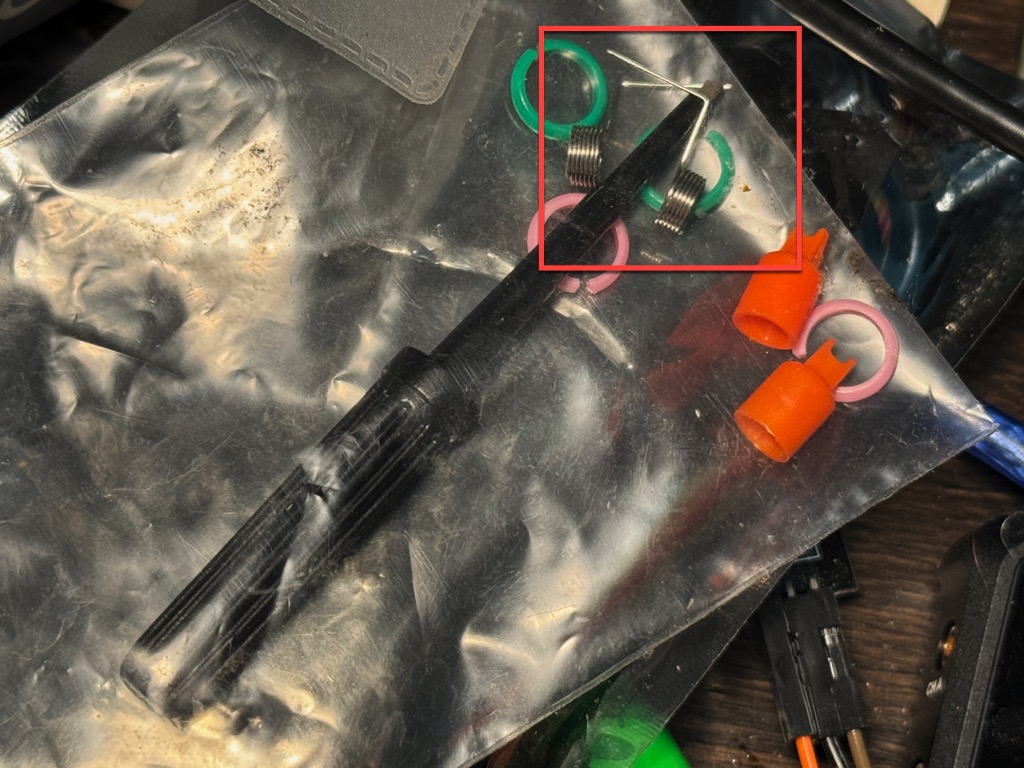
 If necessary, use the supplied tool to adjust the shape of the signal so the top edge of the peak is flat.
 This is a picture of a test signal of 2V peak to peak and 1ms period
Measure DC voltage.
Press “Measure” to find a list of quantities to measure. Add “Max” to measure maximum voltage amplitude.
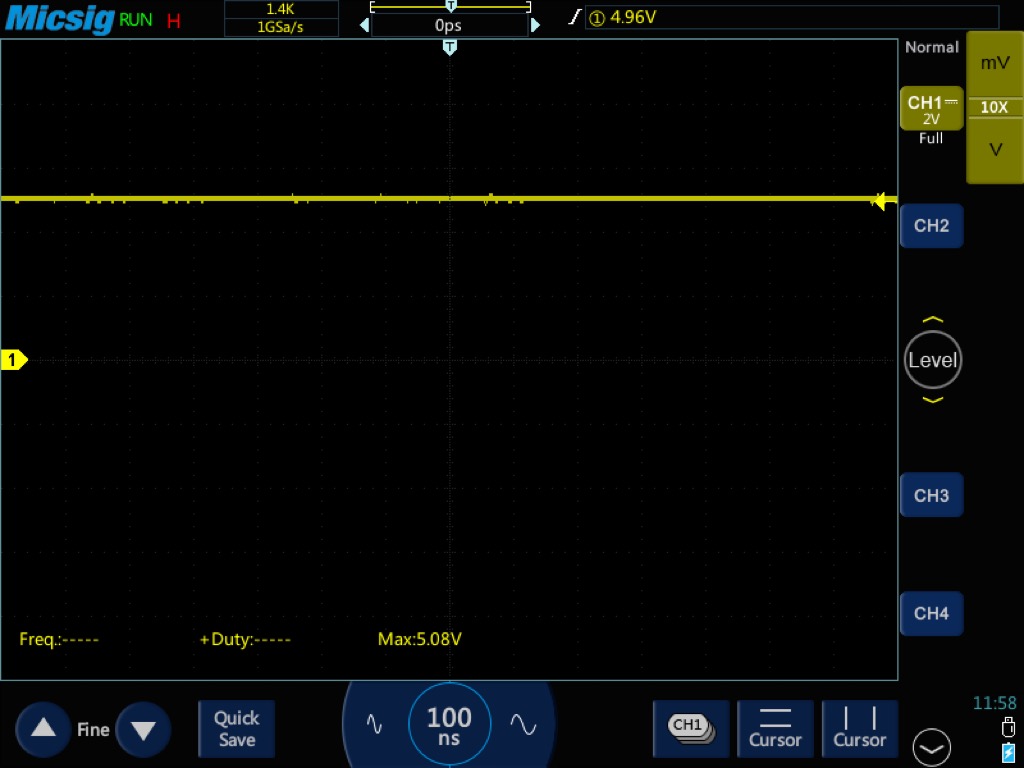 Micsig measured the voltage drop with channel one probe on 5.0V pin and ground clip of probe connected to GND (forward direction) as 5.08V max “measured value” at the bottom of the screen.
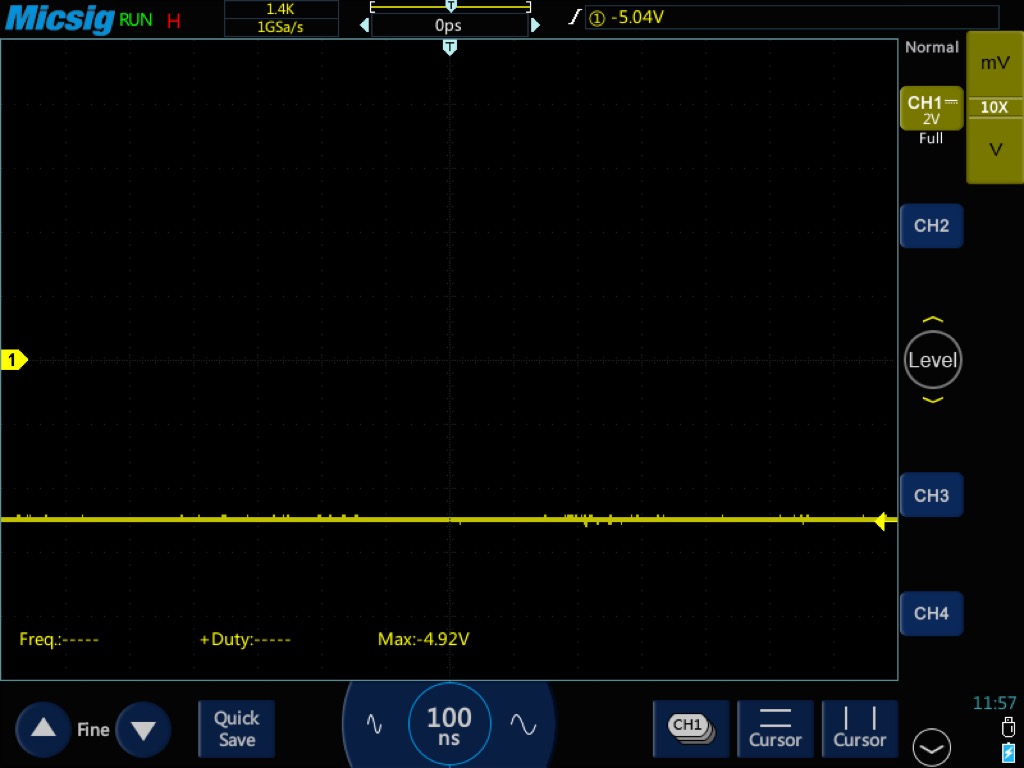 .
The oscilloscope also measured -4.92V max with probe and clip reversed.
.
The oscilloscope also measured -4.92V max with probe and clip reversed.
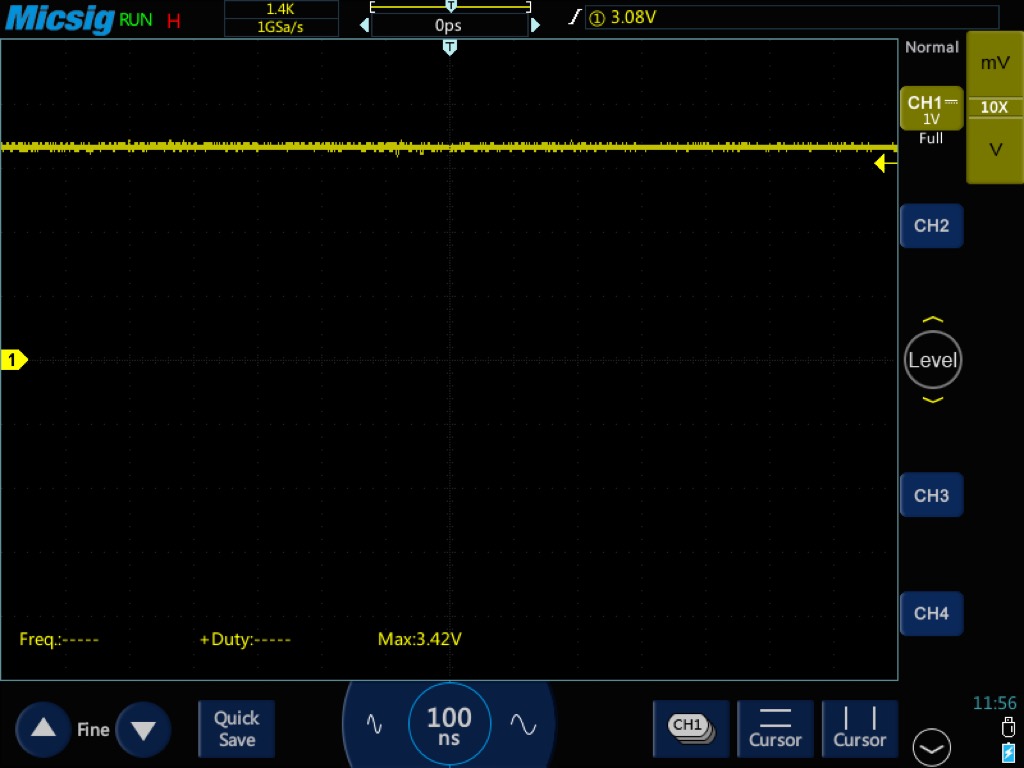 It measured the 3.3V pin to GND voltage drop as 3.42V max in the forward directions.
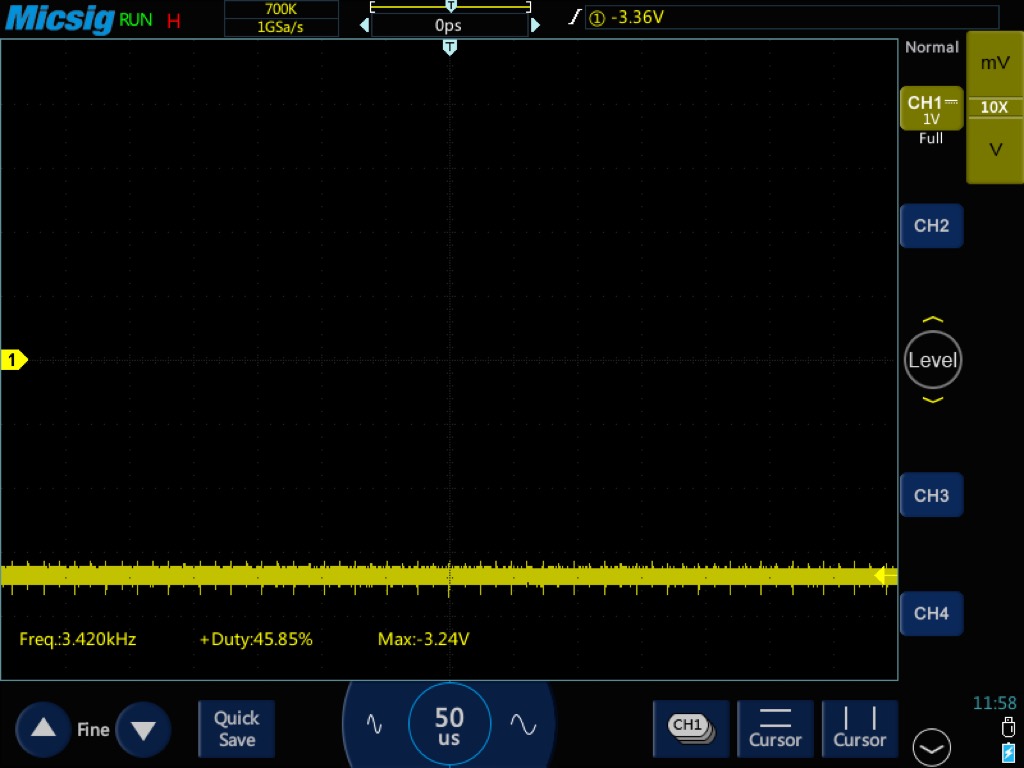 The TO1104 recorded -3.24V max for the reverse measurement.
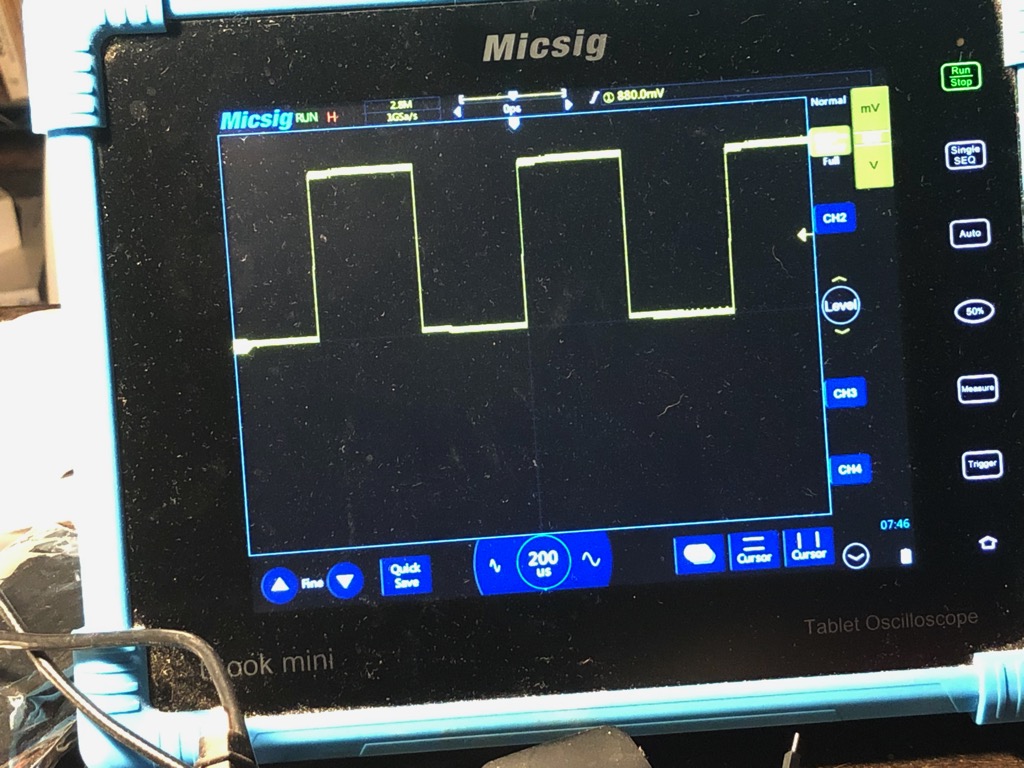
PWM & measurements
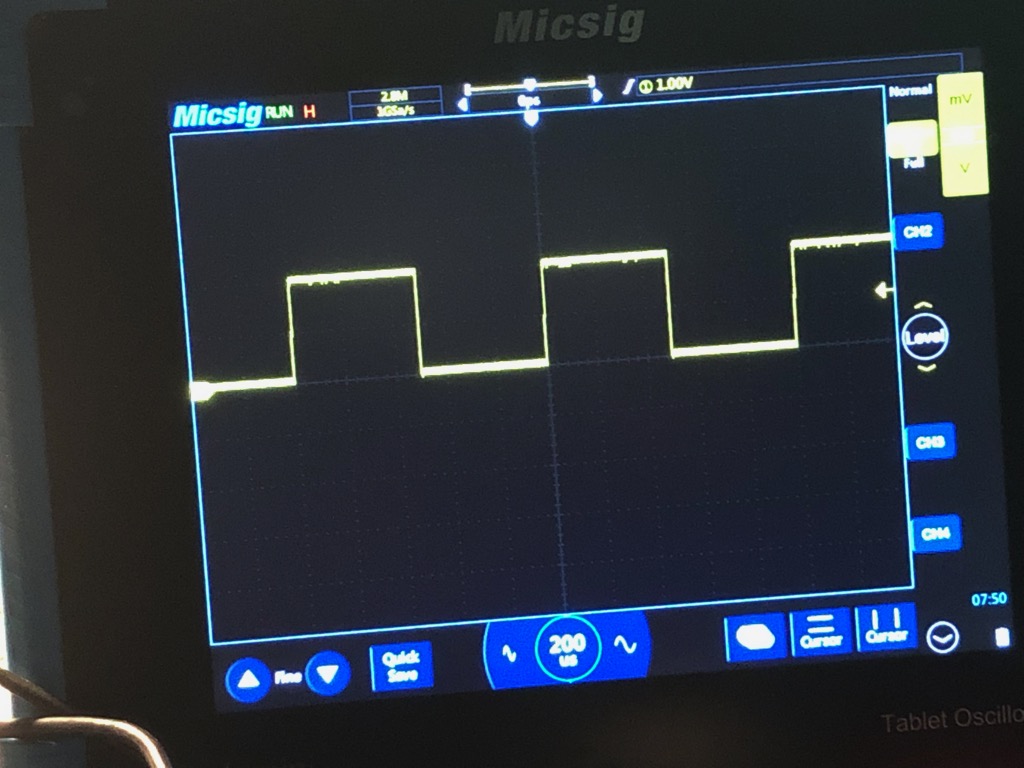
pwmExampleBasic Arduino sketch comes from AddOhms YouTube channel pin 13 on UNO corresponds to onboard LED. LED blinks at the beginning of every loop pin 3 is an analog PWM pin. Pin 3 gets 5v for 128/256 sec per loop Press Auto to scale and display signal automatically Set quantities to measure. Select frequency, duty cycle and maximum voltage amplitude
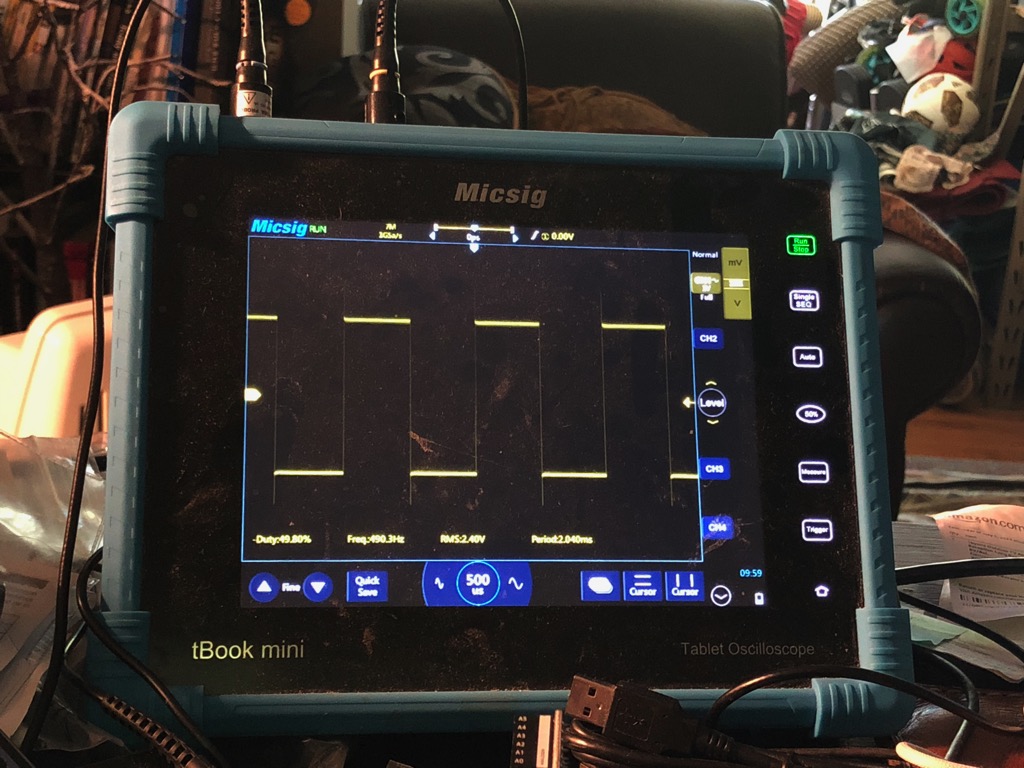 The signal is basically a square wave with artifacts.
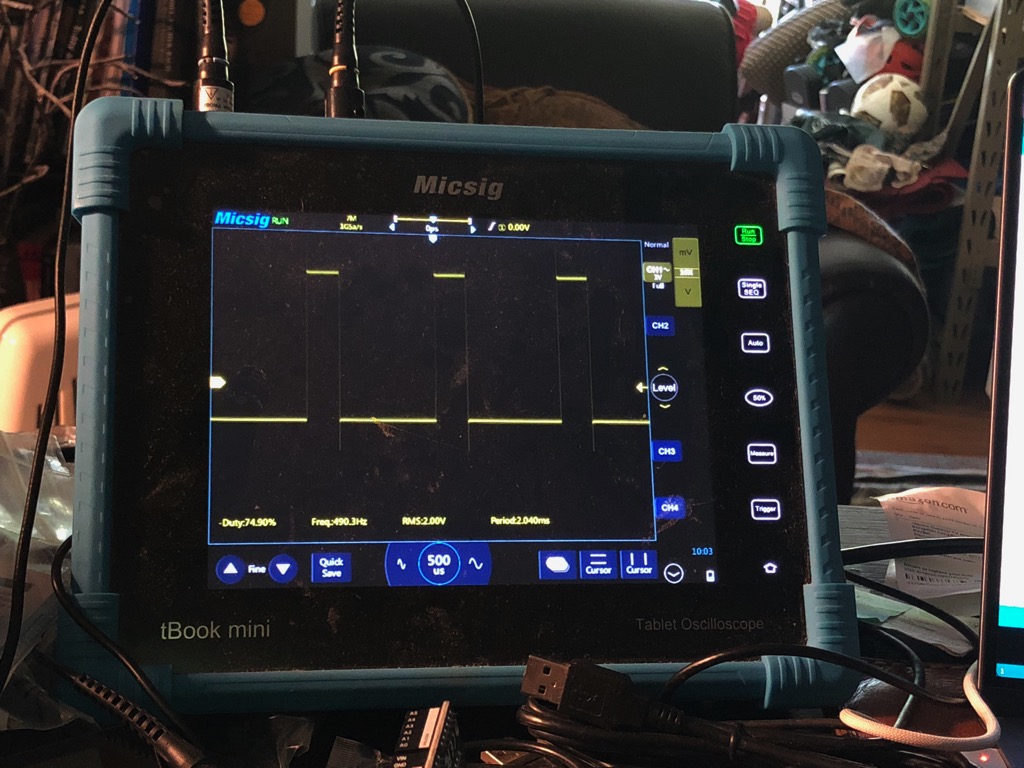 Reduce write value to 64 from 128 to halve the duty cycle (how long the LED is on) to 25%. In the image, the duty-cycle reads ~75% because I selected “negative duty cycle” by mistake. The light is off for 75%.
By changing the PWM trigger time to a veriable and creating a for loop that cycles the variable from 0 to 255 creates duty cycle curve that changes from always off to alwayes on.
Reset circuit event with normal triggering
Measure reset event on reset capacitor of Arduino. Use two channel probes. Connect channel one to the RTS side of the capacitor and channel two for the reset side. Set scope to trigger at 2.8V on falling edge of signal on channel one. Change trigger mode from “Auto” to “Normal.” Change the time-base of the scope to capture at least 3ms. 6ms is better.
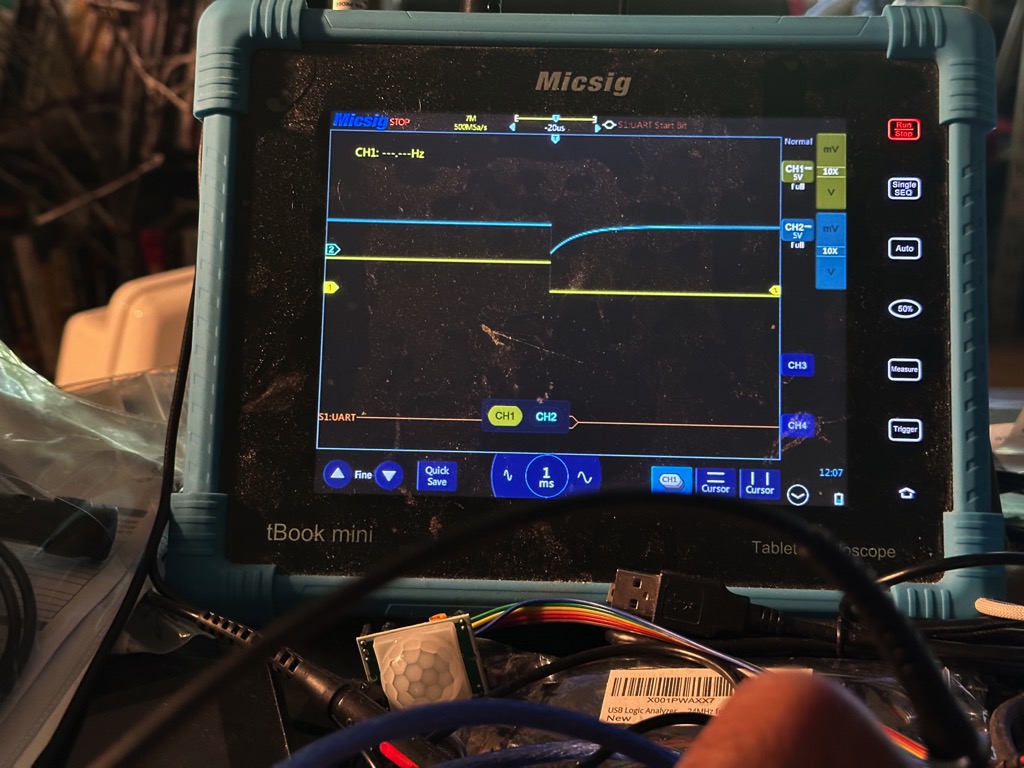
Display the RTS event trigger on channel one and the recharging of the reset capacitor on channel two.
Measure the reset time using cursors.
From Atmega 328 data sheet, for reset signal, any voltage below 0.5V is a low and any voltage above 4.5V is a high. So, time to reset after RTS is the time the capacitor takes to charge from 0.5V to 4.5V.
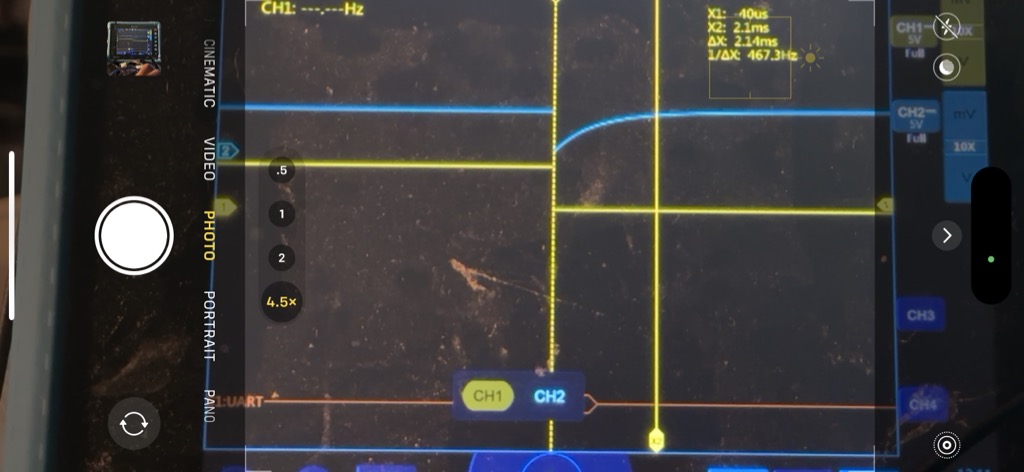
I measured the reset time as 2.14ms. I did not the horizontal cursors to set start and stop voltages as 0.5V and 4.5V respectively. I expect the actual reset time to be less than the 2.1ms that i measured.
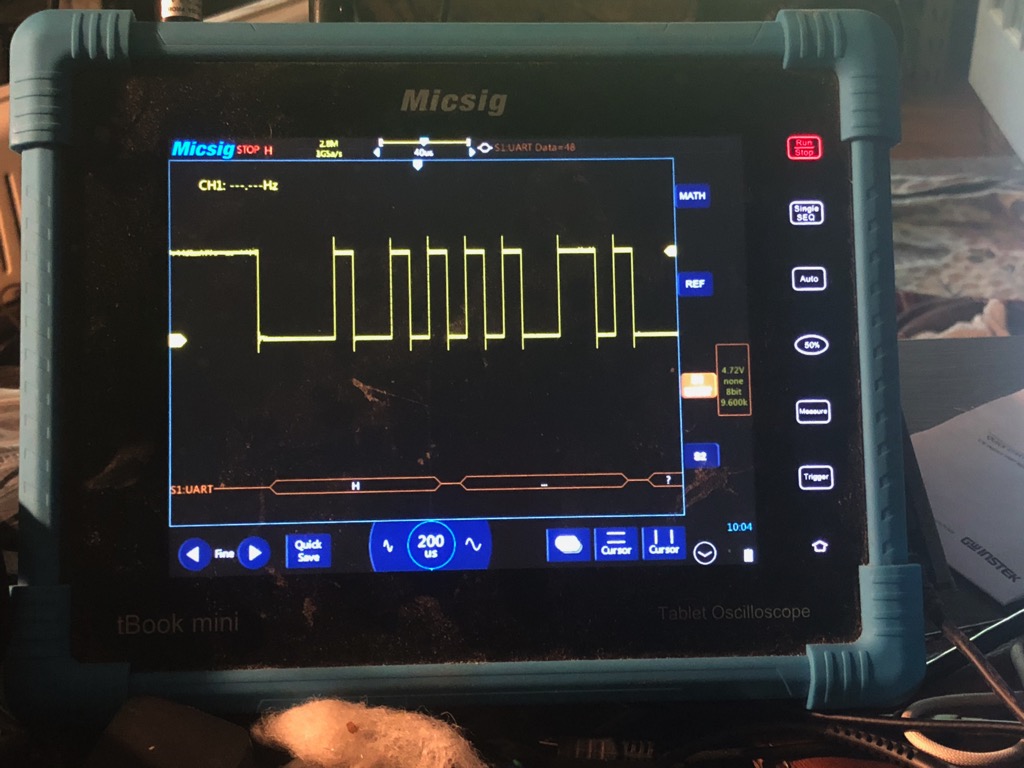
UART serial trigger & decode
For this measurement, the oscilloscope has to be able to trigger on serial traffic. Specifically, The device needs to read and decode UART traffic. Serial communication is digital. So, each “on” signal is similar to a dot or a dash in Morse code. The communication protocol determines how to separate characters and words in a transmission.
Connect the scope to transmit pin (pin 1 on UNO).
Change bus type on channel one to UART.
Set trigger to “receive.”
Set trigger to trigger on pattern, e.g., trigger on 48h which is hexidecimal value for ASCII “H” in hello.
Change display output setup to hex. protocol.
Upload serialHello.ino or similar code to Arduino.
*Be sure to include “Serial.begin(9600)” in setup()
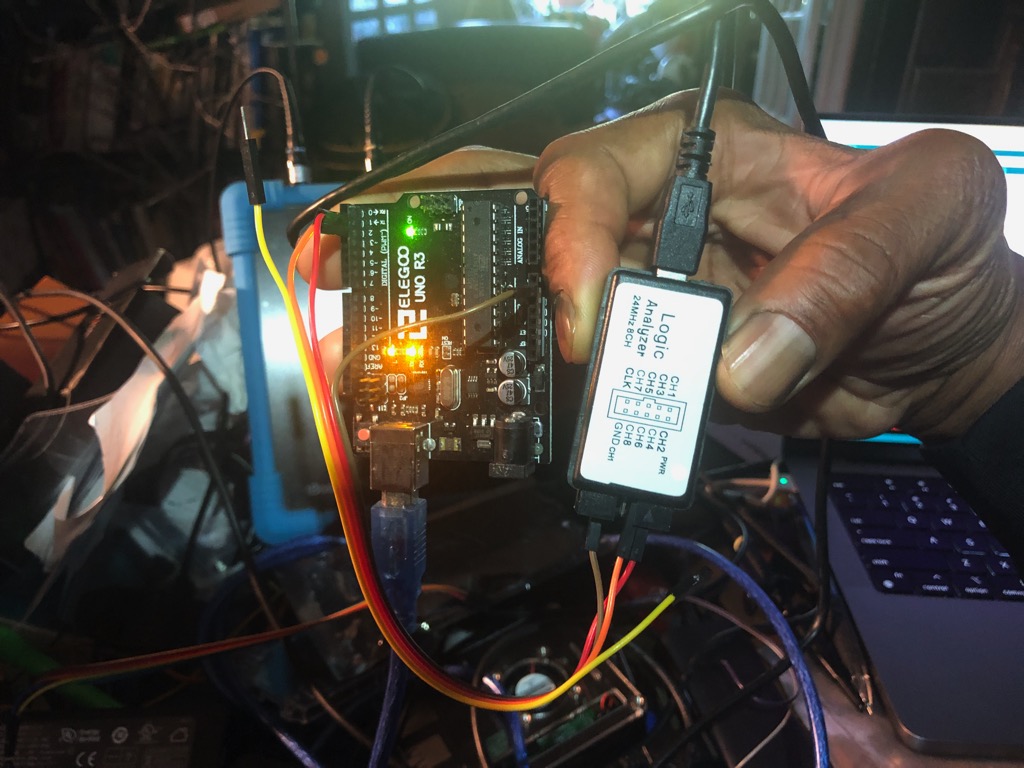
Logic Analyzer usage
Logic analyzer (LA) simplifies capture and translation of microcontroller serial communication Serial protocols. We can use LAs to troubleshoot circuits and systems with control issues that may result from transmission or reception of unexpected data.
UART serial communication
Again, I used the UNO and code from the oscilloscope UART example above serialHello.ino. Note that the digitalWrite command at the beginning of the loop sends a high pulse to pin 2 and a low pulse at the end. This is a simple way to visualize the beginning and end of the transmission. I did not do this but the high pulse could be used to trigger data record. The logic analyzer version of this example is inspired by Cheap Logic analyzer and pulseview I started with a Saleae 8-channel clone and Sigrok Pulseview opensource software. UART data transmits on one wire. I connected channels 1 and GND on the LA to pin 1 (TX) and pin 2 and GND on the UNO.
After downloading and installing “Pulseview,” I used USB (Universal Serial Bus)to connect the analyzer to the MacBook. The software recognized it as “Saleae Logic.”
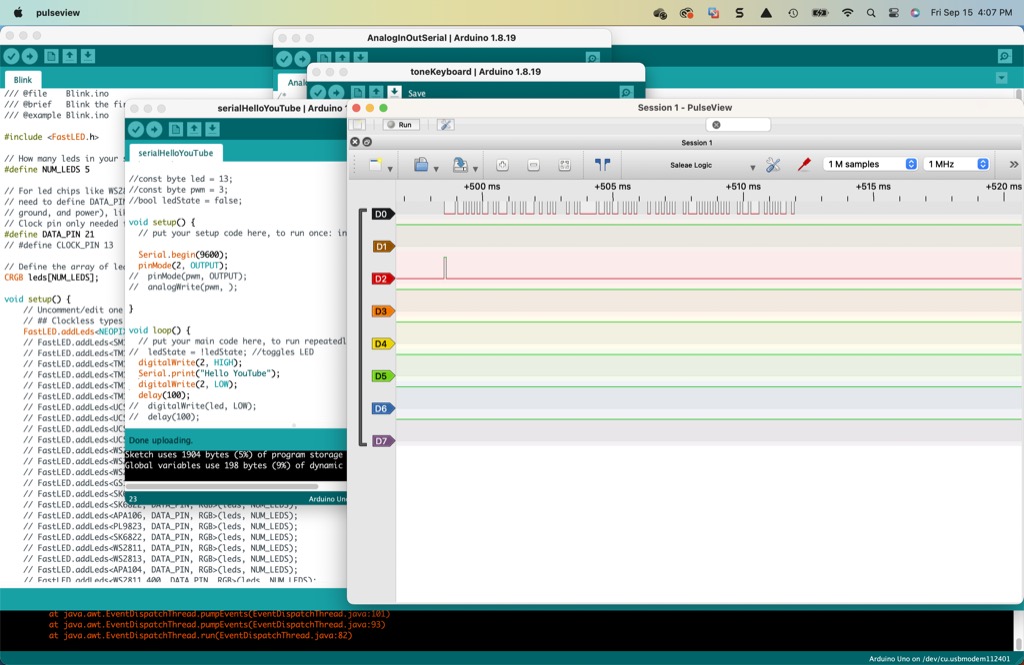
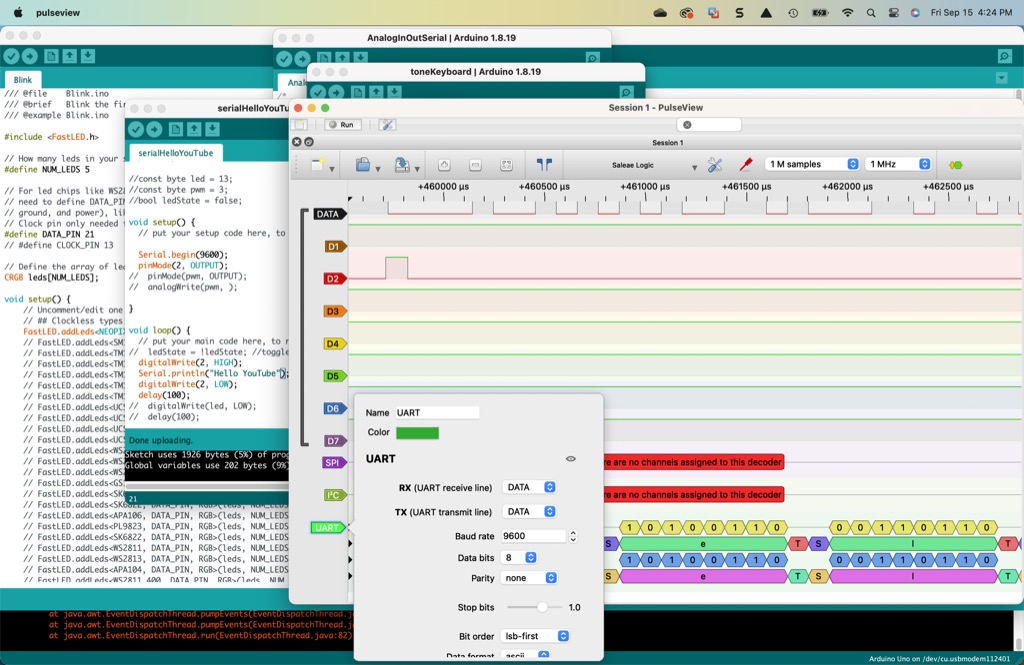
Running the Arduino sketch the first time after making the proper connects produced the result above. Note the 1 million samples setting. The analyzer detects the pulses in time but it does not translate them.
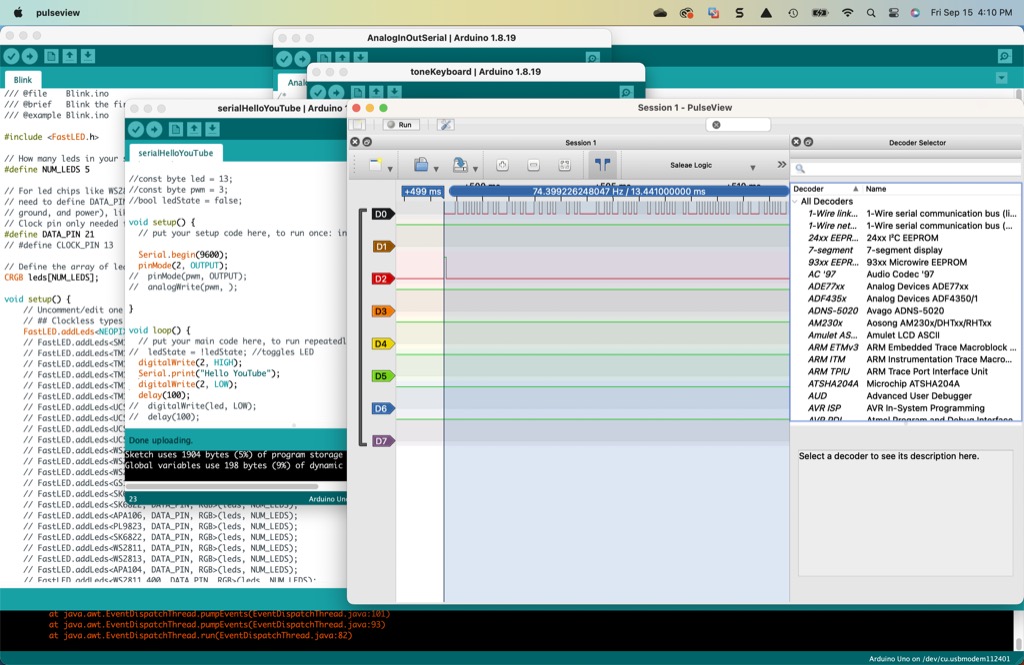
Next, I selected the UART “decoder” in order for Pulseview to interpret the pulses that the analyzer received.
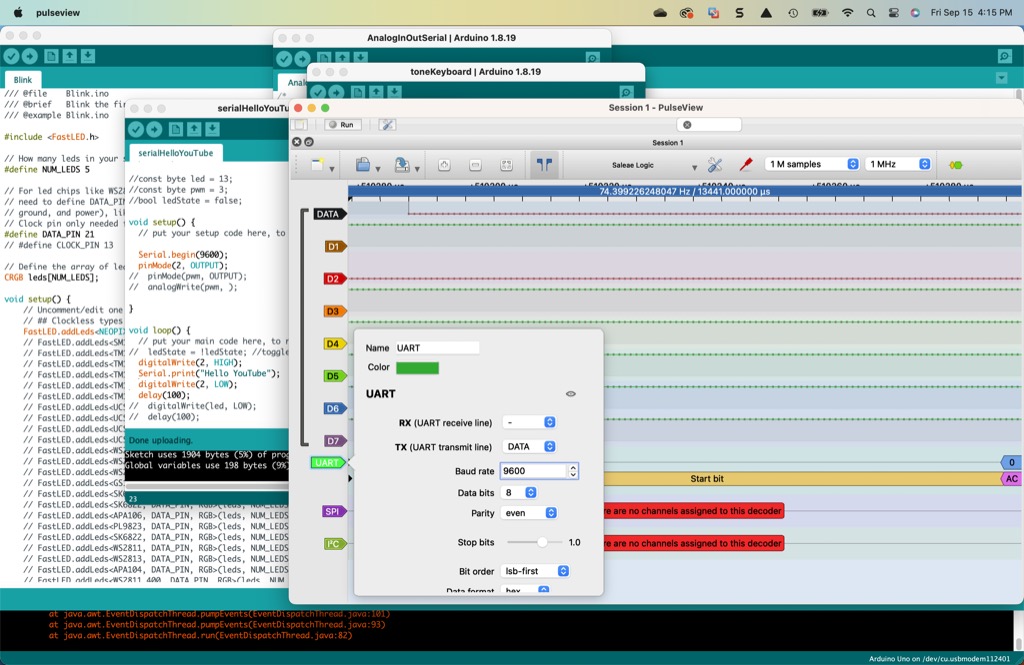
In the UART settings window, I selected data sources for TX and RX from the pulldown menus. I also set the baud rate to 9600 bps. I set bit order to “lsb-first” and Data format to “hex.”
I changed the data format to “ascii.” Running the code again did not produced the desired results. Pulseview only translated to H in Hello…
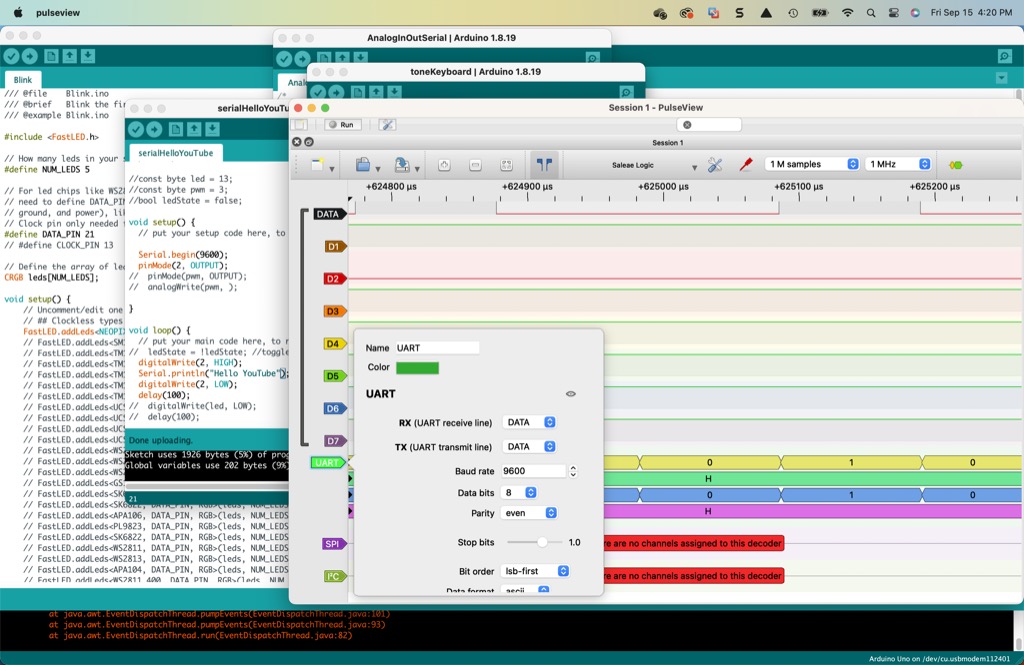
Next, I changed the parity from “even” to “none.” All of the characters from the transmission appeared in Pulseview.
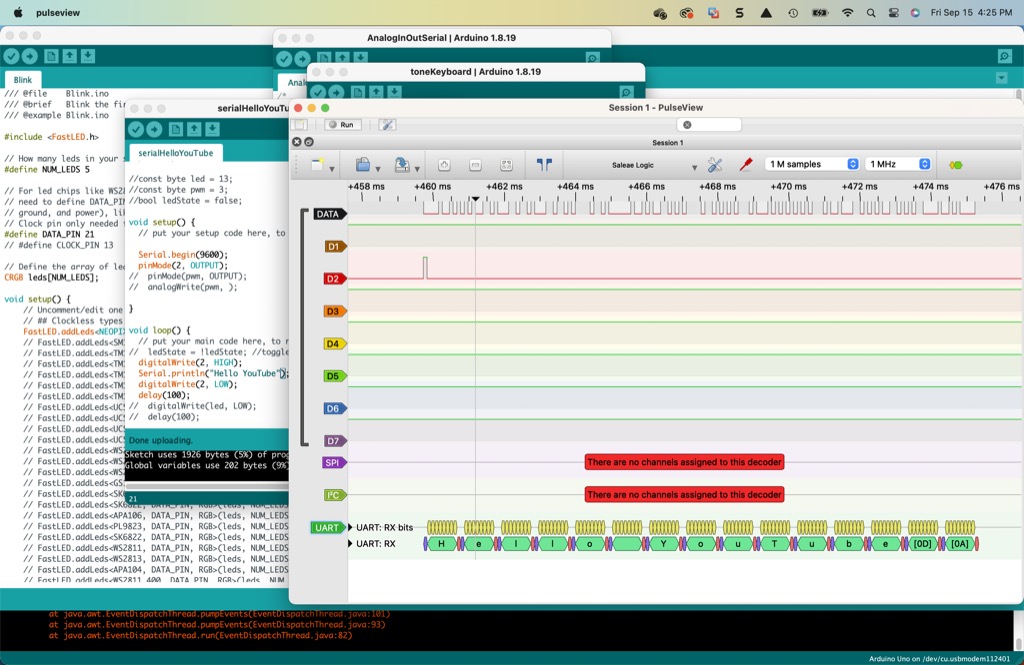
This image illustrates the deasired result.
SPI serial communication
I next used the logic analyzer to observe serial-peripheral-interface (SPI) traffic. Fab Academy requires students communicate with and control peripherals. Microcontrollers use protocols such as SPI do this. Running SPI through the analyzer should help me understand both a little better.
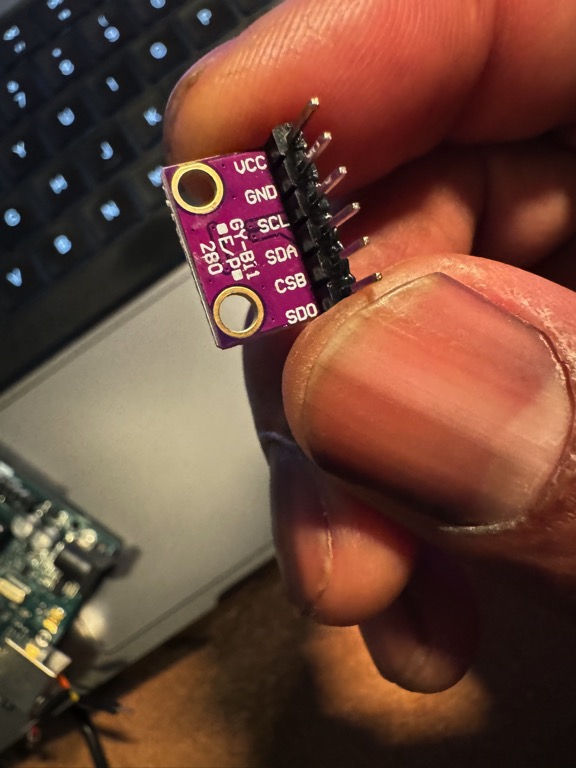
I using a BME280 sensor connected to the Arduino UNO. It supports SPI. I have the version with six pins: SCL, SDA, CSB and SDO plus 3.3v and GND pins.
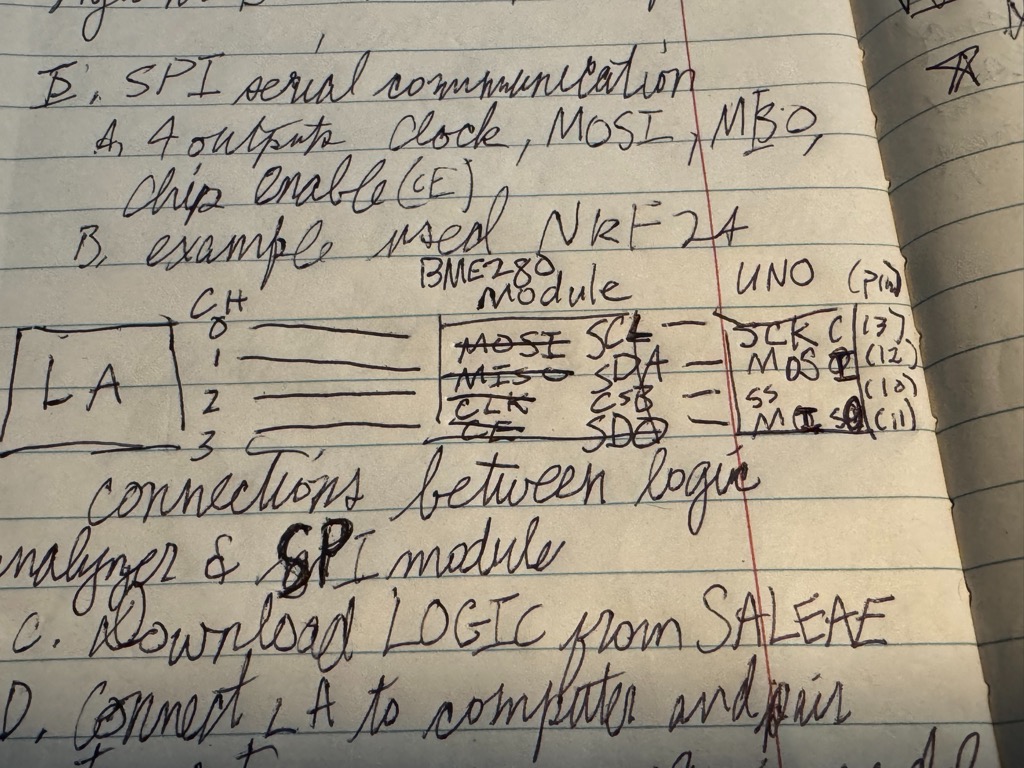
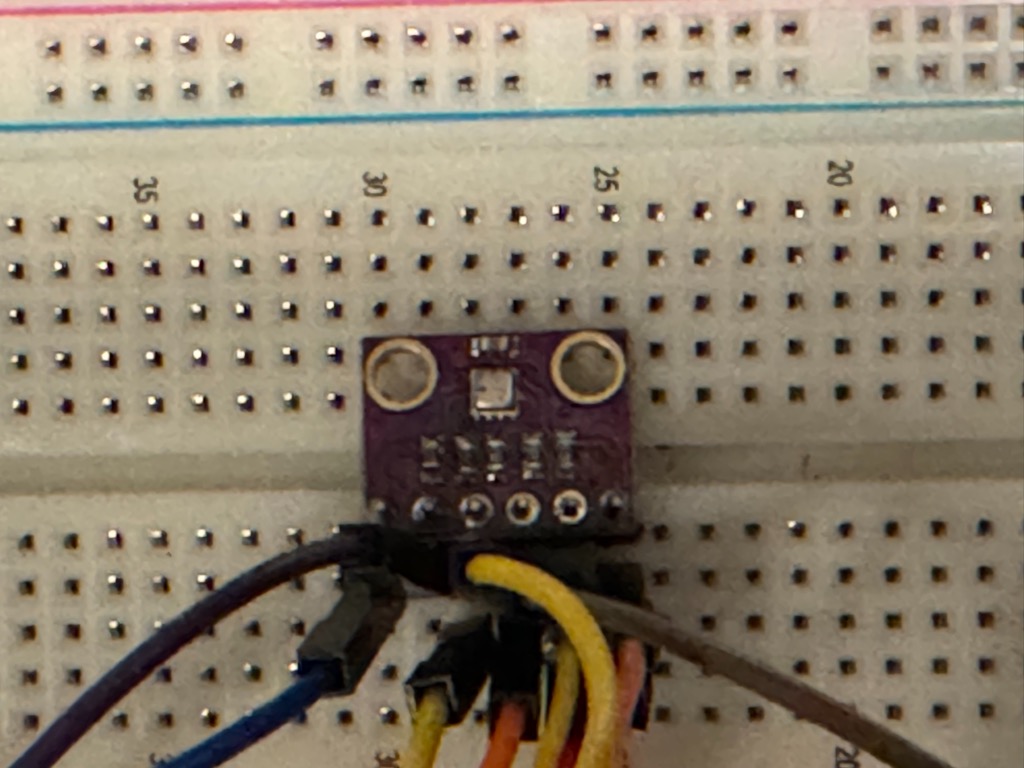
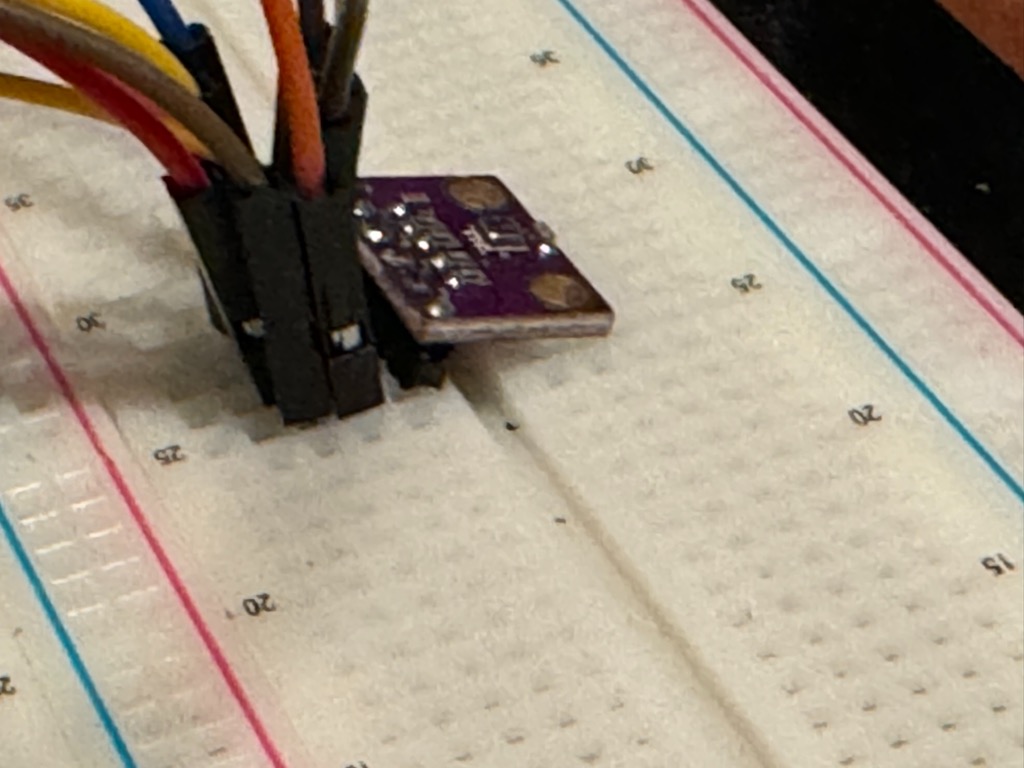
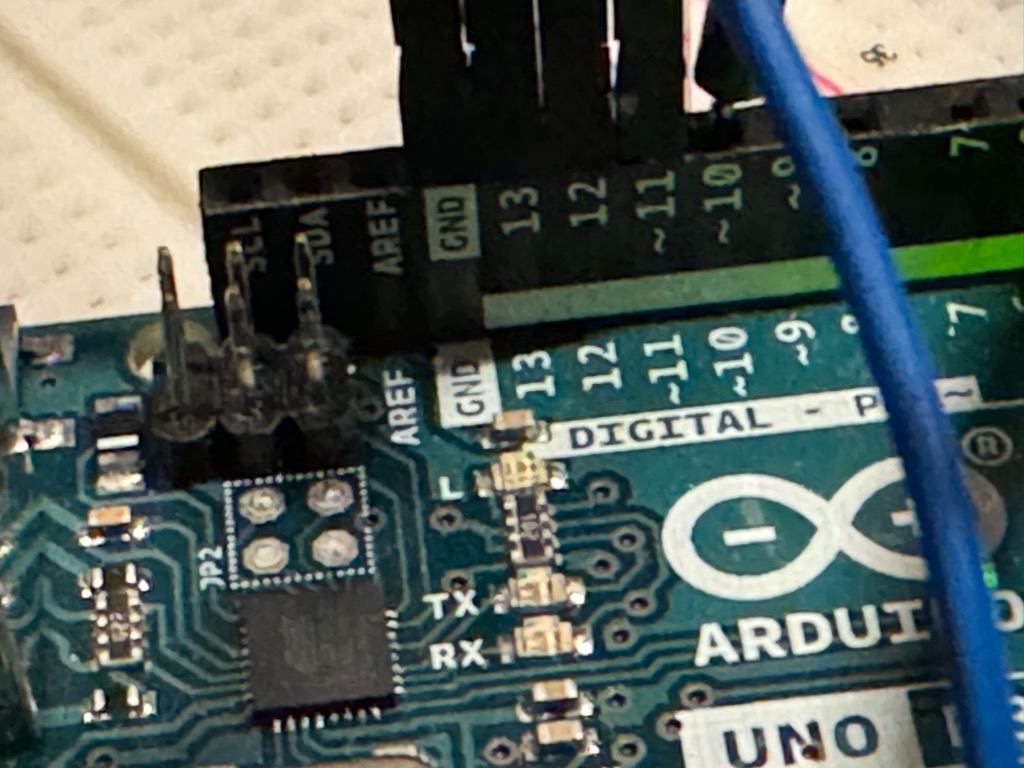
This is the wiring scheme that I used for the example. The other pictures sort-of show the physical wiring that I did. This bme code controlled the sensor
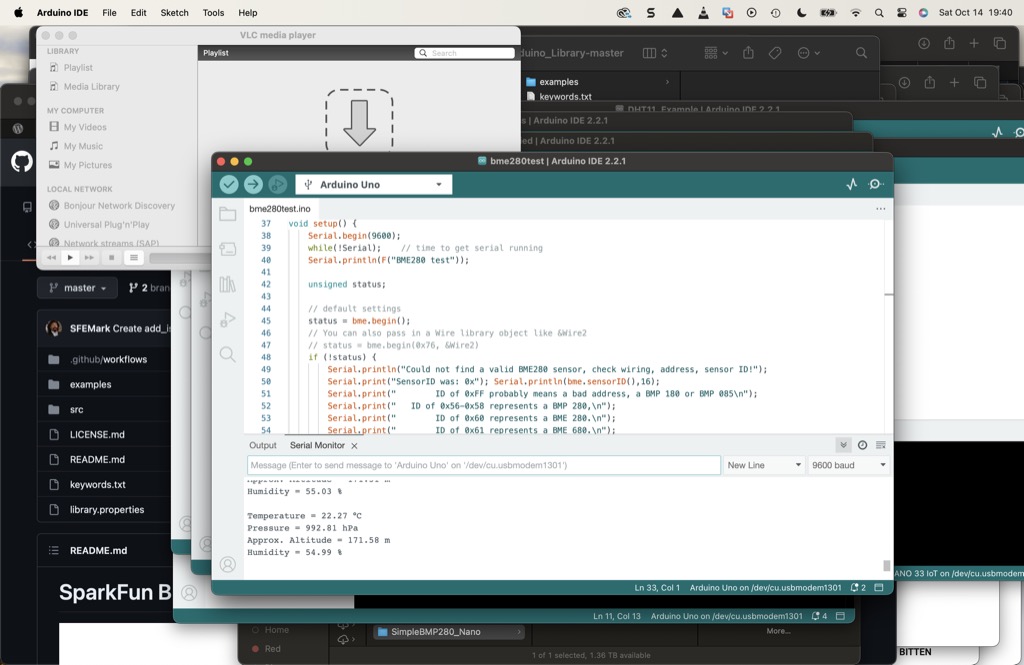
and produced these results.
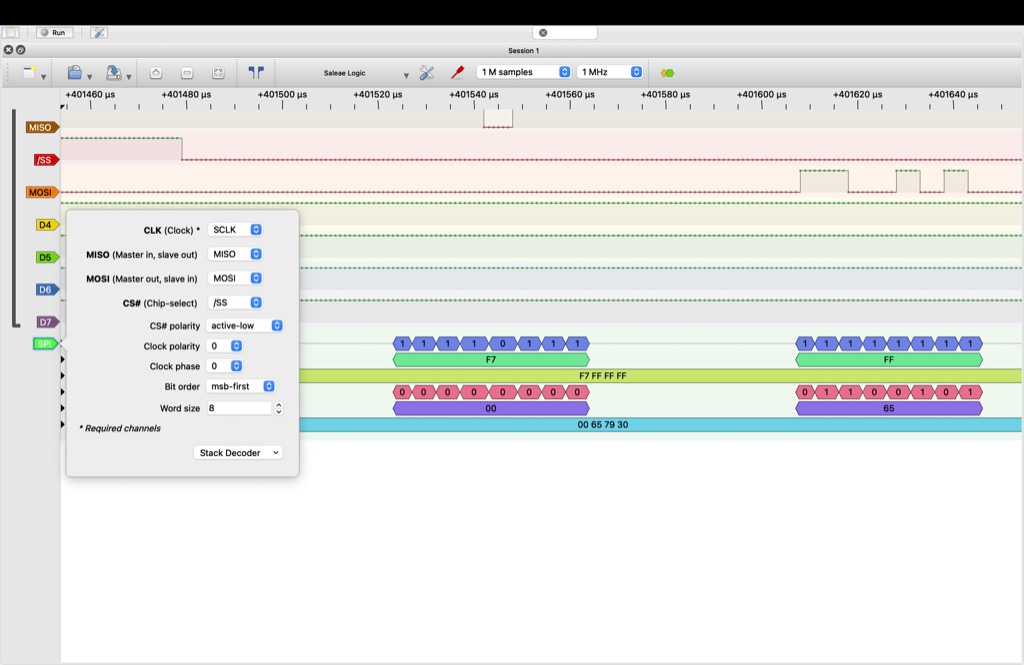
I added a new analyzer in Pulseview. I changed the channels in the model to correspond with the scheme above. Make sure that the baud rate and sampling rates are acceptable. Also, check trigger perimeters.
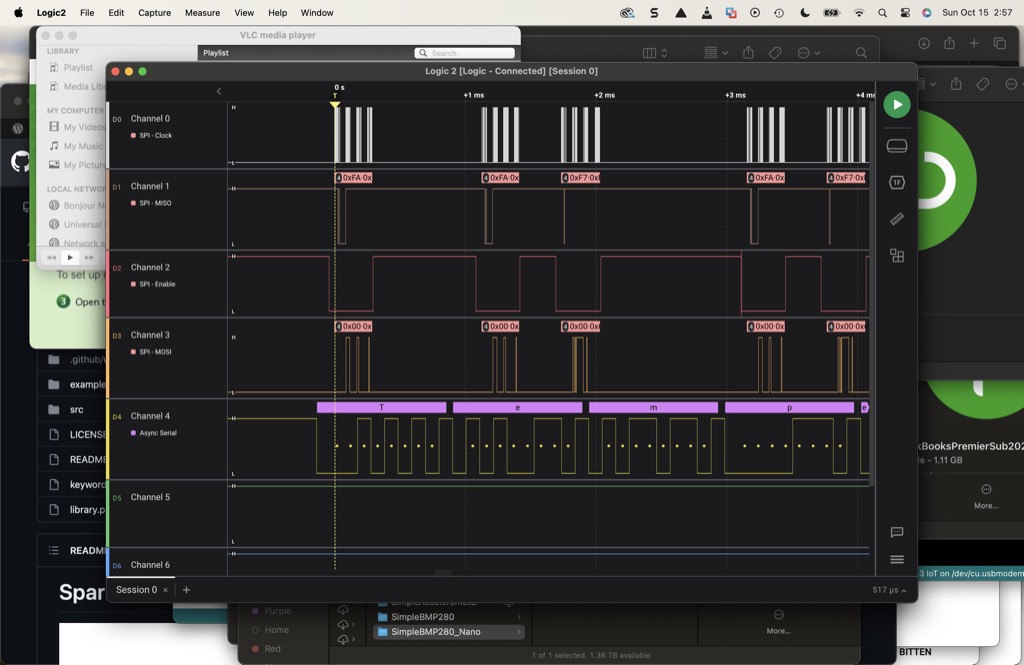
I ran the same code in Saleae Logic. I added an UART analyzer and connected channel five to pin 1 on the UNO.
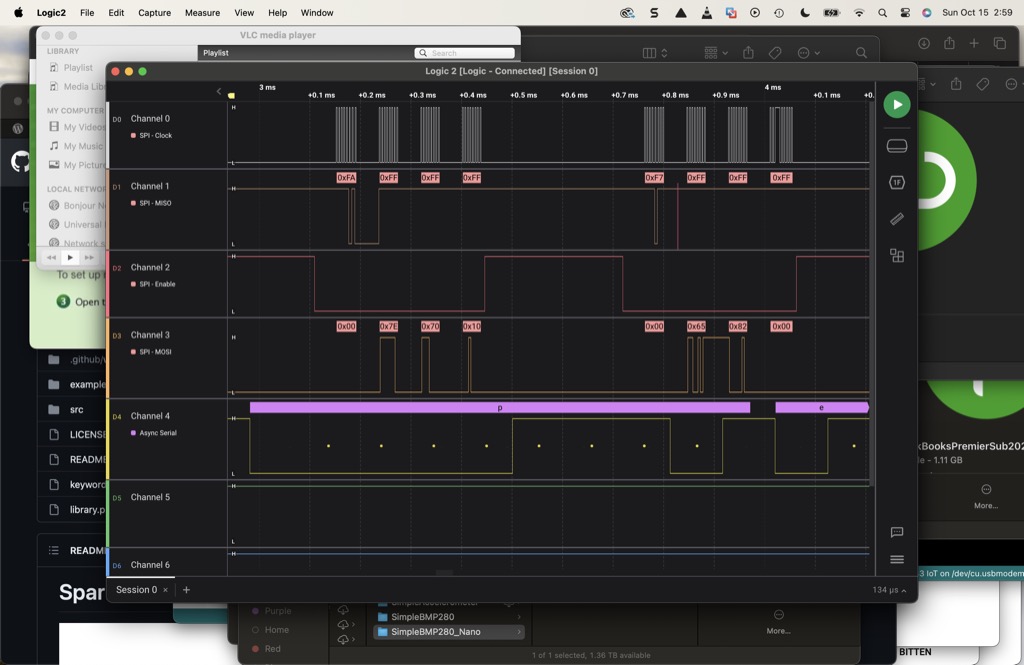
Notice the “call” and “response” pulses on channels 1 and 2 respectively. I believe that one sends the command to the sensor and two sends the response back to the UNO.
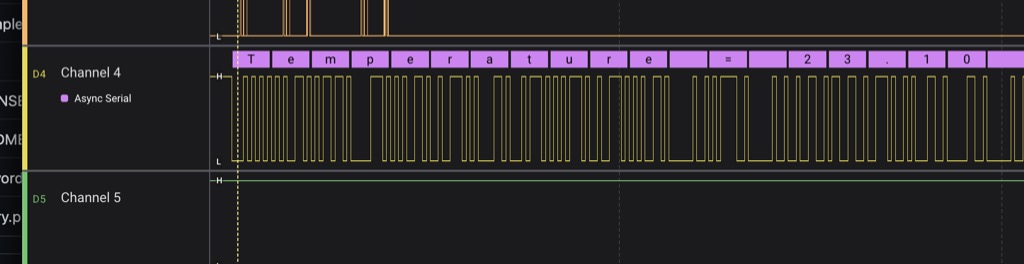
This image shows the serial print output in ASCII.
I2C serial communication
For the last protocol, I used Inter-Integrated-Circuit Bus (I2C).
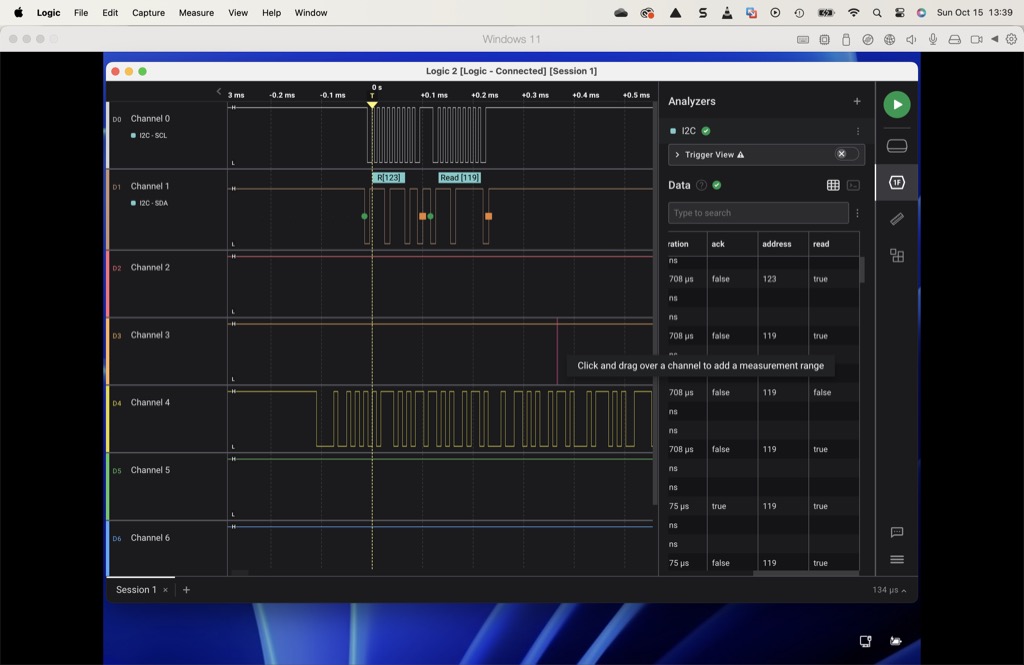
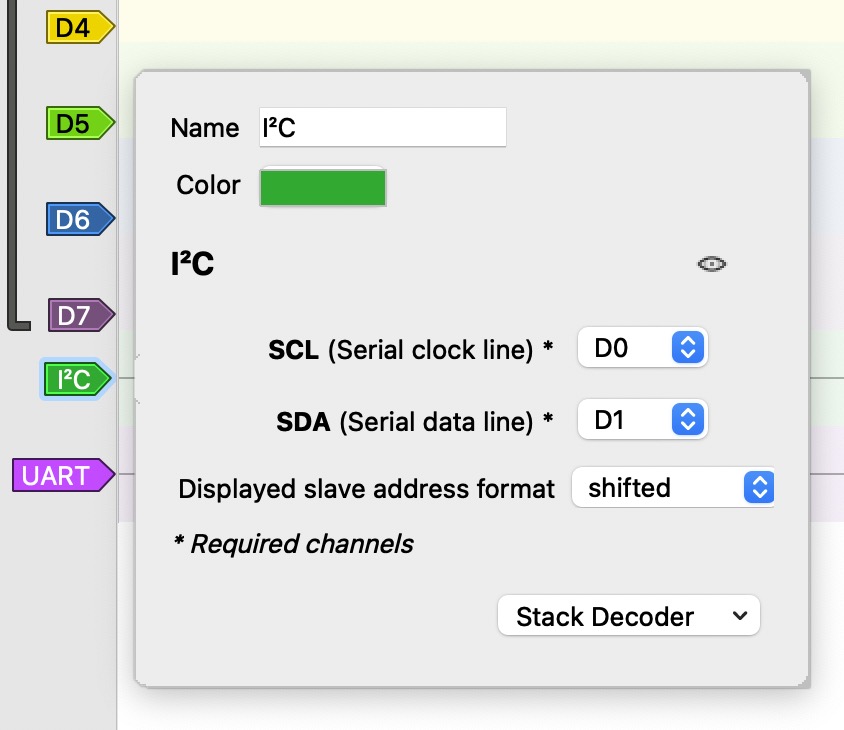
In Logic, I added the I2C analyzer to the session.
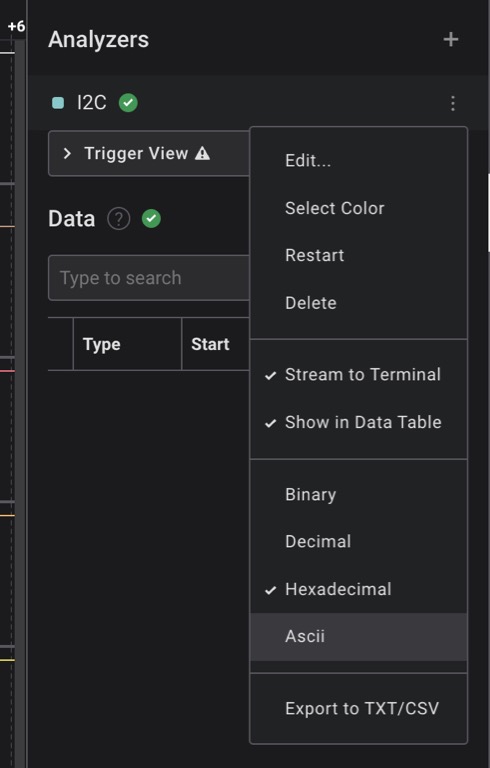
To edit the analyzer model, click the three dots to the right I2C.
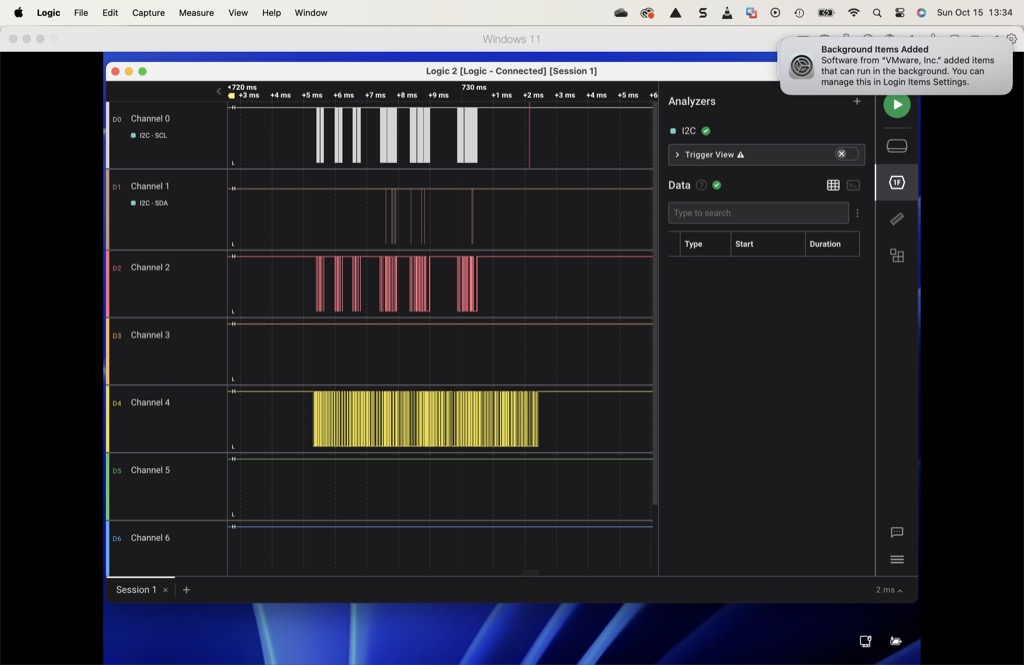
Here is the I2C output in Logic that the code produced. For me, it is a bit difficult to interpret.
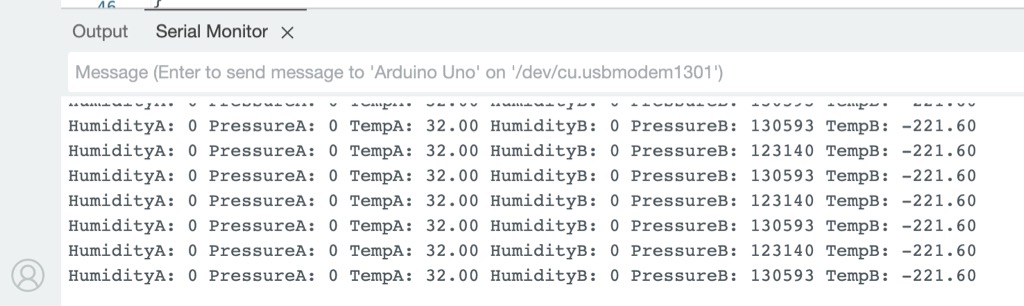
Here is the direct serial output in Arduino IDE.
The setup in Pulseview is similar to that of Logic. Access the settings by double-clicking on the analyzer label on the left edge of the window.
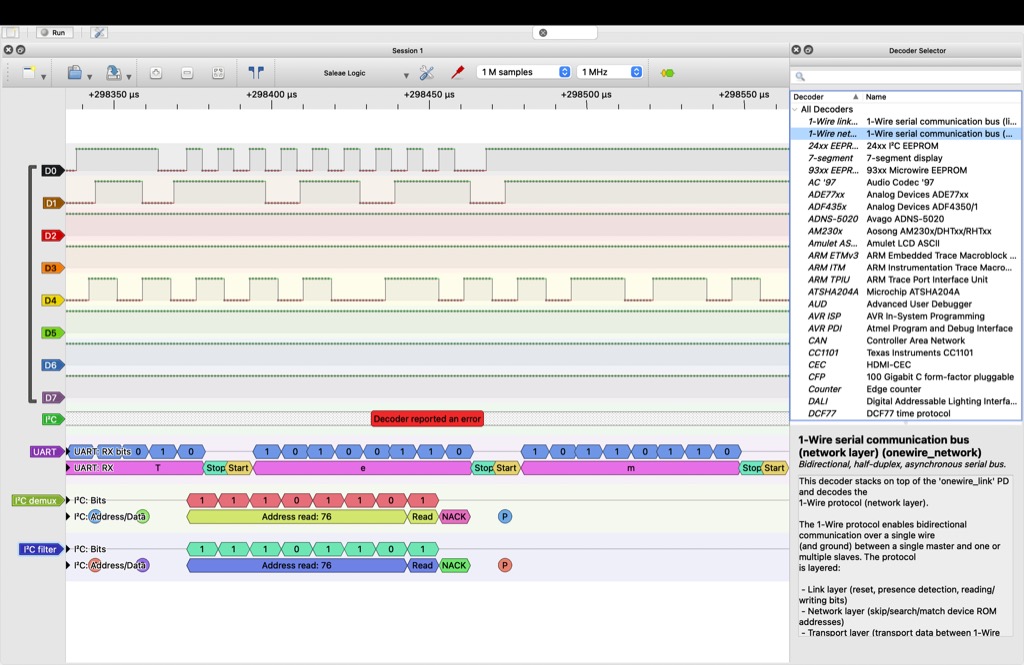
The Pulseview output is a bit more legible. The analyzer interprets the pulses and visualizes them for the user.
I can see the sensor ID in the output. I can not translate the rest of the data into usable information, however.