10. Input Devices
In this group assignment, we characterize the workings of the input pins on an ATtiny1614 microcontroller. We focus on the analog pin, and use it in two scenarios.
Analog input calibration
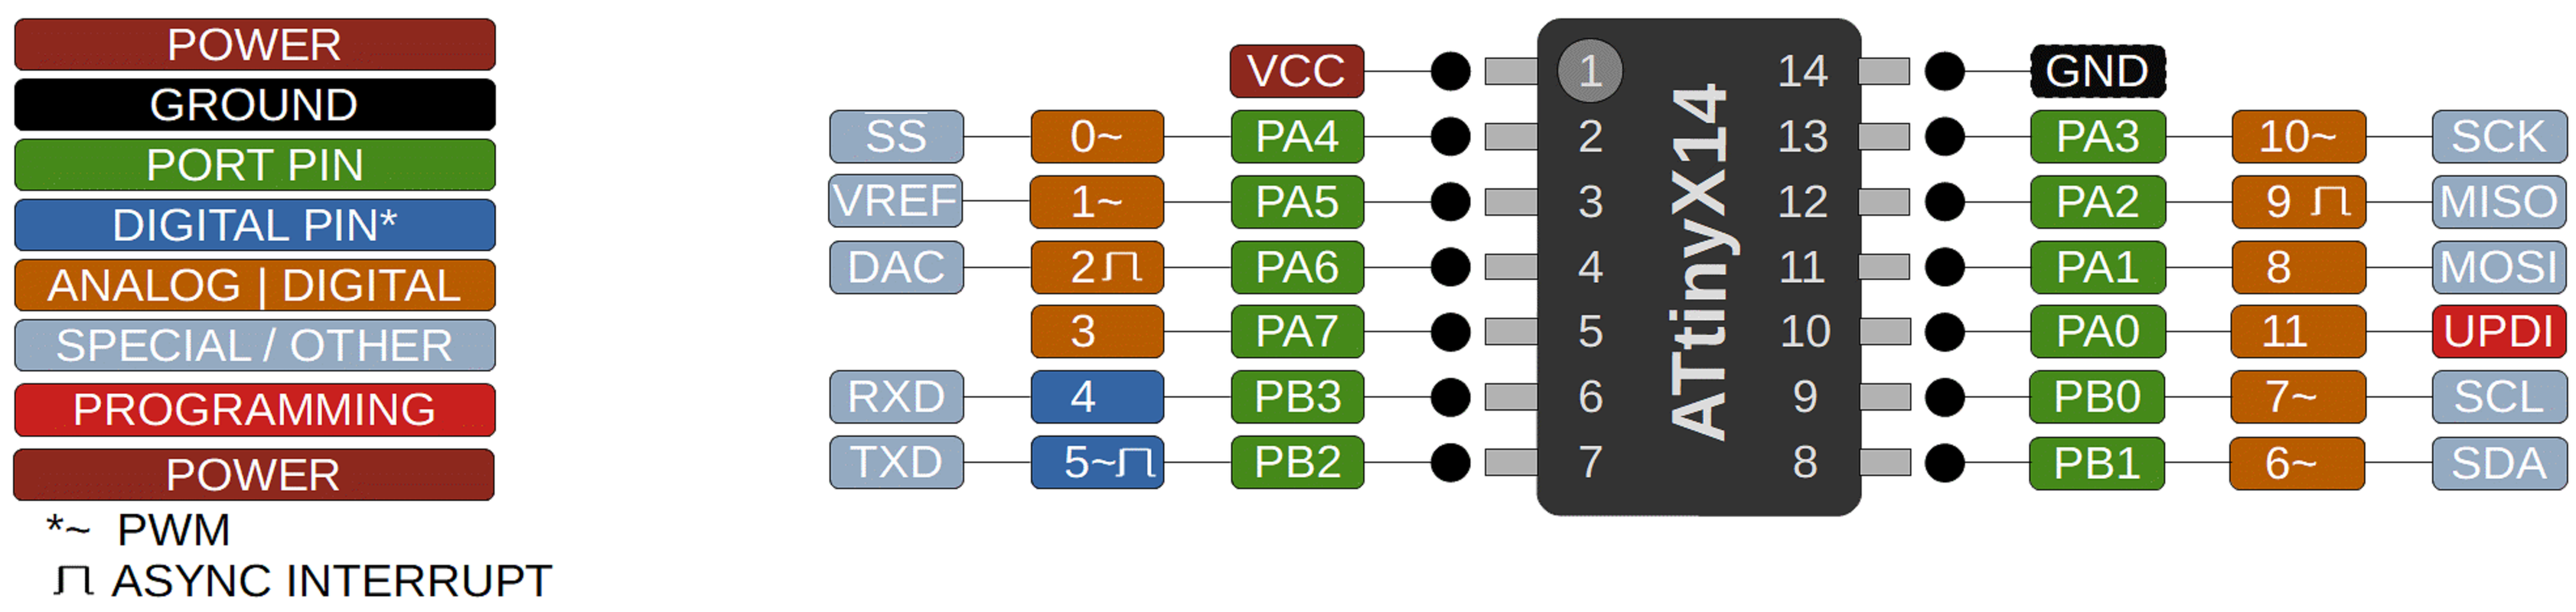
According to the datasheet, the ATtiny1614 is equipped with two 10-bit Analog to Digital Converters (ADC). They can however be multiplexed to plenty of pins, as the following diagram shows:
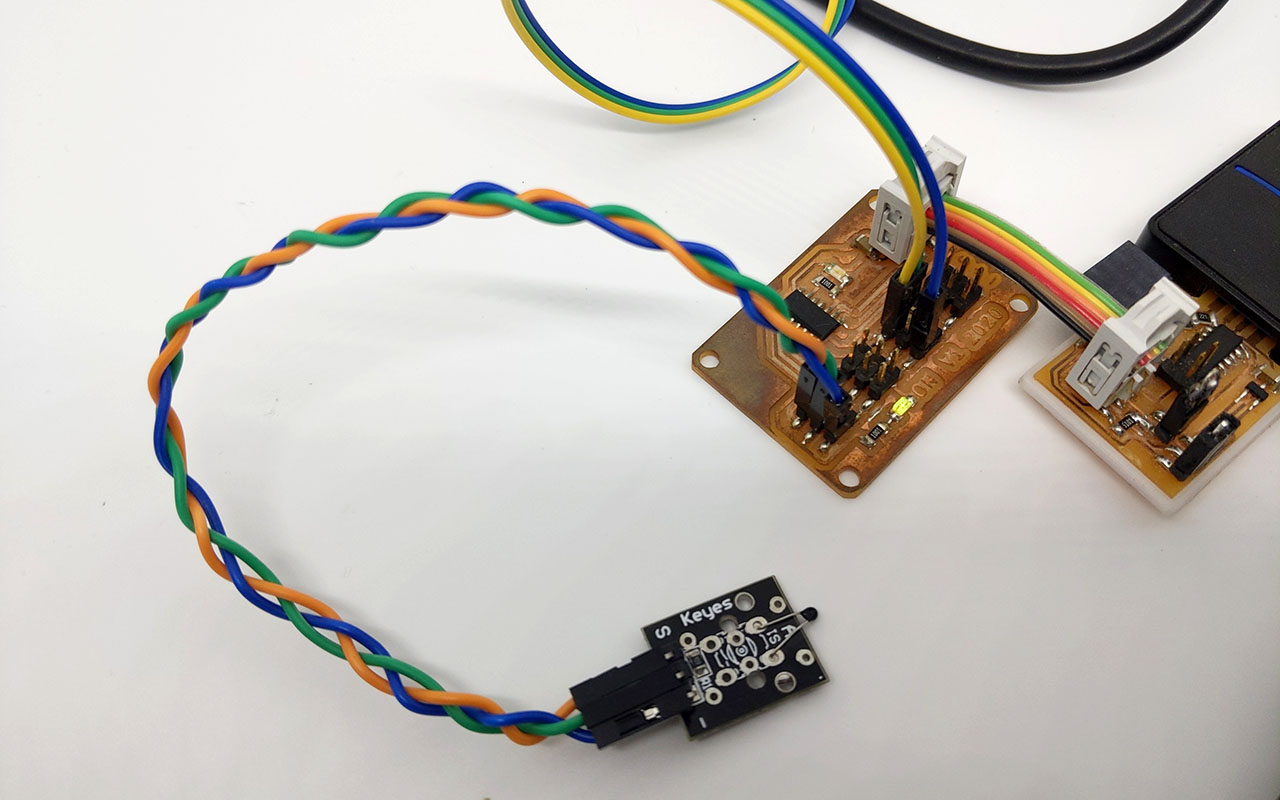
To check the proper working of the ADC, we made the following setup based on the ATtiny1614 board of Quentin:
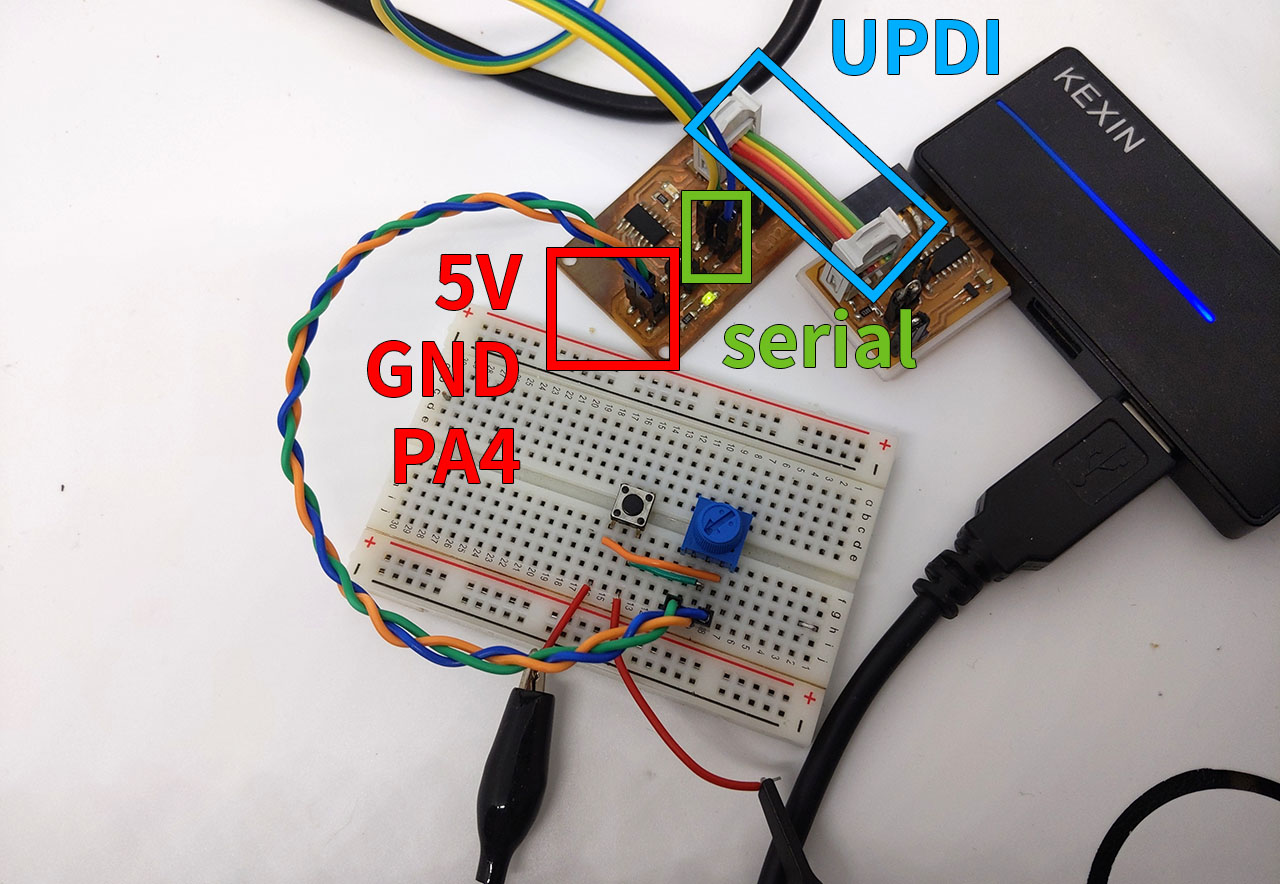
The pin PA4 is connected to a 10k potientometer, and a button is added in parallel, that can short this connection to the ground. We also connect an oscilloscope to have a confirmation of the actual voltage.
ATtiny1614 serial oscilloscope
For the purpose of this experiment, we turn the ATtiny1614 into a super-basic serial oscilloscope (limited to 0-5V and a sample every few milliseconds). Here is the Arduino sketch loaded onto the chip:
#define PIN_INPUT 0

bool recording = false;

void setup() {
  pinMode(PIN_INPUT, INPUT);
  Serial.begin(250000);
}

void loop() {
  if (recording) {
    int val = analogRead(PIN_INPUT);
    Serial.write(val & 0xFF);
    Serial.write((val >> 8) & 0xFF);
    Serial.write('\n');
    delay(10);
  }
  if (Serial.available()) {
    char c = Serial.read();
    switch(c) {
      case 'R':
        recording = true;
        break;
      case 'S':
        recording = false;
        break;
    }
  }
}
Note that we use 250 000 baudrate to avoid any delay when transmitting. The analog value is written as two bytes in little-endian format. We could convert the value to a decimal (or even hex) format, but we want to send the value as fast as possible. The chip will stream measurement values on the serial cable, accepting only two commands from the host PC, record R and stop S.
The following Python code connects to the serial port, launches recording for a given duration, then saves the values to a text file. Note that the timing is estimated by the PC, as we don’t want to rely on the imperfect internal clock of the ATtiny1614.
import datetime
import serial
import argparse


def parse_arguments():
    usage_text = (
        "Usage:  python sync_date.py [options]"
    )
    parser = argparse.ArgumentParser(description=usage_text)
    parser.add_argument("-o", "--output", type=str, default="out.txt", help="Output filename.")
    parser.add_argument("-c", "--com", type=str, help="Serial port to open.")
    parser.add_argument("-b", "--baudrate", type=int, default=250000, help="Baudrate to use.")
    parser.add_argument("-t", "--time", type=float, default=5.0, help="Duration to record  [s].")
    return parser.parse_known_args()


def record(ser, filename, duration, verbose=True):
    t_start = datetime.datetime.now()
    dt = 0

    if verbose:
        print("start recording for {} seconds...".format(duration))

    measurements = []
    ser.write(b"R")
    while dt < duration:
        line = ser.readline()
        t_now = datetime.datetime.now()
        dt = (t_now-t_start).total_seconds()
        val = int.from_bytes(line[:-1], "little")
        measurements.append((dt, val))
    ser.write(b"S")

    if verbose:
        print("writing to {}".format(filename))

    with open(filename, "w") as f:
        for dt, val in measurements:
            f.write("{:.3f} {:d}\n".format(dt, val))

    if verbose:
        print("done.")


def main():
    args, _ = parse_arguments()

    p = serial.Serial(args.com, baudrate=args.baudrate, timeout=0.2)
    p.write(b"S")
    record(p, args.output, args.time)
    p.close()


if __name__ == "__main__":
    main()
The experiment
For the experiment, we will compare the performance of our cheap ATtiny1614 oscilloscope VS our Picoscope3205 USB oscilloscope. The experiment is the following:
- Connect the Picoscope and the ATtiny1614 to the PC. A USB to serial cable is needed, we use a FTDI.
- Launch acquisition with both our Python script and the Picoscope software.
- Press the button to give a noticeable synchronization signal at the beginning.
- Turn the potientometer from minimum to maximum voltage, in a regular motion.
- Save values in two text files, and perform signal processing to get the results.
The Picoscope is set to a very low speed to have around the same temporal resolution as the ATtiny1614. We use 10 bits resolution.
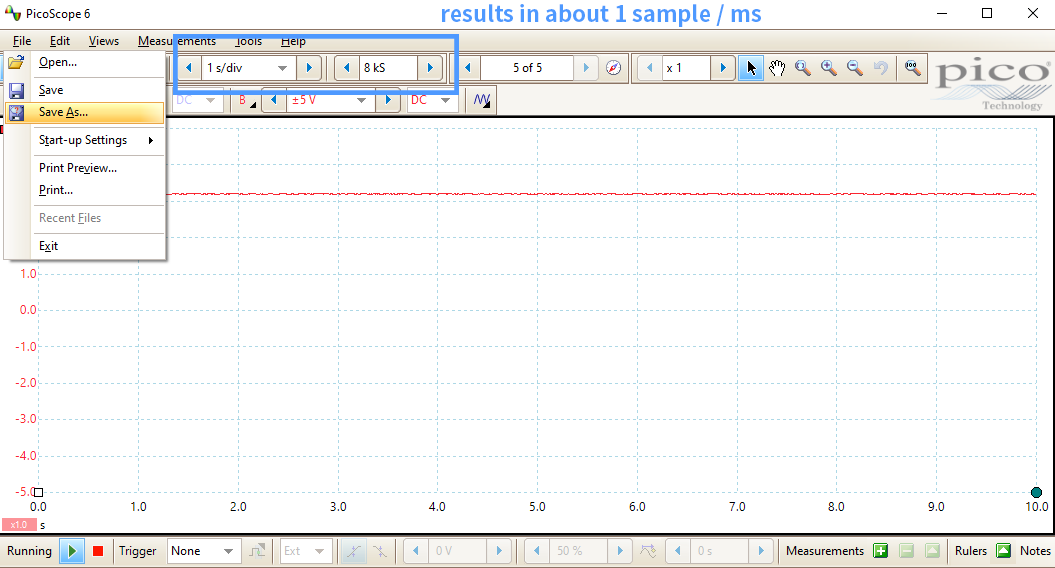
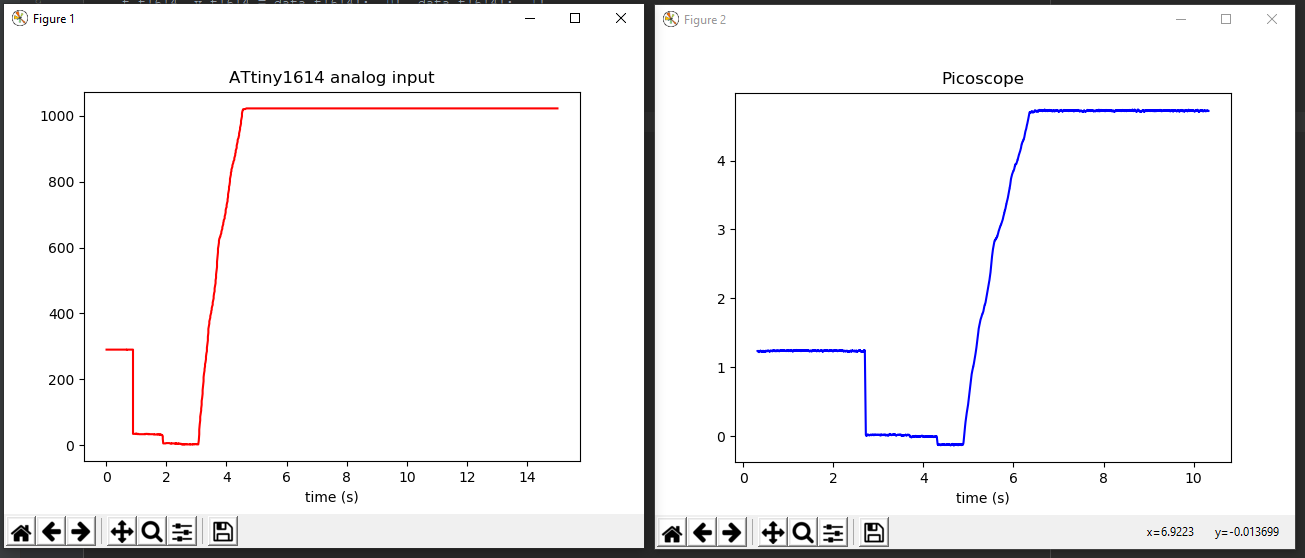
We recorded the following traces, text files are included at the end of this page. Note how the Picoscope trace was started around 2 seconds earlier, hence we need synchronization.
The data is loaded in Python as Numpy arrays. We wrote the following helper functions to cleanup each trace, consisting of a time axis t and corresponding values v:
def crop_at_start(t, v, alpha=0.5):
    # find the first falling edge and crop from there
    v_start = np.mean(v[:10])
    i = np.argmax(v < v_start*alpha)
    return t[i:]-t[i], v[i:]


def crop_time(t, v, t_start, t_end):
    # crop a given time segment
    mask = np.where((t >= t_start) & (t <= t_end))
    return t[mask], v[mask]


def sample_curve(t, v, n_samp=100):
    # sample the curve at n_samp points
    t_min, t_max = t[0], t[-1]
    t_samp = np.linspace(t_min, t_max, n_samp)
    v_interp = np.interp(t_samp, t, v)
    return v_interp
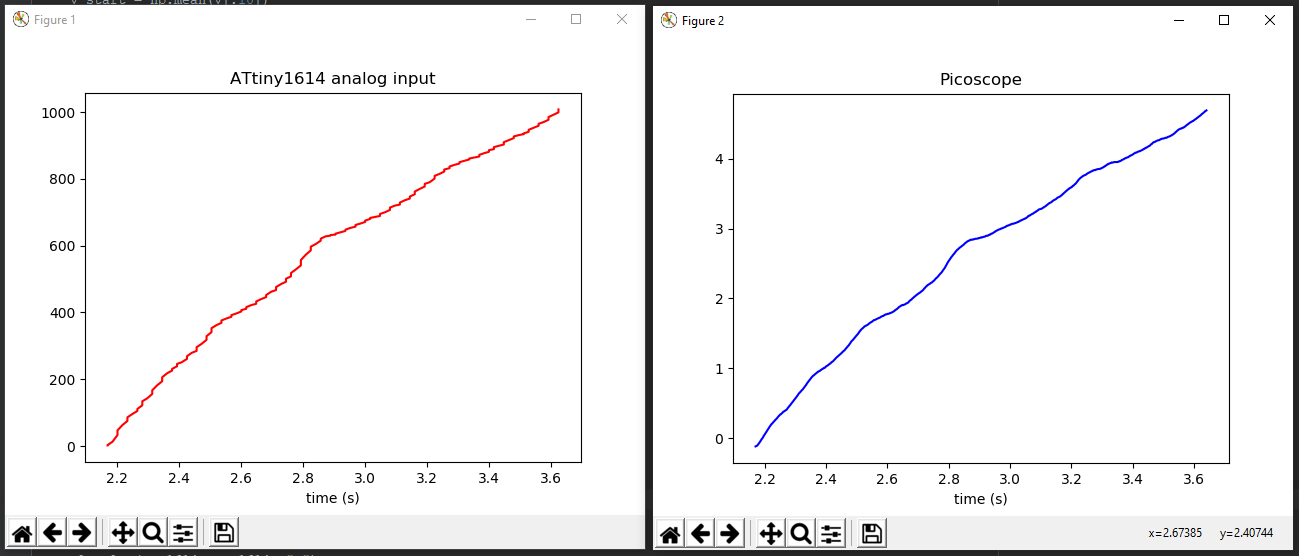
Using these functions carefully, we synchronize the traces and extract only the time region containing the increasing voltage.
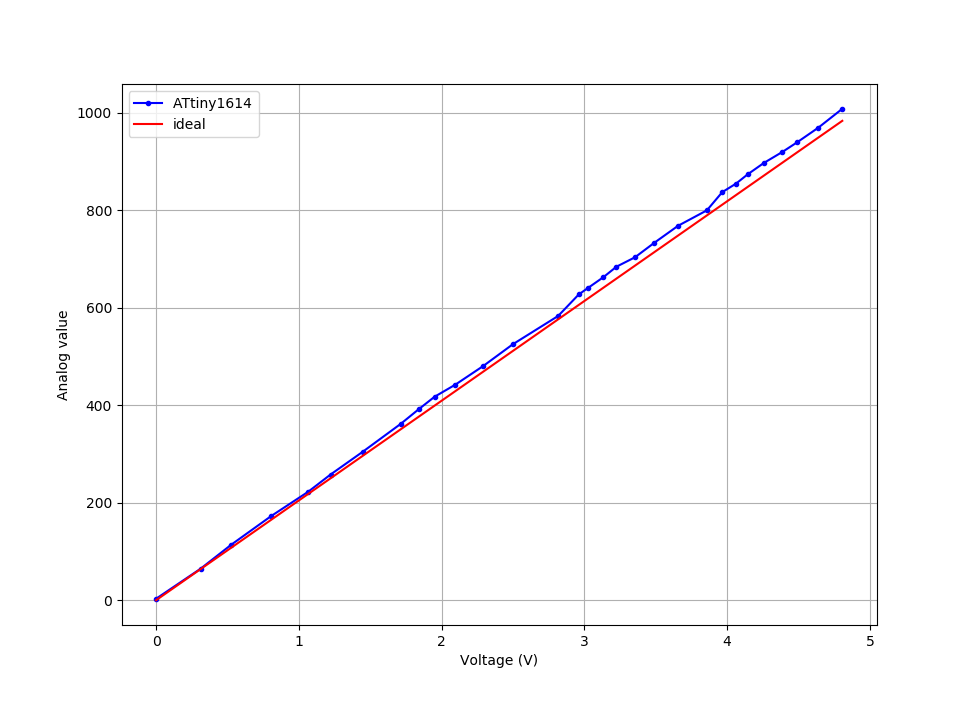
Finally, performing a XY plot of these two curves gives us an empirical conversion curve, from voltage to ADC value. We also plot an “ideal” curve, assuming the ADC yields 0 for 0V, and 1023 for 5V. The relative mean error is 3 %, confirming that the ATtiny1614 provides a reasonable accuracy for a wide range of applications.
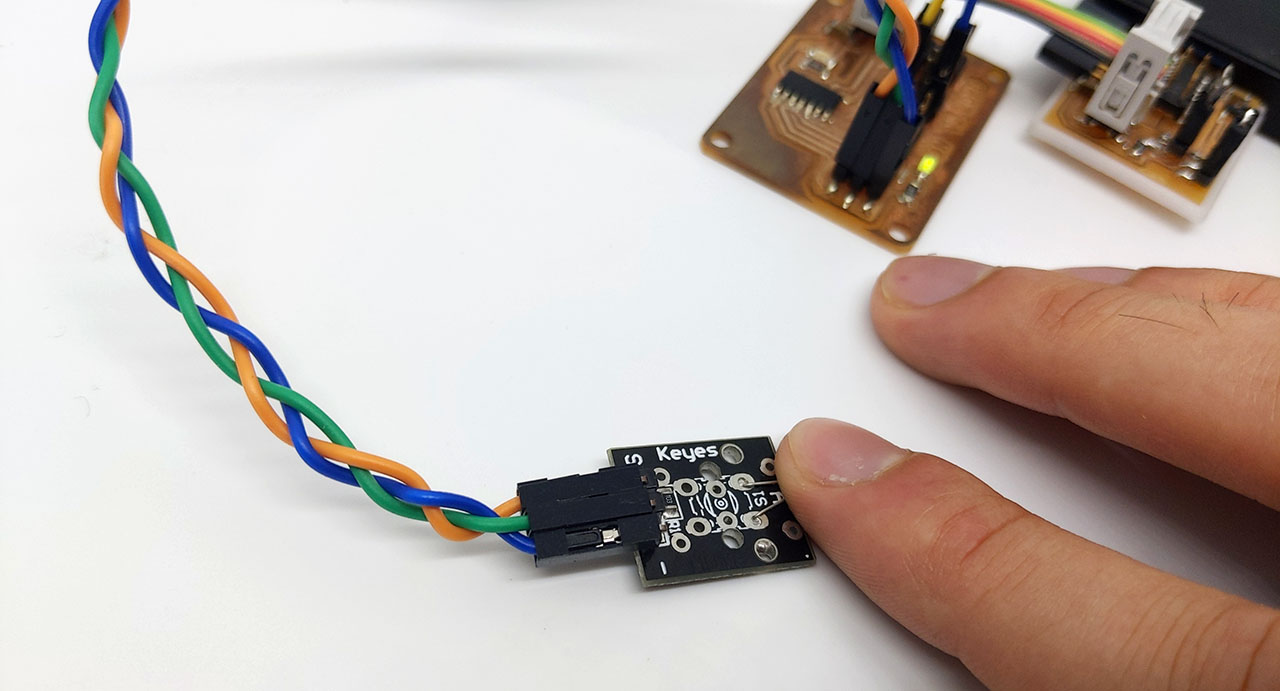
Thermistor
To check that the calibrated pin can be used in a practical scenario, we use a Negative Temperature Coefficient (NTC) thermistor to probe temperature values.
The NTC is placed under 5V in series with a 10kOhm resistor, and the analog pin 0 is measuring the voltage drop across the NTC. From Kirchhoff’s laws, we deduce:
Where V_{\rm CC}=5{\rm V} and R1=10{\rm kOhm}. We can isolate the unknown, R_{\rm NTC}:
The temperature can then be computed using steinhart-hart coefficients for this specific NTC type; we use the coefficients described here. We showed in the previous section that a good estimation of V_{\rm NTC} is given by Vcc*analogRead(0)/1023.0. Here is the Arduino sketch reading the temperature and sending through the serial port every 200 milliseconds:
#define PIN_INPUT 0

// value of R1 on board
float R1 = 10000;

//steinhart-hart coeficients for thermistor
float c1 = 0.001129148, c2 = 0.000234125, c3 = 0.0000000876741; //steinhart-hart coeficients for thermistor


void setup() {
  pinMode(PIN_INPUT, INPUT);
  Serial.begin(250000);
}

float get_temperature() {
  // from https://arduinomodules.info/ky-013-analog-temperature-sensor-module/
  float logR2, R2, T;

  int val = analogRead(PIN_INPUT);

  //calculate resistance on thermistor
  R2 = R1 * ((float)val / (1023.0 - (float)val));
  logR2 = log(R2);

  // temperature in Kelvin
  T = (1.0 / (c1 + c2*logR2 + c3*logR2*logR2*logR2));

  //convert Kelvin to Celcius
  T = T - 273.15;
  return T;
}

void loop() {
  float T = get_temperature();
  Serial.println(T);
  delay(200);
}
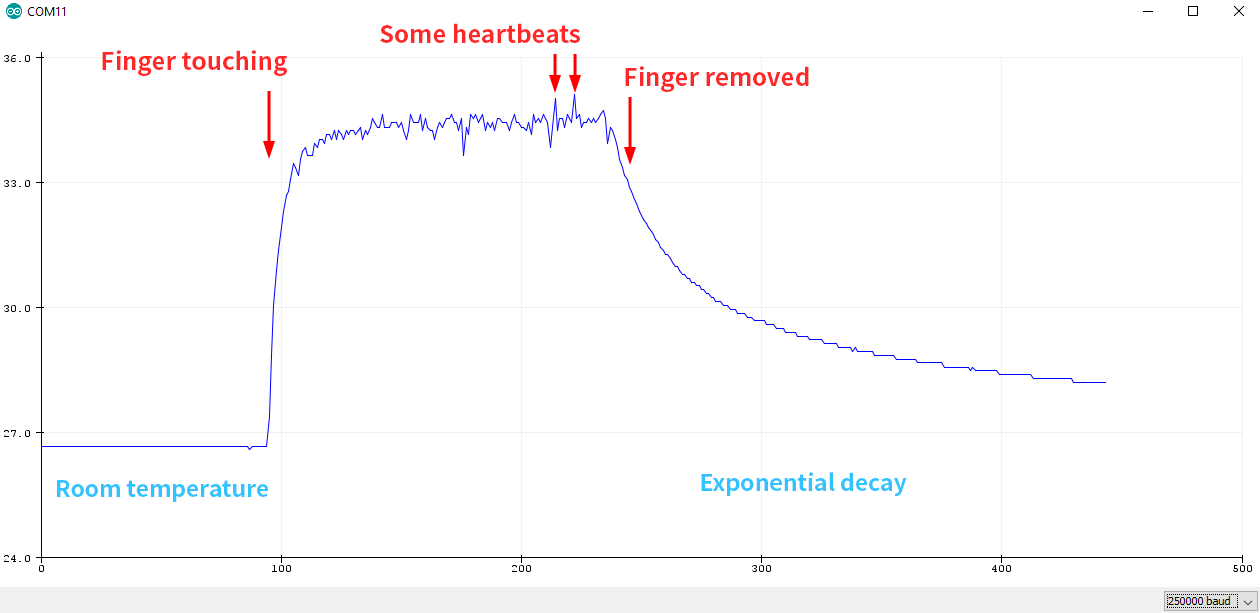
To display the values, we can make use of the embedded Serial Plotter of the Arduino IDE, available under Tools. This will automatically create a dynamic plot, displaying and updating any value received as a new line on the serial port. To create some dynamic in the graph, we place a finger on the probe.
As expected, the temperature increases in an exponential-like pattern. Interestingly, some heartbeats from the user were visible on the plot; this was confirmed by taking the pulse simultaneously. An explanation might be that the heat transfer was affected by the presence of blood.