7. Electronics design
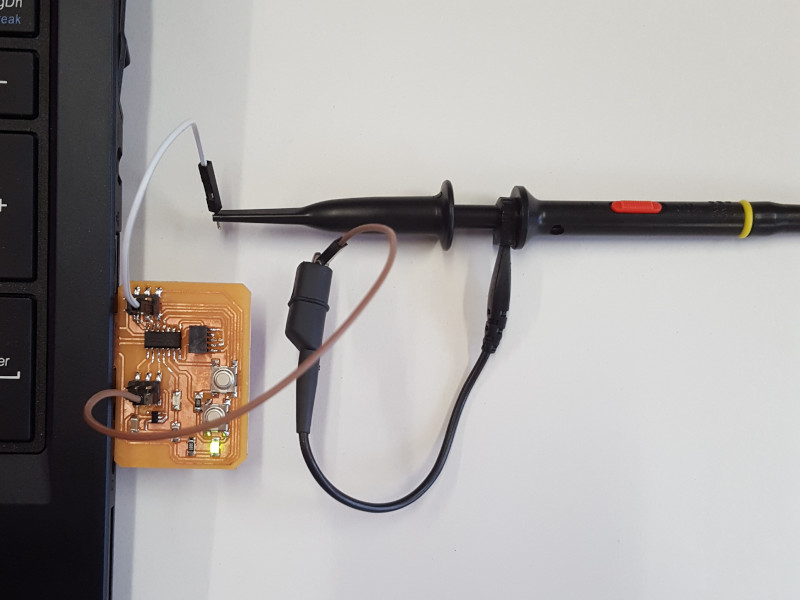
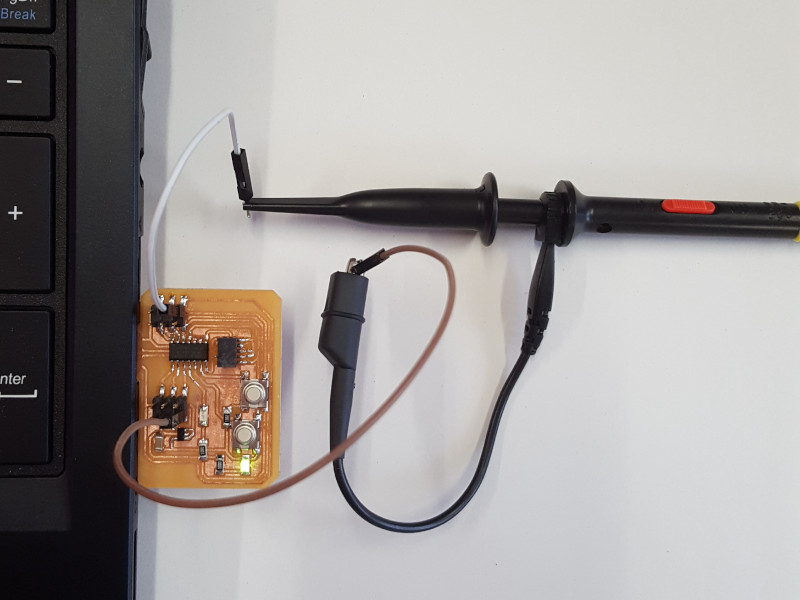
This week the group assignment consisted in using the test equipment in our lab to observe the operation of a microcontroller circuit board.
Equipment
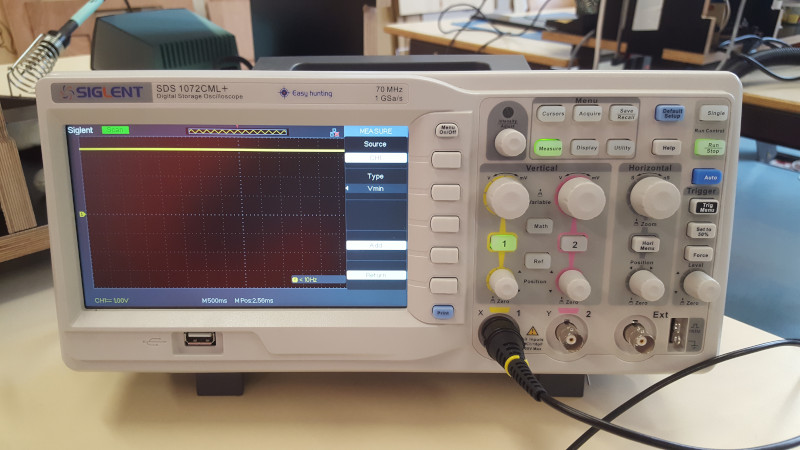
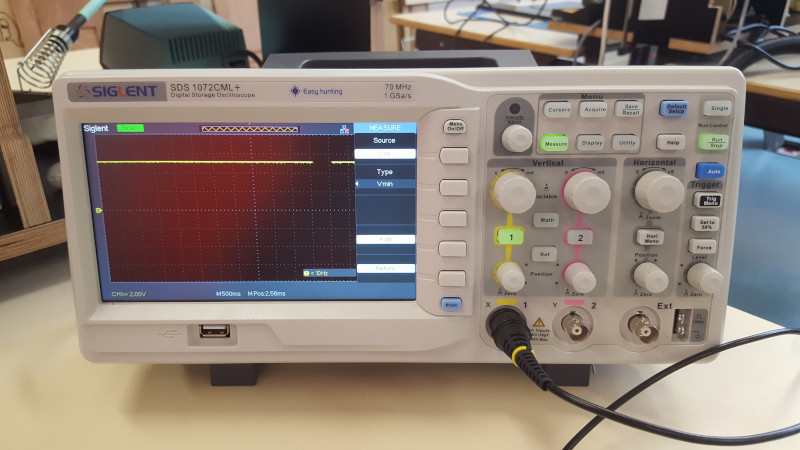
For this assignment we used the oscilloscope available at our FABLAB, a Siglent SDS1072CML+ 70MHz Dual channel oscilloscope.
Results
With this equipment we tested Robin’s board. We checked:
- the voltage delivered by the regulated power supply of 3.3V,
- the voltage delivered by the power supply of 5V,
- the voltage delivered on the LED when the button is active,
- the voltage delivered on the button pin,
- and the signals transmitted and received on the D+ and D- lines of the USB connector.
3.3V regulated power supply
We used a brown cable connected to the ground and a white cable connected to a 3.3V pin.
On the oscilloscope one square is vertically equivalent to 1.00V and horizontally to 500ms. On the picture bellow we can see that the measured voltage is equal to 3.3V, as excepted.
5V power supply
We used a brown cable connected to the ground and a white cable connected to a 5V pin.
On the oscilloscope one square is vertically equivalent to 2.00V and horizontally to 500ms. On the picture bellow we can see that the measured voltage is equal to 5V, as excepted.
LED diode
In the following video we used a brown cable connected to the ground and a white cable connected to pin PA14 of the ATSAMD11C, the pin connected to the LED. On the oscilloscope one square is vertically equivalent to 2.00V and horizontally to 100ms. When the button is activated the voltage applied on the LED switches from 0 to 3.3V
Button
In the following video we used a brown cable connected to the ground and a white cable connected to pin PA15 of the ATSAMD11C, the pin connected to the button. On the oscilloscope one square is vertically equivalent to 2.00V and horizontally to 100ms. When the button is activated the voltage applied on the pin PA15 of the ATSAMD11C switches from 0 to 3.3V
Upload signals with Arduino
In the following video we used a brown cable connected to the ground and a white cable either connected to the D+ (top frame of the video) or D- (bottom frame of the video) line of the USB connector. On the oscilloscope one square is vertically equivalent to 2.00V and horizontally to 100ms. In this video a program is uploaded with Arduino at 2.00s. After 10.00s the transmission ends. As expect D+ and D- signals are both the inverse of the other.
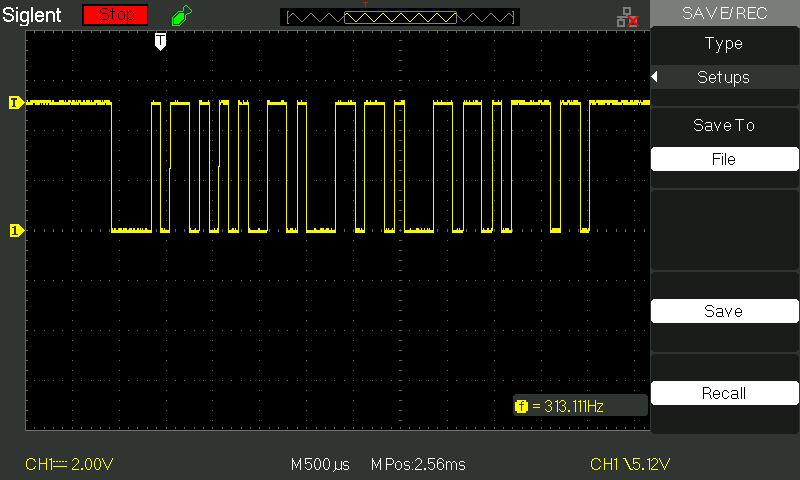
FTDI protocol
Finally, we wanted to see what happens when sending regular bytes on a serial port. We measured the signal on the TX pin of a USB-FTDI programmer. To make sure we capture the correct part of the signal, we setup the trigger on a falling edge around 1.6V. We can clearly see several bits being sent by the device.
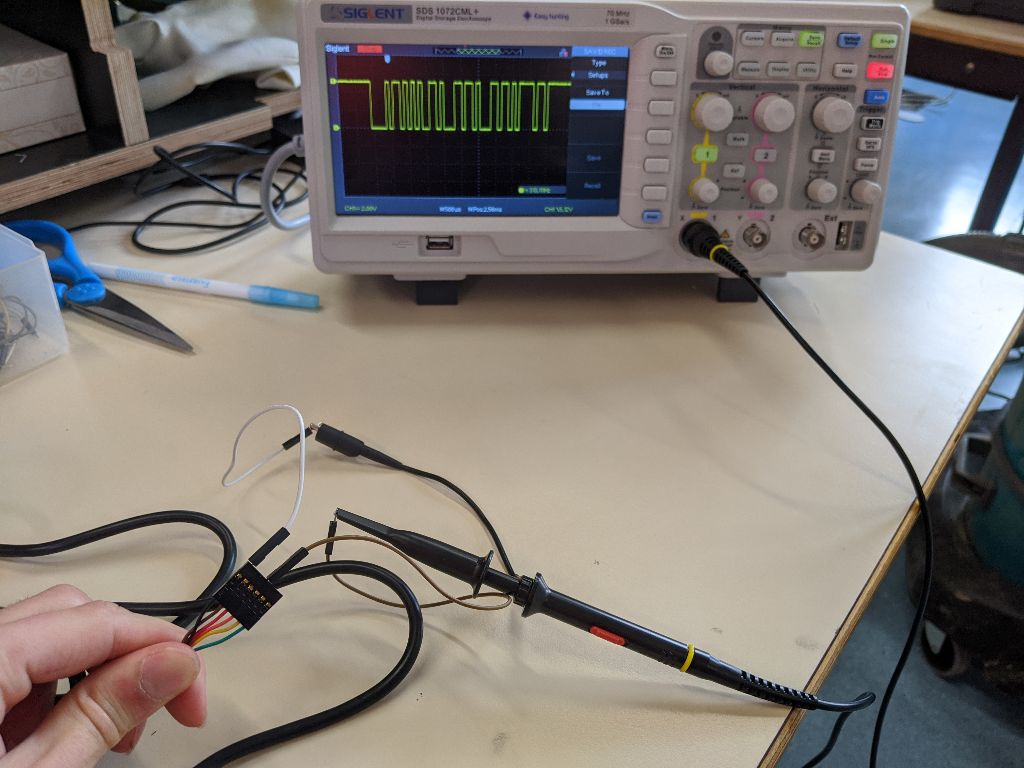
A screenshot from the oscilloscope shows the sharp transient between 0V and 5V, proving that this programmer could be used at a higher baudrate.