Creating graphic link to serial data
Sensor per exemple can generate serial data in number that we can tranform and see them in a graphic. It's a another way to see the data. The serial monitor on Arduino shows these written data one on top of each other or side by side, but don't allow you to create graphic. Processing put these data in a page form and create graphic with it.
Processor
Processing is one software that allows creating numeric art or creating visual related to data. It's a free software that you can link to the arduino IDE if you want. That mean's that you can write a code on arduino IDE and link it to this processing code. The serial port will be linked together and the data will be read, but this new visual processing software. I found that the architecture of this code is pretty similar to Arduino. You have library, a set up section and a draw section instead of loop.
Main tutorial
I found this tutorial on youtube that I use to generate my processing code. My goal of this week will be to transfer my data of air particule into a visual scale.
How to
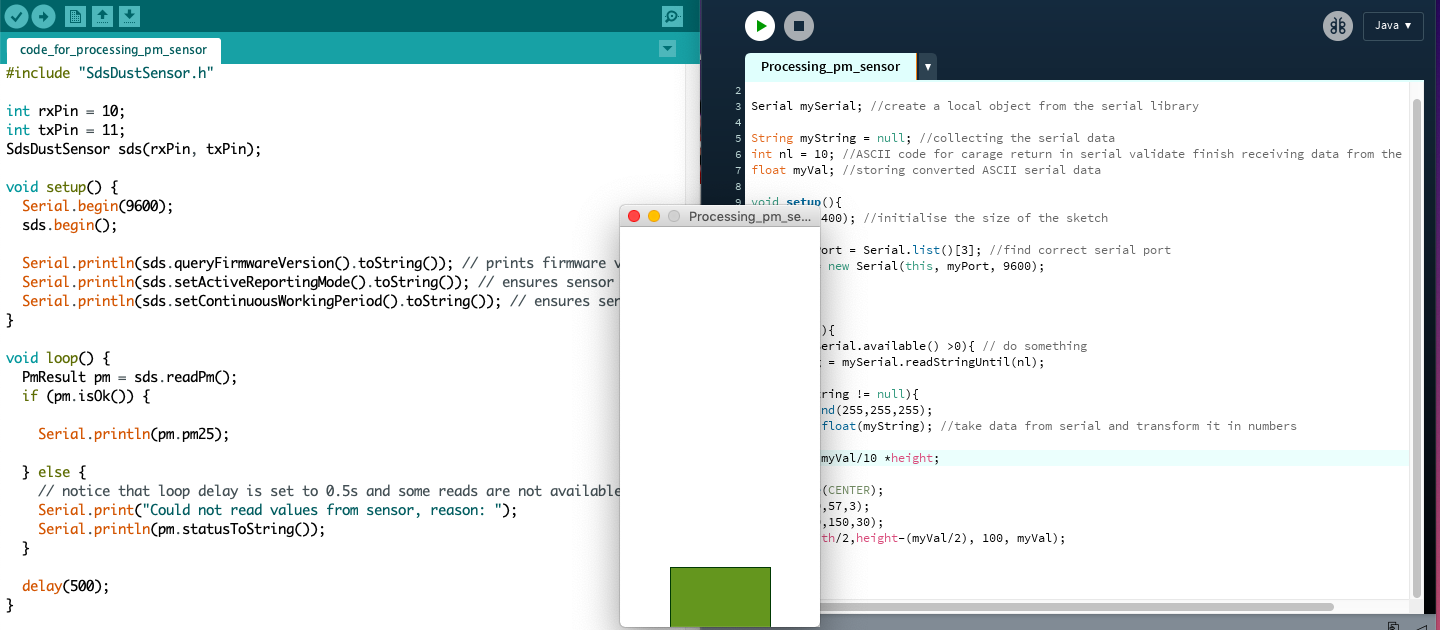
1-The code
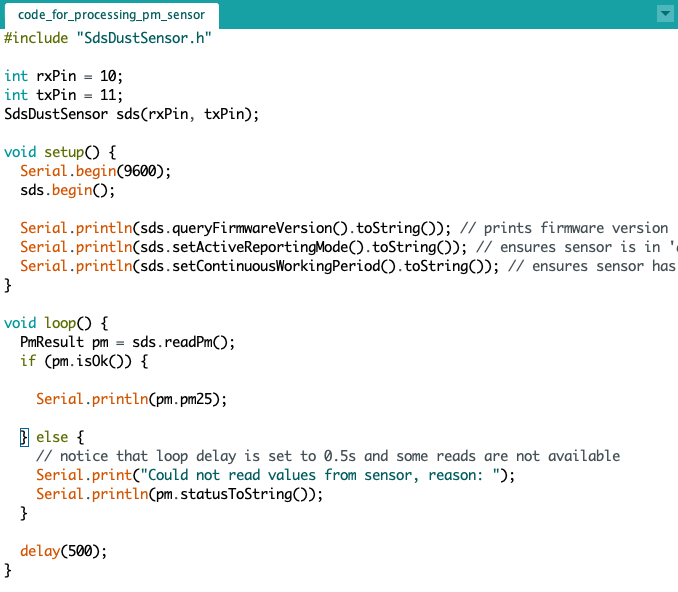
- I start by writting a very simple code to collect only the data from the pm 2,5.
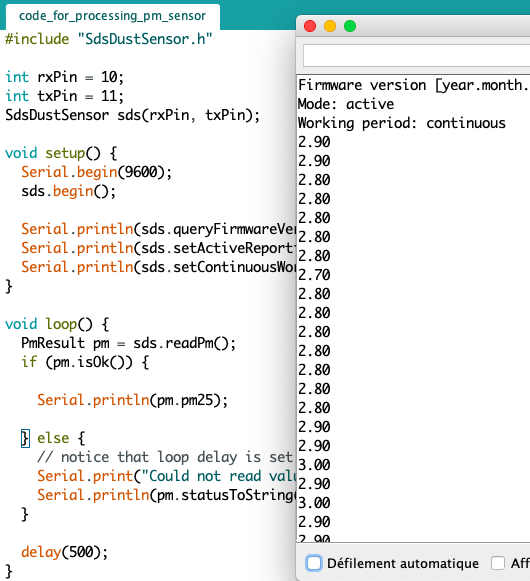
- I wire my sensor and test the arduino code to make sure that the code work. I open the serial monitor and the number there were very simple without any writtings.
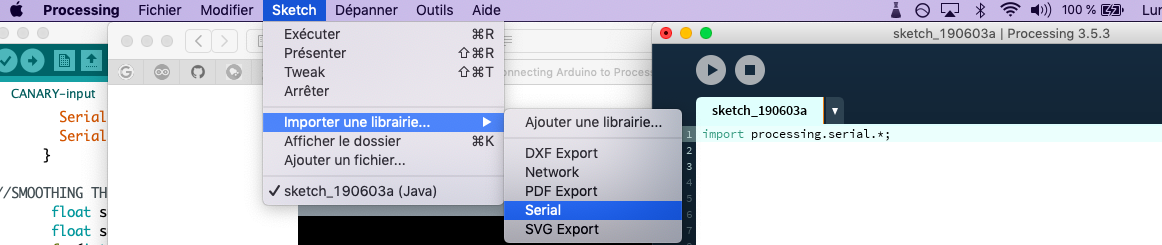
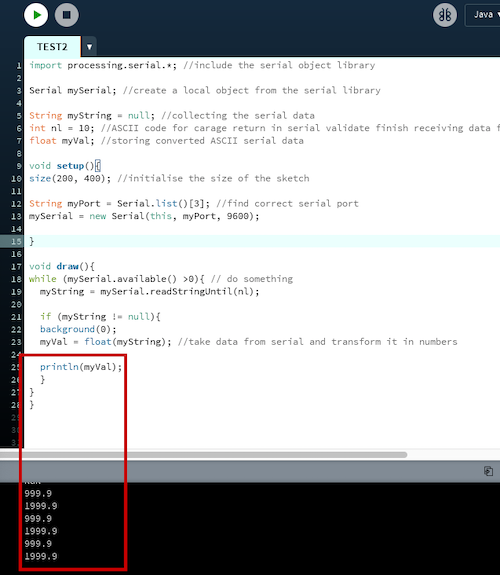
- I open Processing and in the menu Sketch, Import a library and Serial. This will add the import processing.serial.* library and you can initialze it by creating a local object. Serial mySerial;
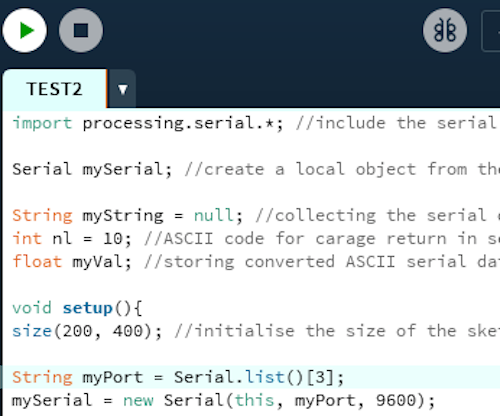
- A little bit like we do with the variable, we have to initialize the reading of the serial data. String myString;
- The first section is more about receiving the serial data and transform every string who pass trhough the serial port into a float so we can use them.
- The set up section is more about setting the size of my canvas and creating the link with the serial port. You basically specify the number of ports that you have and the speed baud that is running and it will do the match.
- The drawing section is where you will code the visual aspect of your graphic. You begin by saying that when you serial data is available and bigger than 0 you will do something.
- Setting the background:
- background (R, G, B); You can set the RGB color that you want.
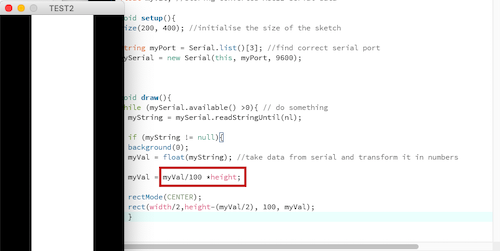
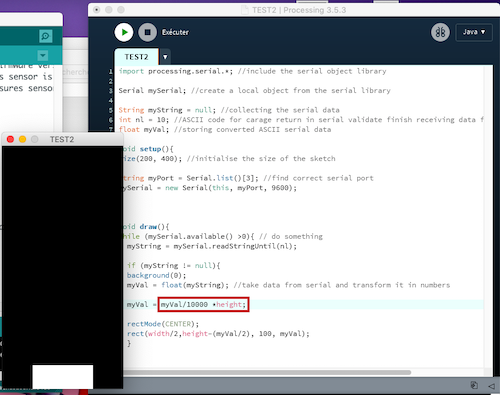
- myVal = myVal/100 *height; is the proportion of your data and the graphic. If you put it bigger than you can covers more range, but lose precision in the small scale. If you put it smaller than you lose the big scale but you can see the smaller variable.
- Creating a rectangle with your data. Set the rectangle position, than the color of it and than the size of it. The order is important to make processing understand well.
Creating a simple code for generating data and test it.
Inserting the Serial library
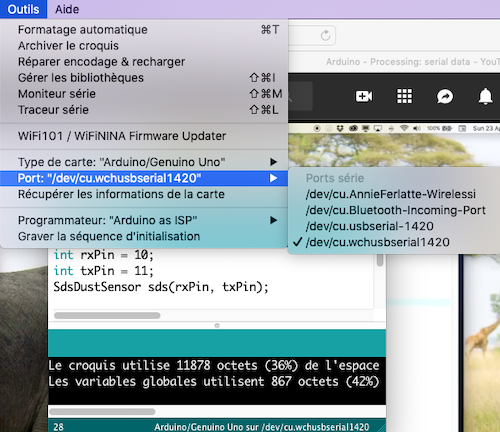
Match your serial port and your speed baud.
Testing if my processing code work, your can type println(myVal);
Play with this number to have a bigger view or a close up view of your data.
You can play with color with Stroke and fill to personalise.
Here a good explanation on how to Process form and color.
Final board with the processing
The moral of this story
I really like to create that link, to go outside of the arduino IDE and make something different. It's more mathematic than I expected but it was a very nice discovery. I saw some other exemple of making gradient using x and Y axis to make reference of the direction or level of gray depending of the value number. I will definitly explore more that processign in other projects. Files
Contact
Annie Ferlatte
ferlatte.annie@gmail.com
Montreal, QC, Canada