
Week 15
Week 15: Interface and Application Programming
I built the software side around XR machine interfaces and the NeuroAR dashboard, including VRKanji, ARBrushMachine, and the first agentic glasses interface ideas.
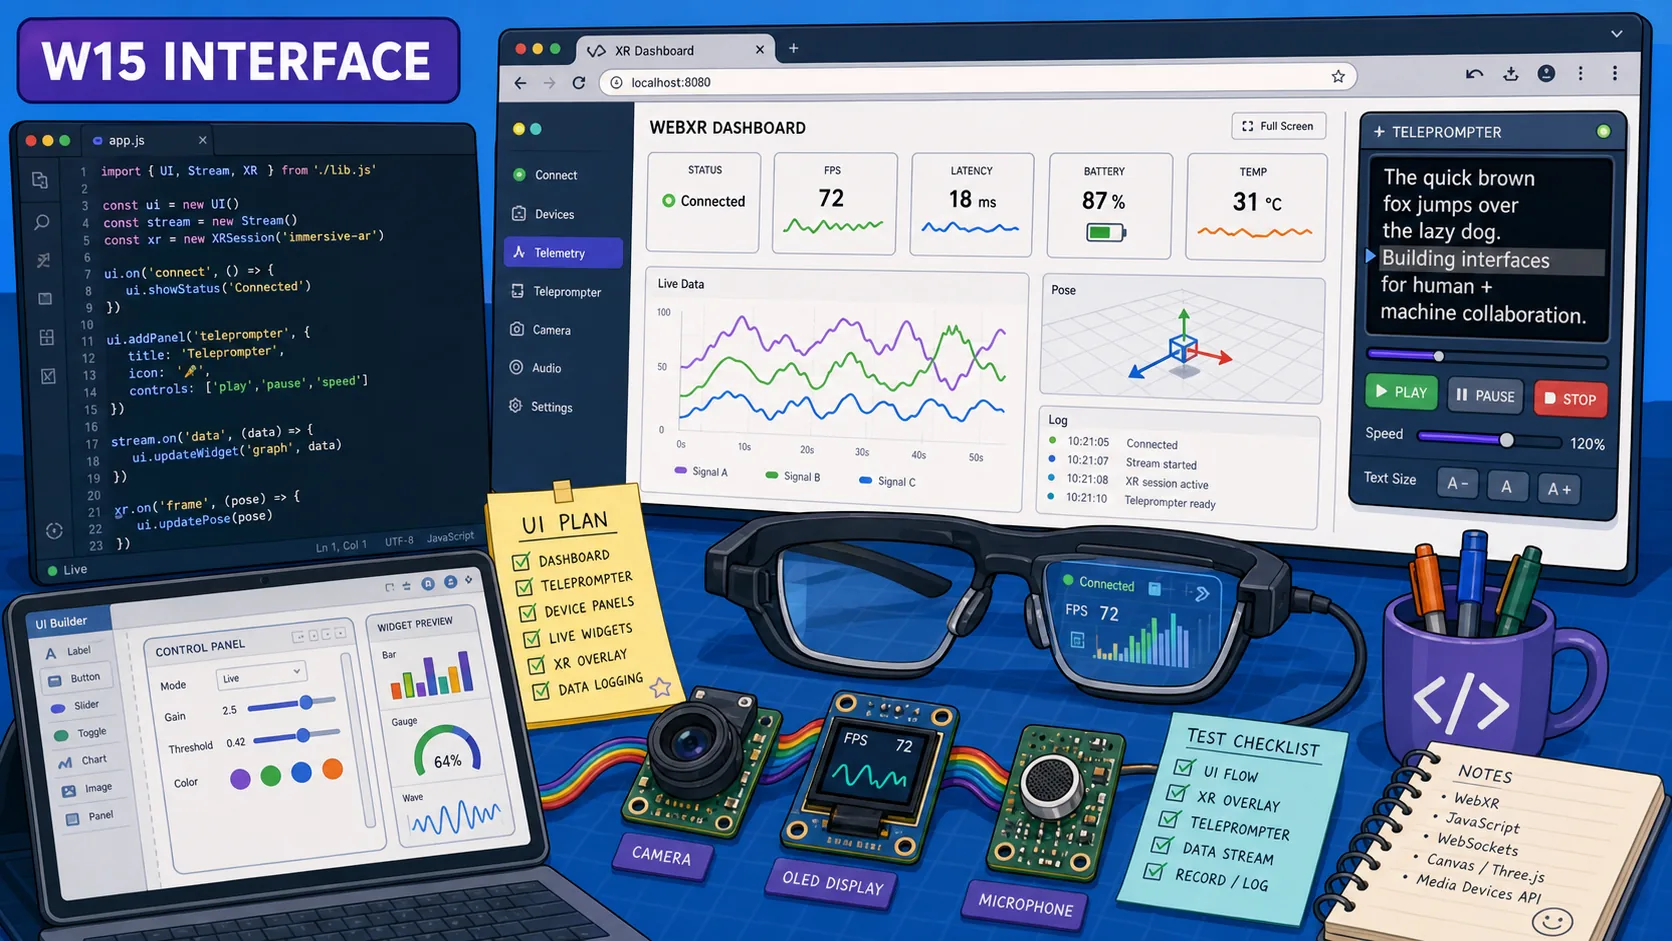
This week was pretty fun. I built a fun experiment with my Oculus headset to control the KanjiXYZ we built during machine building week and created a dashboard to manage the functions of my AR glasses (final project).
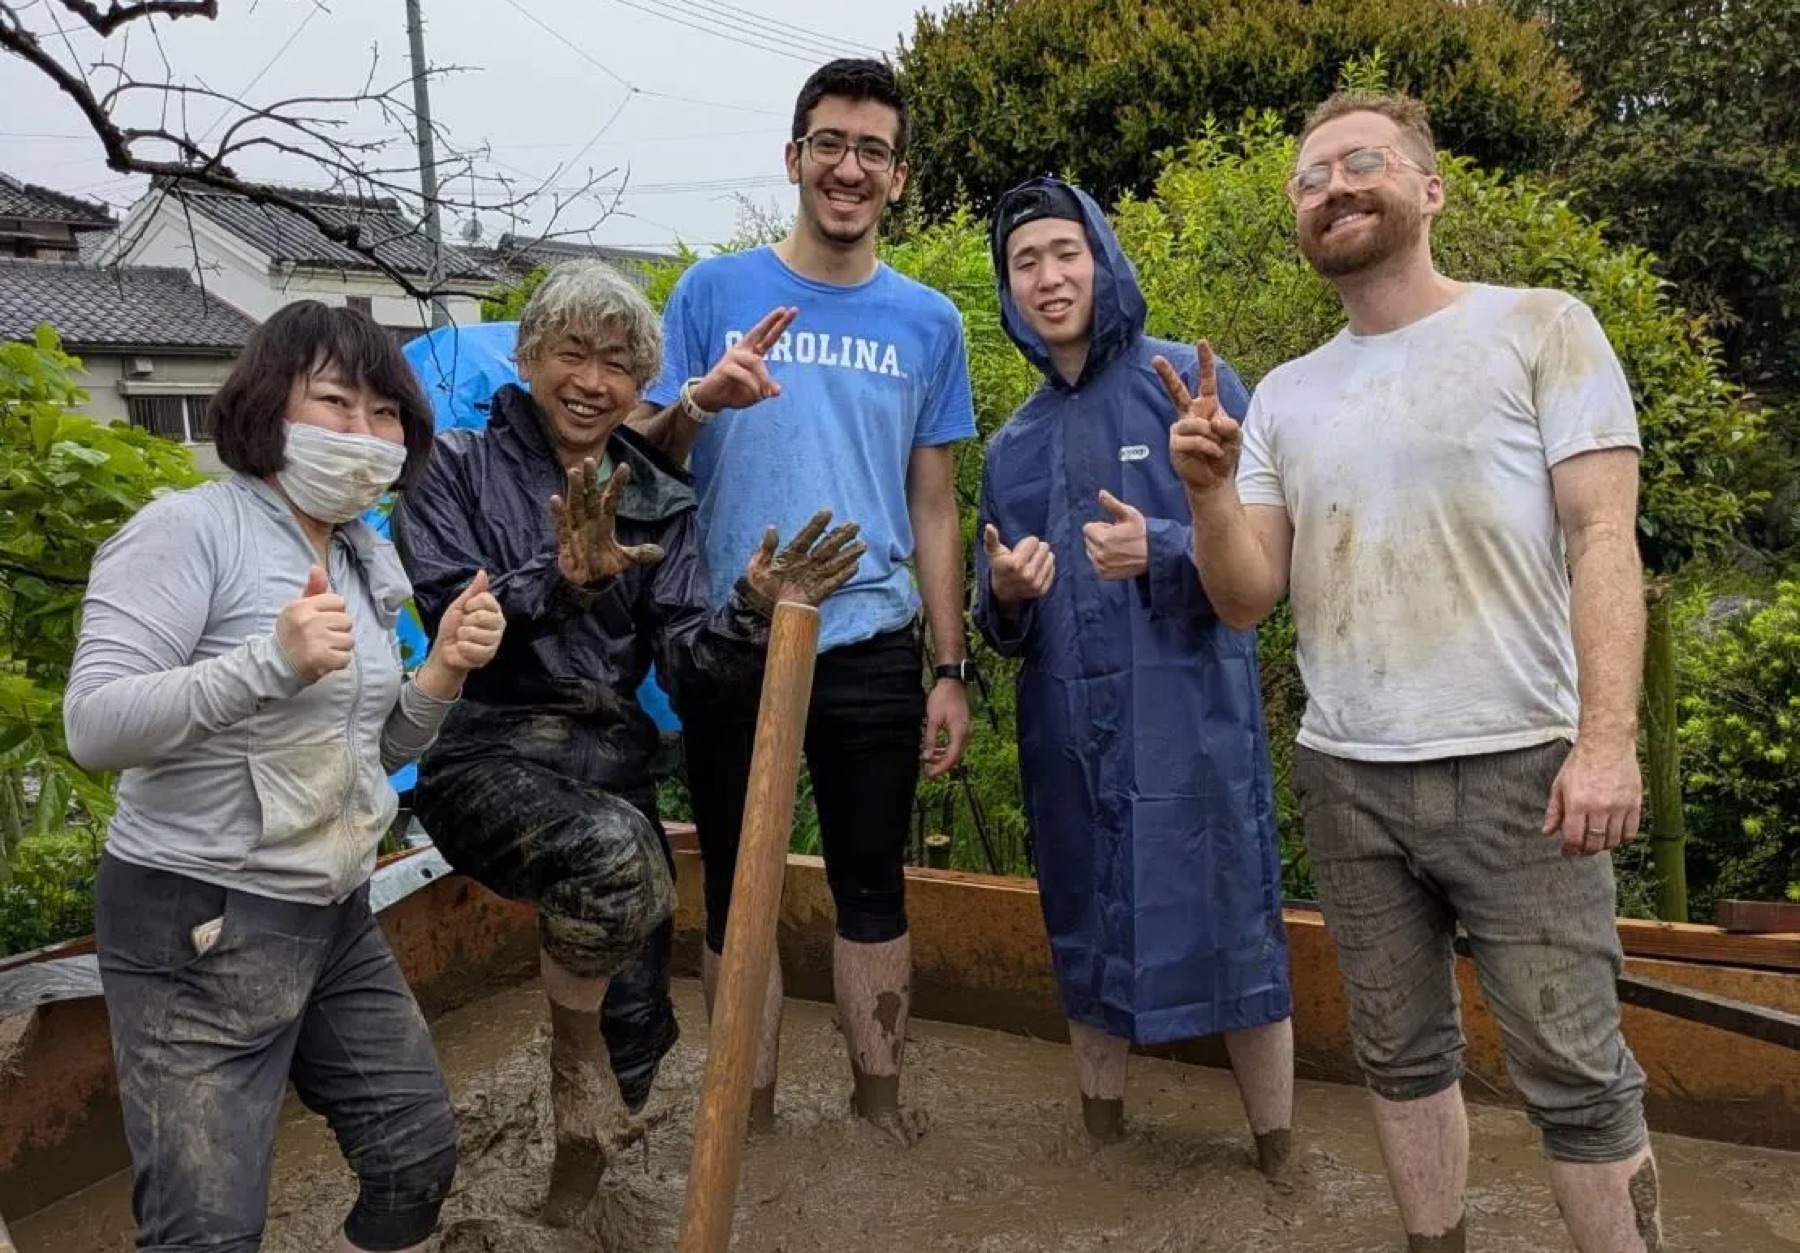
Also, during the week, I went on a crazy sidequest with Kieran and Fumiko to restore an old Japanese house, and then, I went alone ISLAND HOPPING, I wouldn’t have thought I’d do that before coming to Japan, tbh.
Group Assignment (Sort of): Testing Different Tool Options
The group assignment this week to mainly for each of us individually compare the different tools we used. In my individual assignment documentation, I show how I used JavaScript/HTML/CSS in the browser, Web Serial, HTTP/WebSocket-style device communication, JSON, Node.js, Three.js/WebXR, and embedded C++ firmware on the ESP32-S3. I also utilized Codex to help teach and guide me through the code, debugging, and understanding the communication paths.
Learnings from Global Session
This week's global session was about building an application that interfaces a user with an input or output device that we made.
The useful part of the session was seeing the range of options. Some of them became part of my week directly, like JavaScript, Web Serial, JSON, Three.js, and WebXR. Others were more like references for how interface/application programming can be approached.
It was a pretty cool session that gave us a taste of everything (ofc not as deep into specific aspects, but with all the AI tools, exploring and testing different types of software hasn’t been easier and more fun).
Languages And Runtimes
Neil started by showing different programming languages and simple Hello World examples. He showed us this website with a ton of examples of hello world in different languages.
The point was that the language changes the shape of the interface: where it runs, what libraries it can use, and how easily it can talk to hardware.
Neil also started from C/C++ because that is still close to embedded work. C++ adds objects/classes and methods on top of C, and Arduino sketches are basically C++ programs. GCC is the compiler toolchain behind a lot of that embedded/software work. He also mentioned .NET/Mono and Go as other compiled/runtime directions, but the part that mattered most here was understanding that the Arduino/ESP32 firmware side is C++.
Bash was another practical language he brought up. A terminal on macOS or Linux usually runs a shell like Bash. You can type commands manually, or write a script so repeated command-line workflows happen automatically. Neil's example was automating video formatting for the class website. For my work, this is more about automating setup/check/build commands than building the final visual interface.
Python is a general-purpose language that is useful for hardware interfaces because it has strong libraries for serial communication, math, plotting, data processing, and quick desktop apps. It is also cross-platform, so the same code can often run on macOS, Windows, and Linux.
For physical computing, Python is often used with packages like PySerial, NumPy, Matplotlib, Tkinter, or Jupyter. The annoying part is package management.
venv and Conda both create isolated Python environments, which helps stop one project's packages from breaking another project's packages.
Conda used to give me nightmares when I used to have a windows PC as my main dev device.
Processing (never heard about it before tbh) is a creative coding environment built around drawing and interaction. Its structure is close to Arduino: you set things up once, then run a repeated draw/update loop. That makes it a good fit for simple visual interfaces, sketches, and graphics that respond to data.
Arduino was originally influenced by Processing, so the mental model is familiar: initialize, loop, read input, update output.
JavaScript is the main language of the browser. If the interface is a webpage, JavaScript is what reads button clicks, updates the DOM, draws on a canvas, opens Web Serial, sends HTTP requests, or starts WebXR.
Node.js lets JavaScript run outside the browser, usually as a local server or command-line tool. That is useful when the browser needs a local backend for things like saving settings, serving files, or bridging to other processes.
V8 is the JavaScript engine used by Chrome and Node. It uses just-in-time compilation, which means it can compile parts of JavaScript while the program is running to make it faster.
WebAssembly is a low-level browser runtime target. Instead of only running JavaScript, the browser can run code compiled from languages like C, C++, or Rust. The idea is that heavy code can run closer to native speed while still living inside a webpage.
Rust is a systems programming language, closer to C/C++ than Python or JavaScript. The main thing Neil pointed out was memory safety.
In C, it is easy to accidentally read outside a buffer or make concurrency mistakes. Rust's compiler prevents many of those problems before the program runs.
I did not use Rust this week, but it was useful as a reference for why some people choose it for reliable low-level software. I might learn it over the summer.
Getting From The App To The Board
After languages, Neil moved into communication. An interface is not useful unless it can actually reach the device.
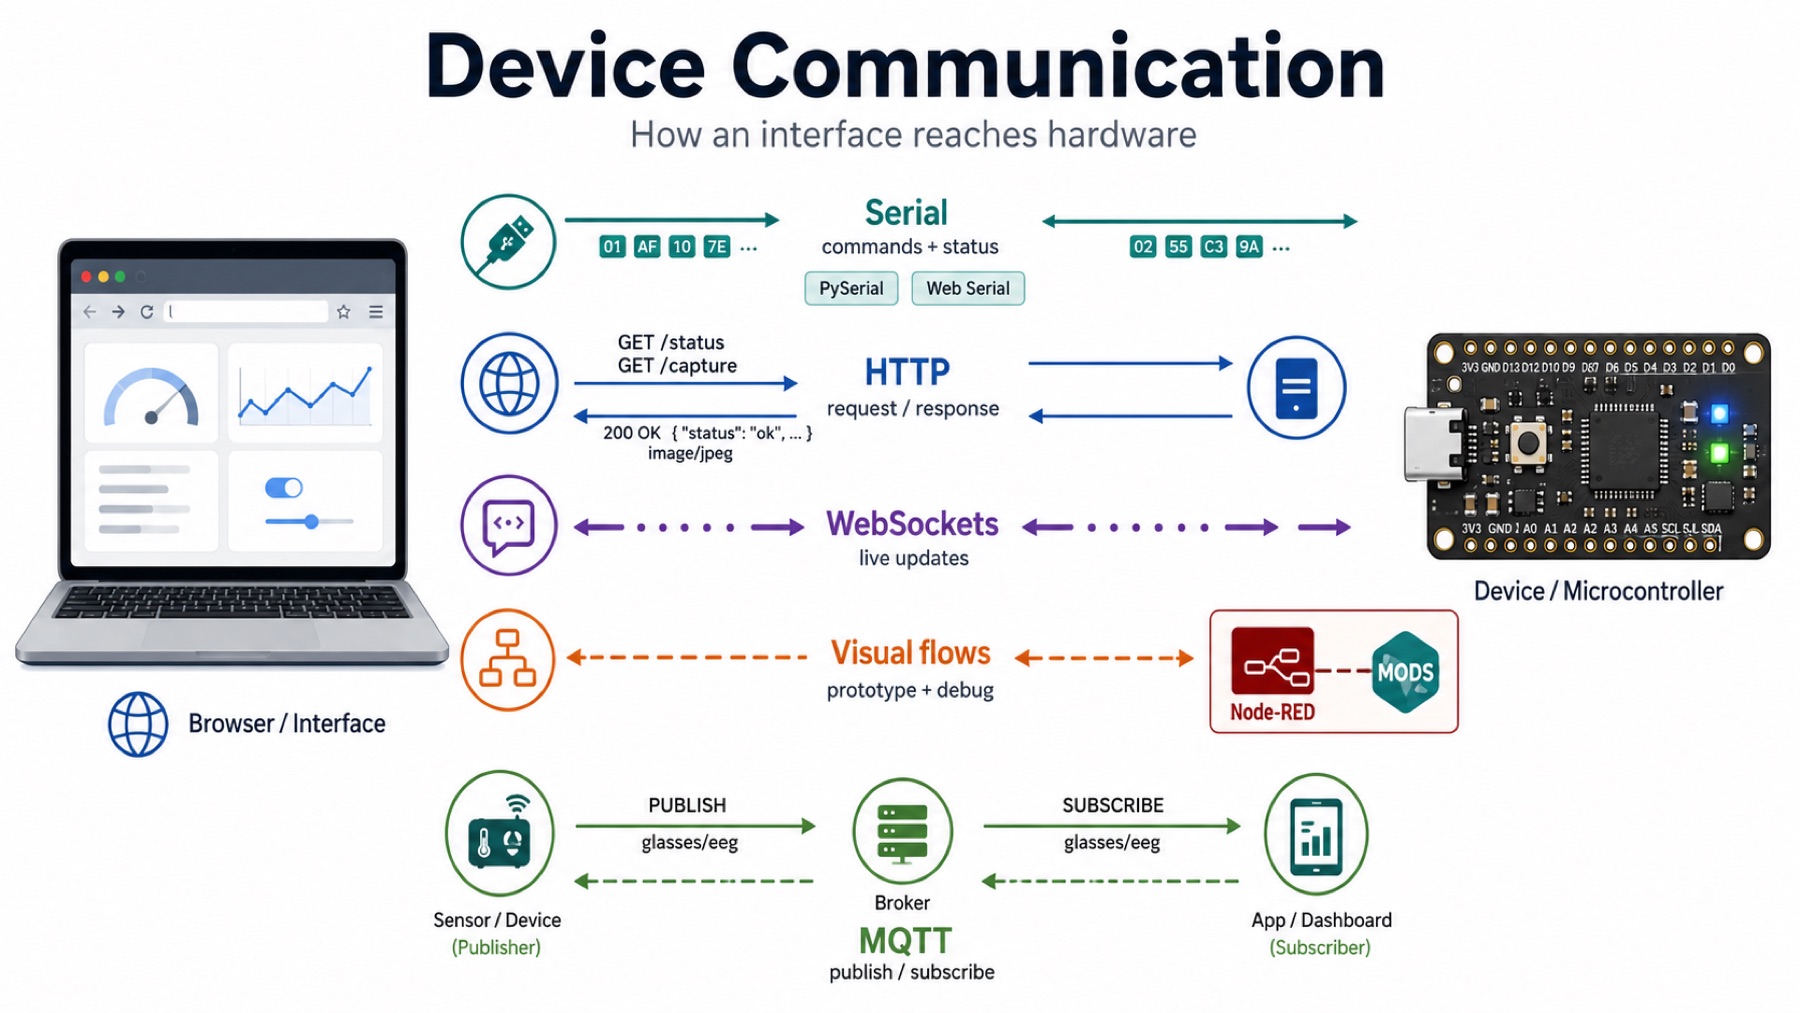
Serial is one of the simplest ways for a computer and a board to exchange data. It sends bytes over a connection like USB serial or UART. The application can send commands, and the board can print status messages or sensor data back.
PySerial is the Python library for serial communication. Web Serial is the browser API that lets Chromium-based browsers talk to serial devices directly. I used this idea heavily because my dashboard can talk to the XIAO over USB serial.
HTTP is the normal request/response system used by the web. A browser asks for something like /status or /capture, and the board or local server sends back a response.
WebSockets are different because they keep a connection open. That makes them useful for live updates, where the device needs to push events to the interface instead of waiting for the browser to repeatedly ask.
Neil also explained why browsers need WebSockets instead of letting webpages open any raw network socket. If a random webpage could open arbitrary sockets, it could do unsafe things like denial-of-service attacks. WebSockets are the browser-safe version for this kind of live network communication.
Node-RED is a visual programming tool for wiring systems together. Instead of writing everything as code, you connect nodes that represent inputs, outputs, processing steps, APIs, and devices. It is useful for quick prototypes and debugging flows.
I talked a lot about MODS before and I used it too. It is a Fab Academy tool that works in a similar data-flow way. You connect modules together to process files, generate machine paths, or communicate with devices.
MQTT is a publish/subscribe protocol. A broker, such as Mosquitto, sits in the middle. Devices publish messages to named topics, and other devices subscribe to the topics they care about.
For example, a sensor could publish to glasses/eeg, and another app could subscribe to that topic to display the data. I did not use MQTT this week, but it is useful for systems with multiple devices sending messages independently.
The demo made the idea clearer because the same LED/button state moved between a terminal publisher/subscriber, a webpage, and an ESP32. The important part is that each piece only needs to publish or subscribe to the right topic; the MQTT broker handles the routing.
I also found this cool example on X/Twitter of transferring data through QR-code frames. I thought it was a fun example because it shows that communication does not have to be USB, Wi-Fi, or a normal network protocol.
The data can be encoded visually, shown as a sequence of QR codes, read by another device's camera, decoded, and reassembled.
It is essentially 1) splitting the data into chunks, keeping the chunks in order, detecting missing/corrupt frames, and rebuilding the original file.
Data Formats
The session also covered data formats, because the app and the device need to agree on how information is written.
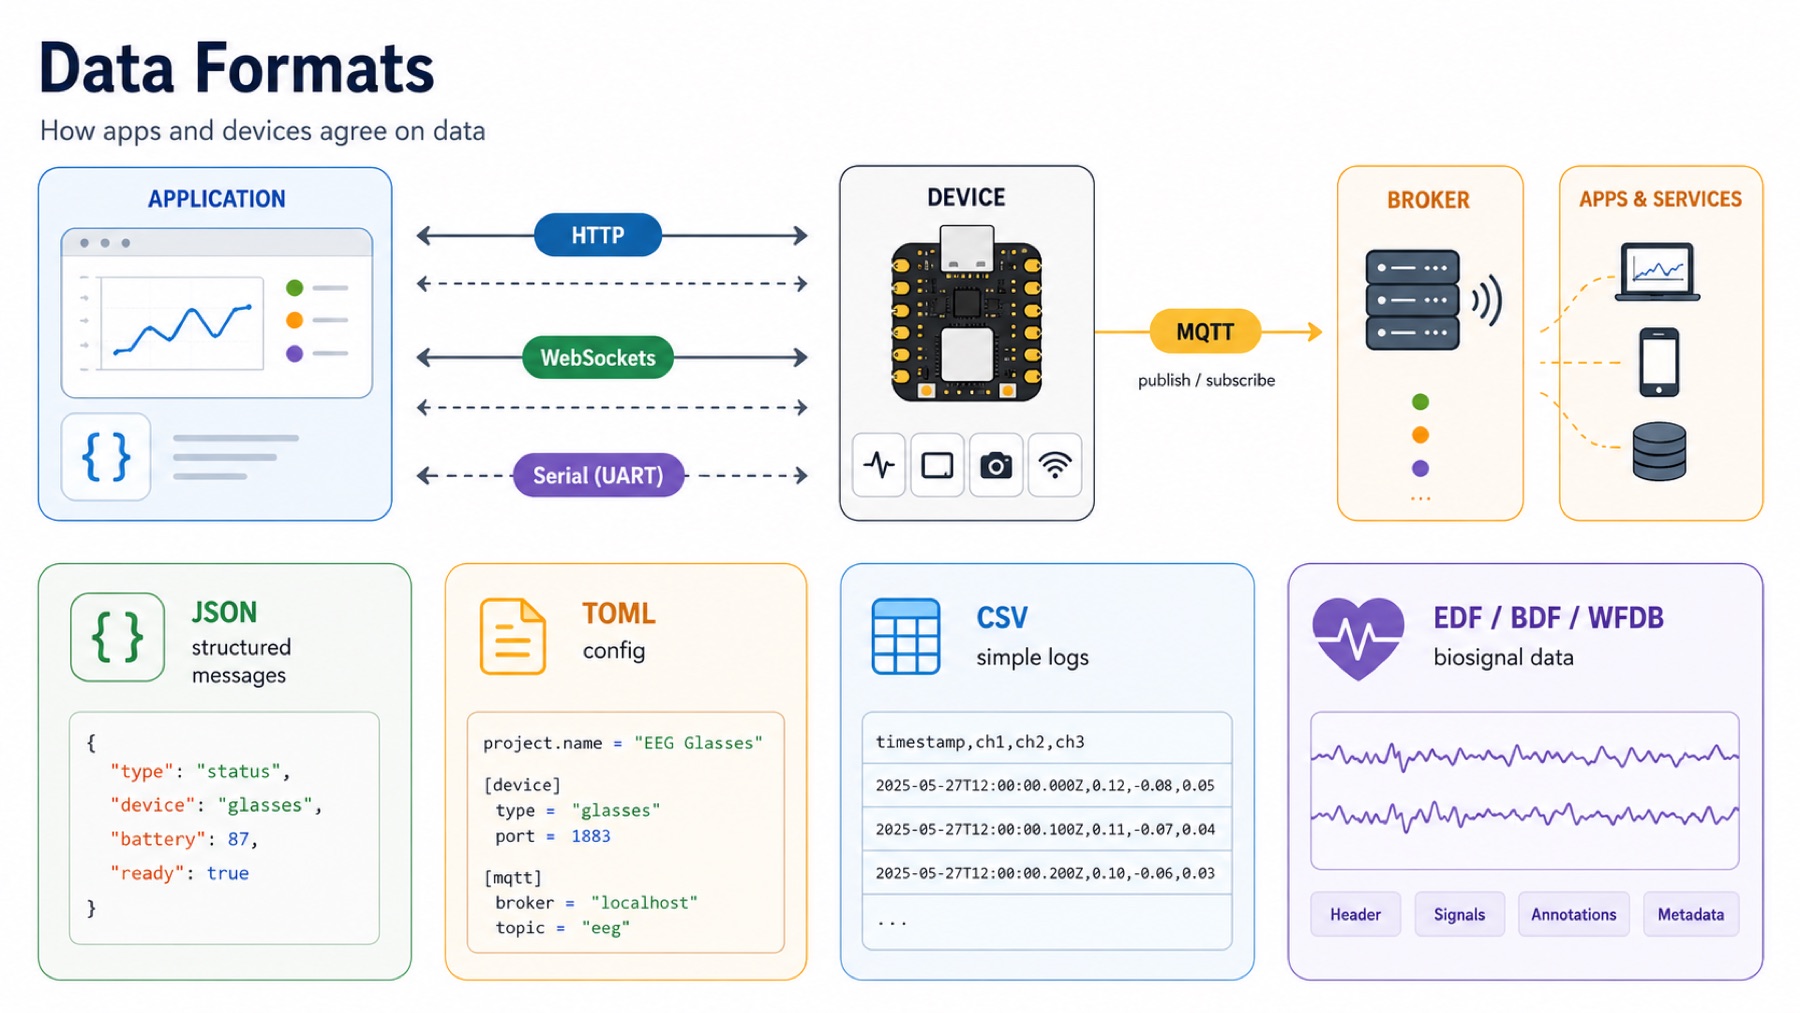
JSON is a text-based format for structured data. It can represent objects, lists, strings, numbers, booleans, and nested data. It is readable, easy to debug, and works naturally with JavaScript.
JSON matched my work this week because I sent things like status events, OLED messages, EEG packets, camera metadata, and agent responses as structured messages.
TOML is another text format, but it is usually used for configuration files. It is easier for humans to edit than deeply nested JSON. It is useful for settings like project names, build options, API configuration, or environment settings.
CSV means comma-separated values. It is a simple table format where each row is a line and each value is separated by a comma. It is not good for complex nested data, but it is still useful for logging sensor readings because spreadsheets and plotting tools can open it easily.
For more serious medical or time-series data, people usually use formats that store more metadata with the signal. EEG/ECG recordings often use formats like EDF/EDF+ or BDF because they can store channel names, sample rates, units, recording time, and annotations along with the waveform.
PhysioNet-style datasets often use WFDB, which keeps waveform data and header metadata together in a reproducible way.
This wasn’t mentioned in the session, but thought it would be a useful addition because of my background :D
Building The Interface Itself
The UI part was about the actual controls and visuals the user interacts with.
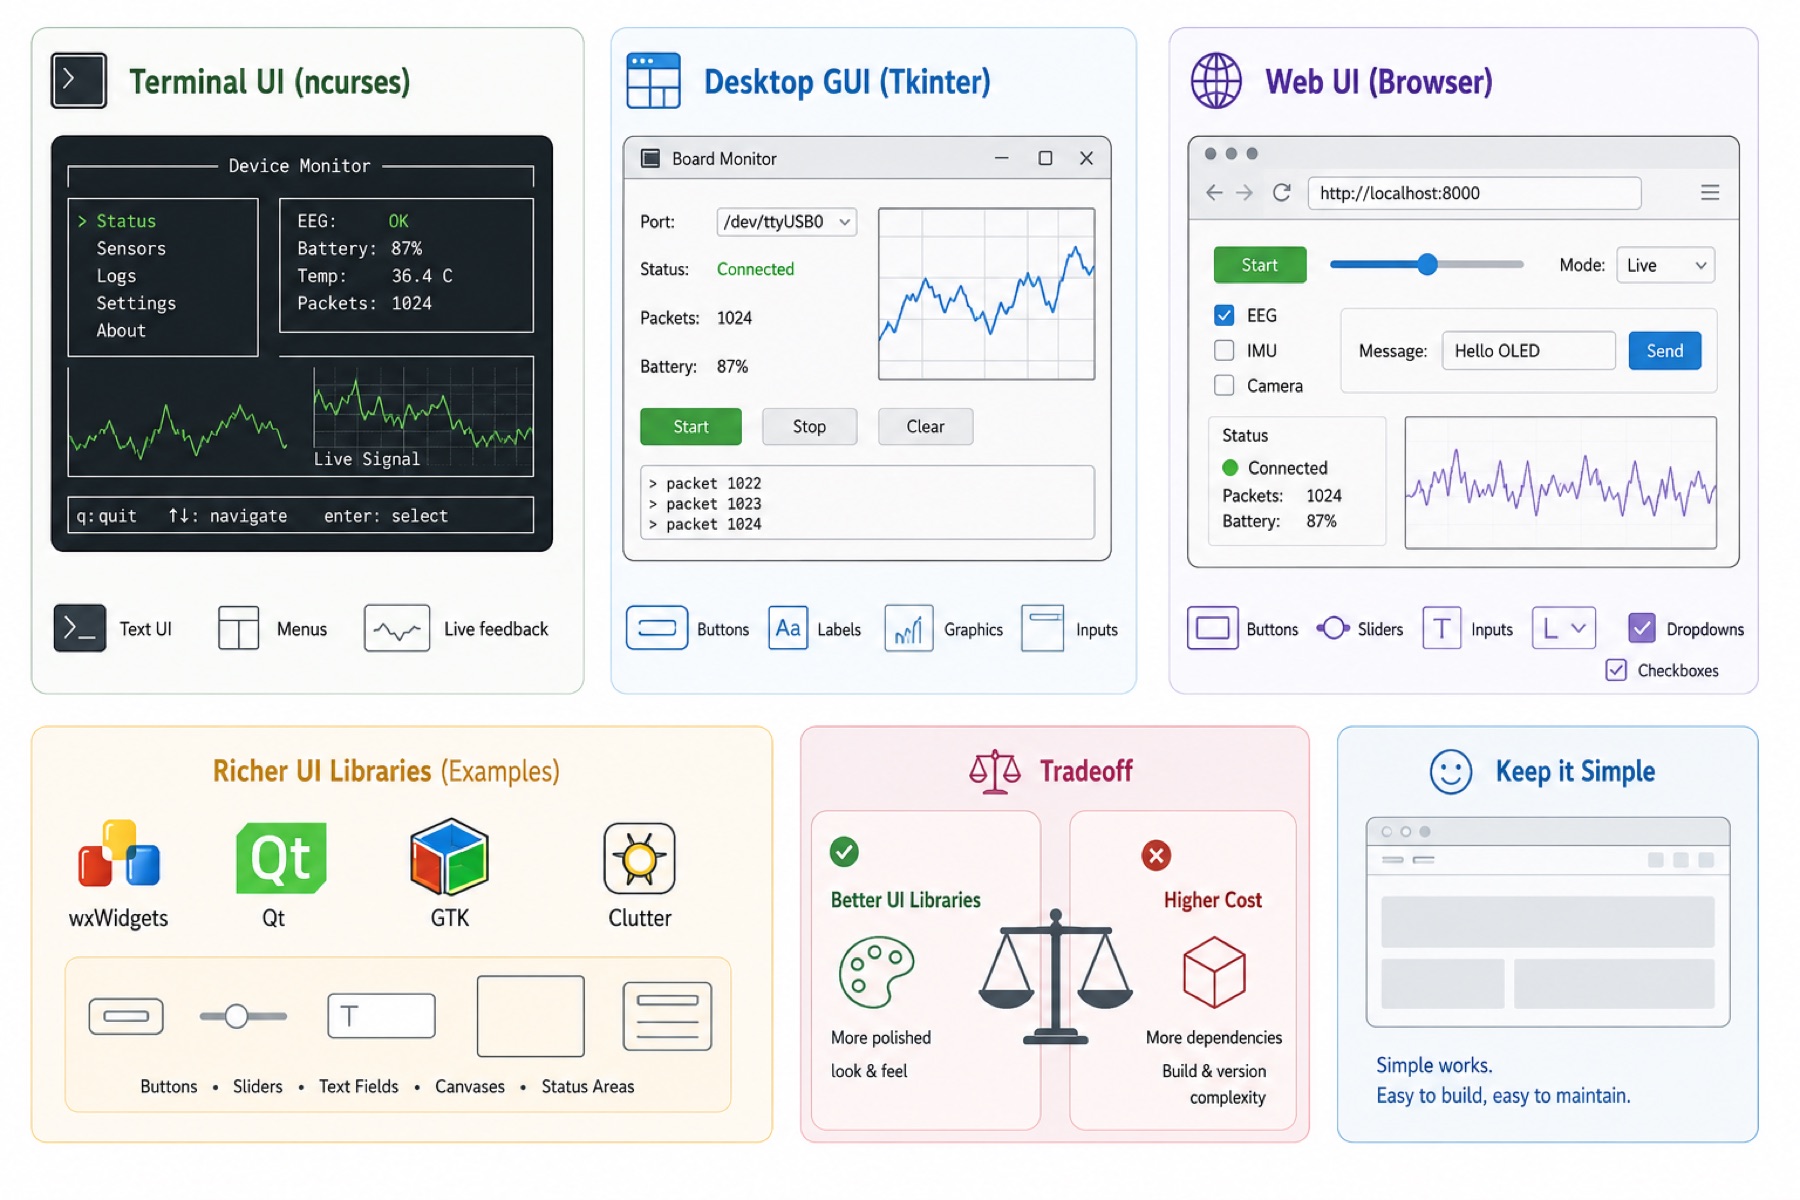
Curses (or ncurses, the widely used version of it) is a terminal UI library. It lets a program draw text, boxes, menus, and changing interface elements inside a terminal window. It is not a graphical app, but it can still make structured interfaces.
The important idea is that an interface does not have to be visual in the modern app sense. A terminal can still expose controls, status, and live feedback.
Tkinter is Python's built-in desktop GUI toolkit. It can make windows with buttons, text fields, labels, and canvases. Neil's example used PySerial to read data from a board, then updated text and graphics in a Tkinter window.
The pattern is simple: read the device, parse the data, and update the UI.
Browsers already include many interface elements: buttons, sliders, text inputs, radio buttons, checkboxes, dropdowns, and forms. For many board dashboards, these built-in controls are enough.
That matters because a hardware interface does not always need a heavy frontend framework. A page with a few controls, a status area, and a canvas can already be a real interface.
There are richer desktop/widget libraries like wxWidgets, Qt, GTK, and Clutter, plus JavaScript widget libraries for nicer browser interfaces.
The controls are still the same basic idea: buttons, sliders, text fields, canvases, and status areas. The tradeoff is dependencies. A nicer UI library can make the interface look more polished, but it also adds packages, build steps, and version problems to manage.
There is a reason most of Neil’s websites like FabAcademy’s are very simple.
Graphics, XR, Sound, And Video
This part connected to the more visual side of interface programming.
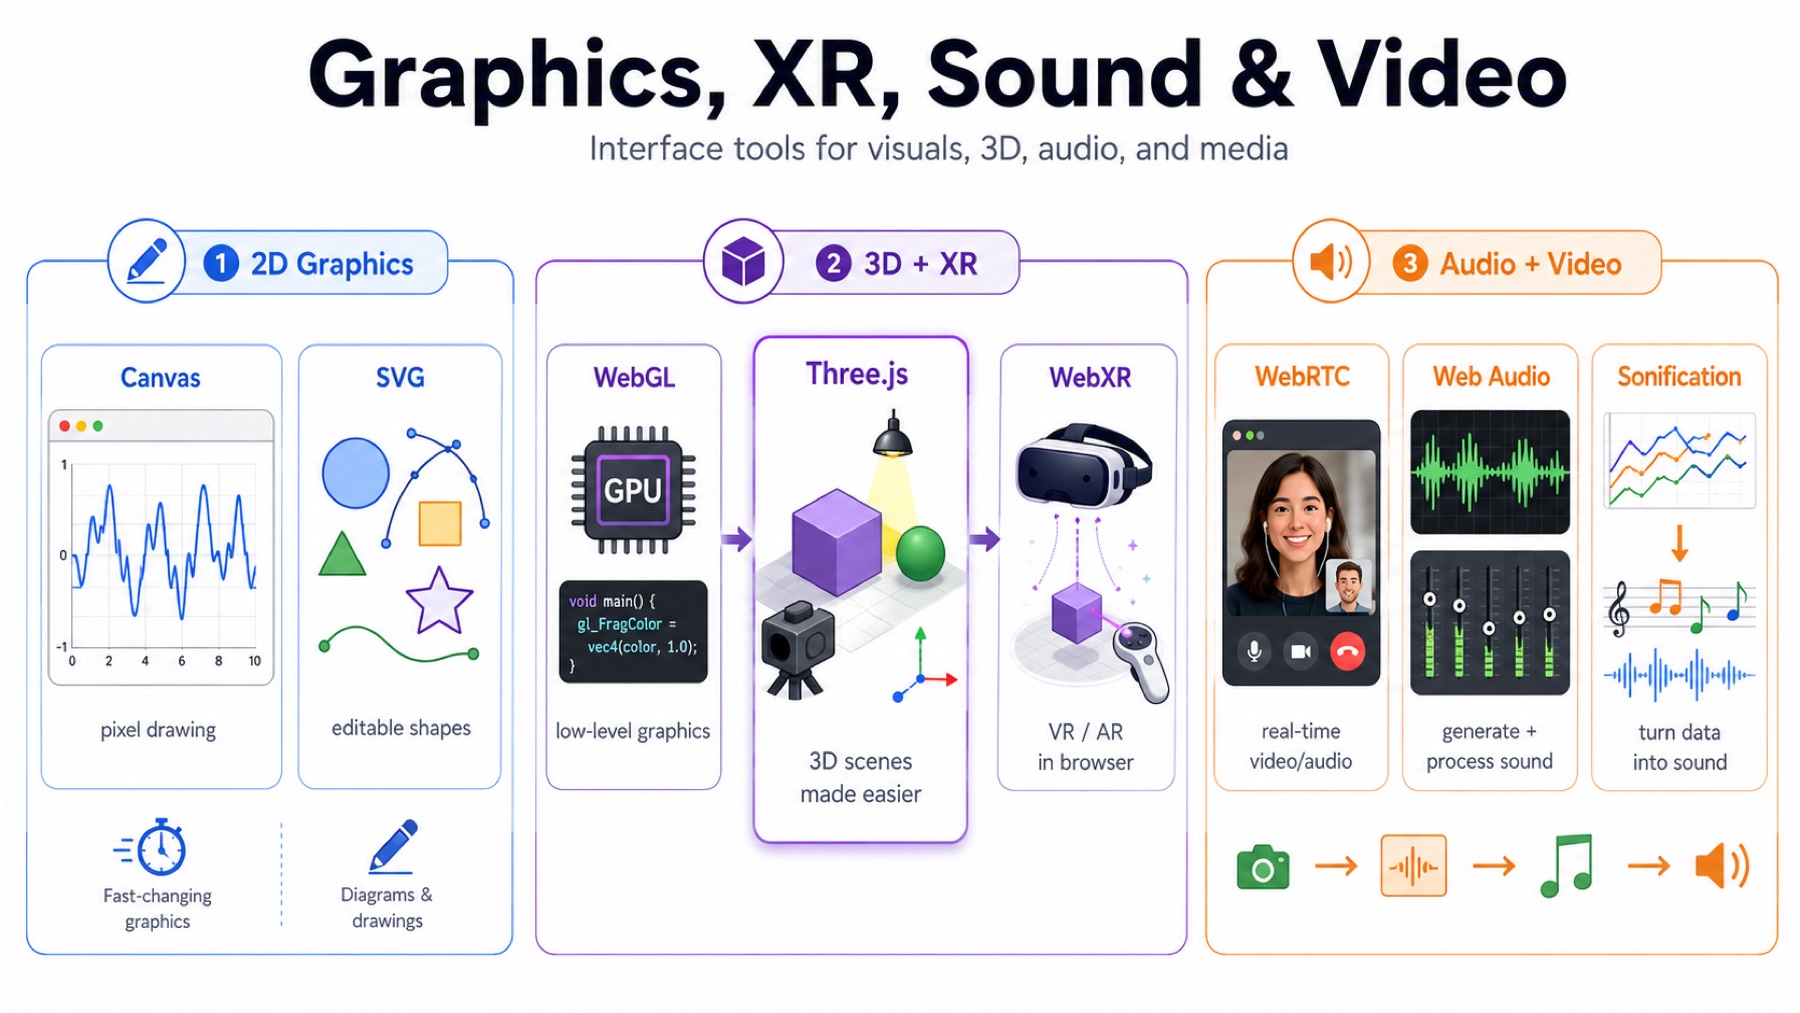
Canvas is a browser drawing surface. JavaScript draws pixels into it, clears it, and redraws it. This makes Canvas good for fast-changing graphics like plots, camera overlays, or signal traces.
SVG is different (our good old friend, lol). SVG stores shapes as objects: lines, circles, paths, text, and groups. This makes it better for editable vector graphics, diagrams, and drawings that need to preserve shape information.
WebGL is the browser API for GPU graphics. It is powerful, but raw WebGL requires handling shaders, buffers, and lower-level graphics details.
Three.js is a JavaScript library built on top of WebGL. It gives higher-level objects like scenes, cameras, lights, geometry, materials, renderers, and animation loops. Instead of manually managing the GPU details, I can build a 3D scene and update it every frame.
The basic Three.js structure is: create a scene, add a camera, add geometry and lights, create a renderer, attach it to the page, and animate it.
Neil also mentioned WebGPU and game engines like Unity, Unreal, and Godot. I did not use those this week. Three.js was the right level for my XR work because it gave me 3D scenes and controller interaction in the browser without making me write lower-level graphics code.
WebXR is the browser API for VR and AR. It lets a browser access headset pose, controller pose, and immersive sessions. In my case, that meant the Quest Browser could turn controller movement into interaction inside a 3D scene.
More on these last two below.
WebRTC is a browser standard for real-time audio/video communication. It is often used for video calls, streaming camera data, or peer-to-peer media. If you joined a google meet or a zoom call on a web browser, you’ve used it.
Web Audio is a browser API for generating and processing sound. It can synthesize tones, filter audio, analyze frequency content, and play sound based on data.
Sonification means turning data into sound. For example, instead of only plotting a sensor signal, the interface could make the pitch, volume, or rhythm change with the signal. I did not build that this week, but it is a useful interface idea for sensor data.
Data, Notebooks, And Performance
Neil also talked about tools for understanding data streams and making programs faster.
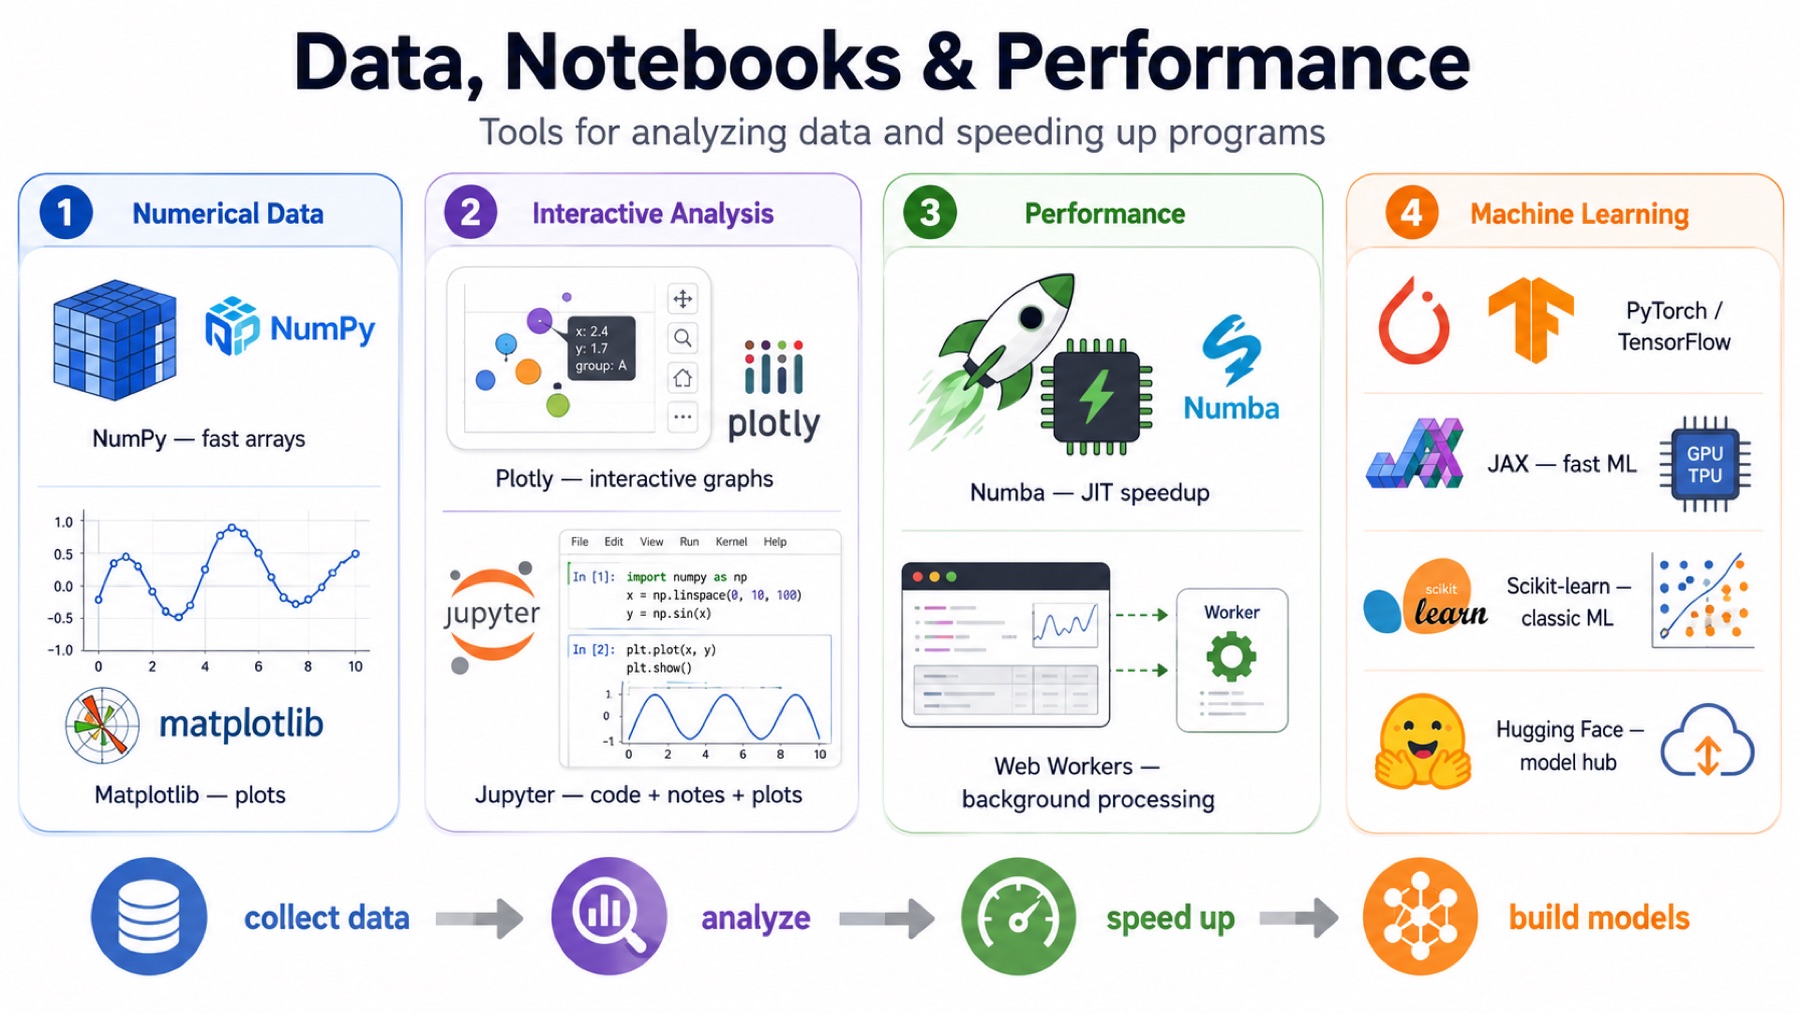
NumPy is the main Python library for numerical arrays. It is much faster than plain Python loops for many math operations because it works on whole arrays at once.
Matplotlib is a Python plotting library. It is used to graph signals, scatter plots, images, histograms, and other data visualizations. Together, NumPy and Matplotlib are a common way to inspect sensor data.
Plotly is another plotting library Neil showed. It has both Python and JavaScript bindings, so it can be used for interactive browser-style plots, not only static Python figures. That matters when the graph itself is part of the interface.
Jupyter notebooks combine code, text, plots, and results in one document. For signal experiments, this is useful because I can collect data, plot it, explain what changed, and keep the result in the same place.
A notebook is not always the final interface, but it can be a strong debugging and documentation interface. Neil is making all his courses pages in this format rather than the raw HTML he currently uses.
Numba is a Python tool that just-in-time compiles certain Python functions into faster machine code. It is useful when a numerical loop is too slow in normal Python but can be compiled into something closer to C speed.
I have used Numba before in computational neuroscience, so this part connected to previous signal-processing work.
Web Workers let JavaScript run work in a separate background thread. The browser UI normally runs on the main thread, so heavy computation can freeze buttons, drawing, or input. A Web Worker can process data while the page stays responsive.
This matters for browser interfaces that need to read hardware, draw graphics, and process incoming data at the same time.
Neil also mentioned PyTorch and TensorFlow as standard machine-learning libraries, and TensorFlow.js as the browser version. Those are for learned models, not just plotting or filtering data. I used those before too!
JAX is a Python numerical computing library used for high-performance machine learning. It supports JIT compilation, vectorization, GPU/TPU acceleration, and automatic differentiation. Neil mentioned that Gemini uses JAX.
Scikit-learn is a Python machine-learning library with ready-made tools for training and evaluating models. Neil showed it as a packaged way to handle common training workflows. My first interaction with ML in Python was through this library.
Hugging Face is a site for sharing trained machine-learning models. It’s a gold-mine tbh.
AI Tools, MCP, And Security
The end of the session moved into AI-assisted coding and security.
Neil mentioned tools like Claude Code, Codex, Copilot, Cursor, and vibe coding. These tools can generate code, explain code, suggest fixes, and help move faster.
As you may have realized, I love those AI tools and they help me learn new things, get things done faster, and explore areas simply not as accessible as now.
I wrote a separate page dedicated to how I have been using AI in Fab Academy.
The warning is that they can also skip details, invent things, introduce subtle bugs, or hide licensing/copyright issues. For me, the useful version is using Codex/Claude Code as a guide while still reading the code, testing it, and understanding the communication path + making it explain things to me.
MCP means Model Context Protocol. At a high level, it is a way for tools, files, apps, and devices to expose context/actions to an AI model. Instead of the model only answering text, it can interact with connected tools through a defined protocol.
An API means Application Programming Interface. It is a defined way for one piece of software to request data or actions from another piece of software. APIs can exist in many forms: browser APIs, library functions, HTTP endpoints, operating-system APIs, or cloud-service APIs.
The distinction is that an API is the general interface/contract between software pieces, while MCP is a specific protocol for connecting AI models to tools and context. MCP can use APIs underneath, but MCP is not the same thing as an API.
I use MCPs all the time with the AI tools, and love experimenting with new ones that come out like the recent Fusion Claude Code MCP.
For cloud deployment, Amazon, Google, and Microsoft all let you rent compute in different forms: a whole server, a preconfigured environment, or just a small program/function.
Cloud servers make it easy to run experiments online, but anything connected to the network has an attack surface.
An attack surface is every place where something outside the system can interact with it: API routes, login pages, open ports, file uploads, dependencies, and device endpoints.
It is better to use known protections that can be inspected and challenged. Dependencies are external libraries that the project relies on.
They save time, but they also bring risk because a bug in a widely used dependency can affect many projects. Heartbleed was the example Neil used: a small bug in a common security library became a major security issue.
The practical fix is to patch dependencies, understand what libraries are included, and use encryption when data moves over a network. Encryption matters because someone listening between the device, server, and app should not be able to read the data in transit.
Building Cool XR Machine Interfaces and a Dashboard for NeuroAR
I had 2 main directions for this week, one that connects back with the machine building week, and another specific to my final project. I want to preface this with an attribution to my good friend Codex with the GPT 5.5 xhigh model xD.
I worked with Codex to build everything below, it is hard to mention one specific prompt that created things since it is more of a full workflow and a series of trial and error until I got there.
I went through the code afterwards, cleaned it up, and contributed to it myself too. Additionally, for the parts that would’ve been impossible without AI, I used Codex to explain those for me, and I explain the majority of my work here!
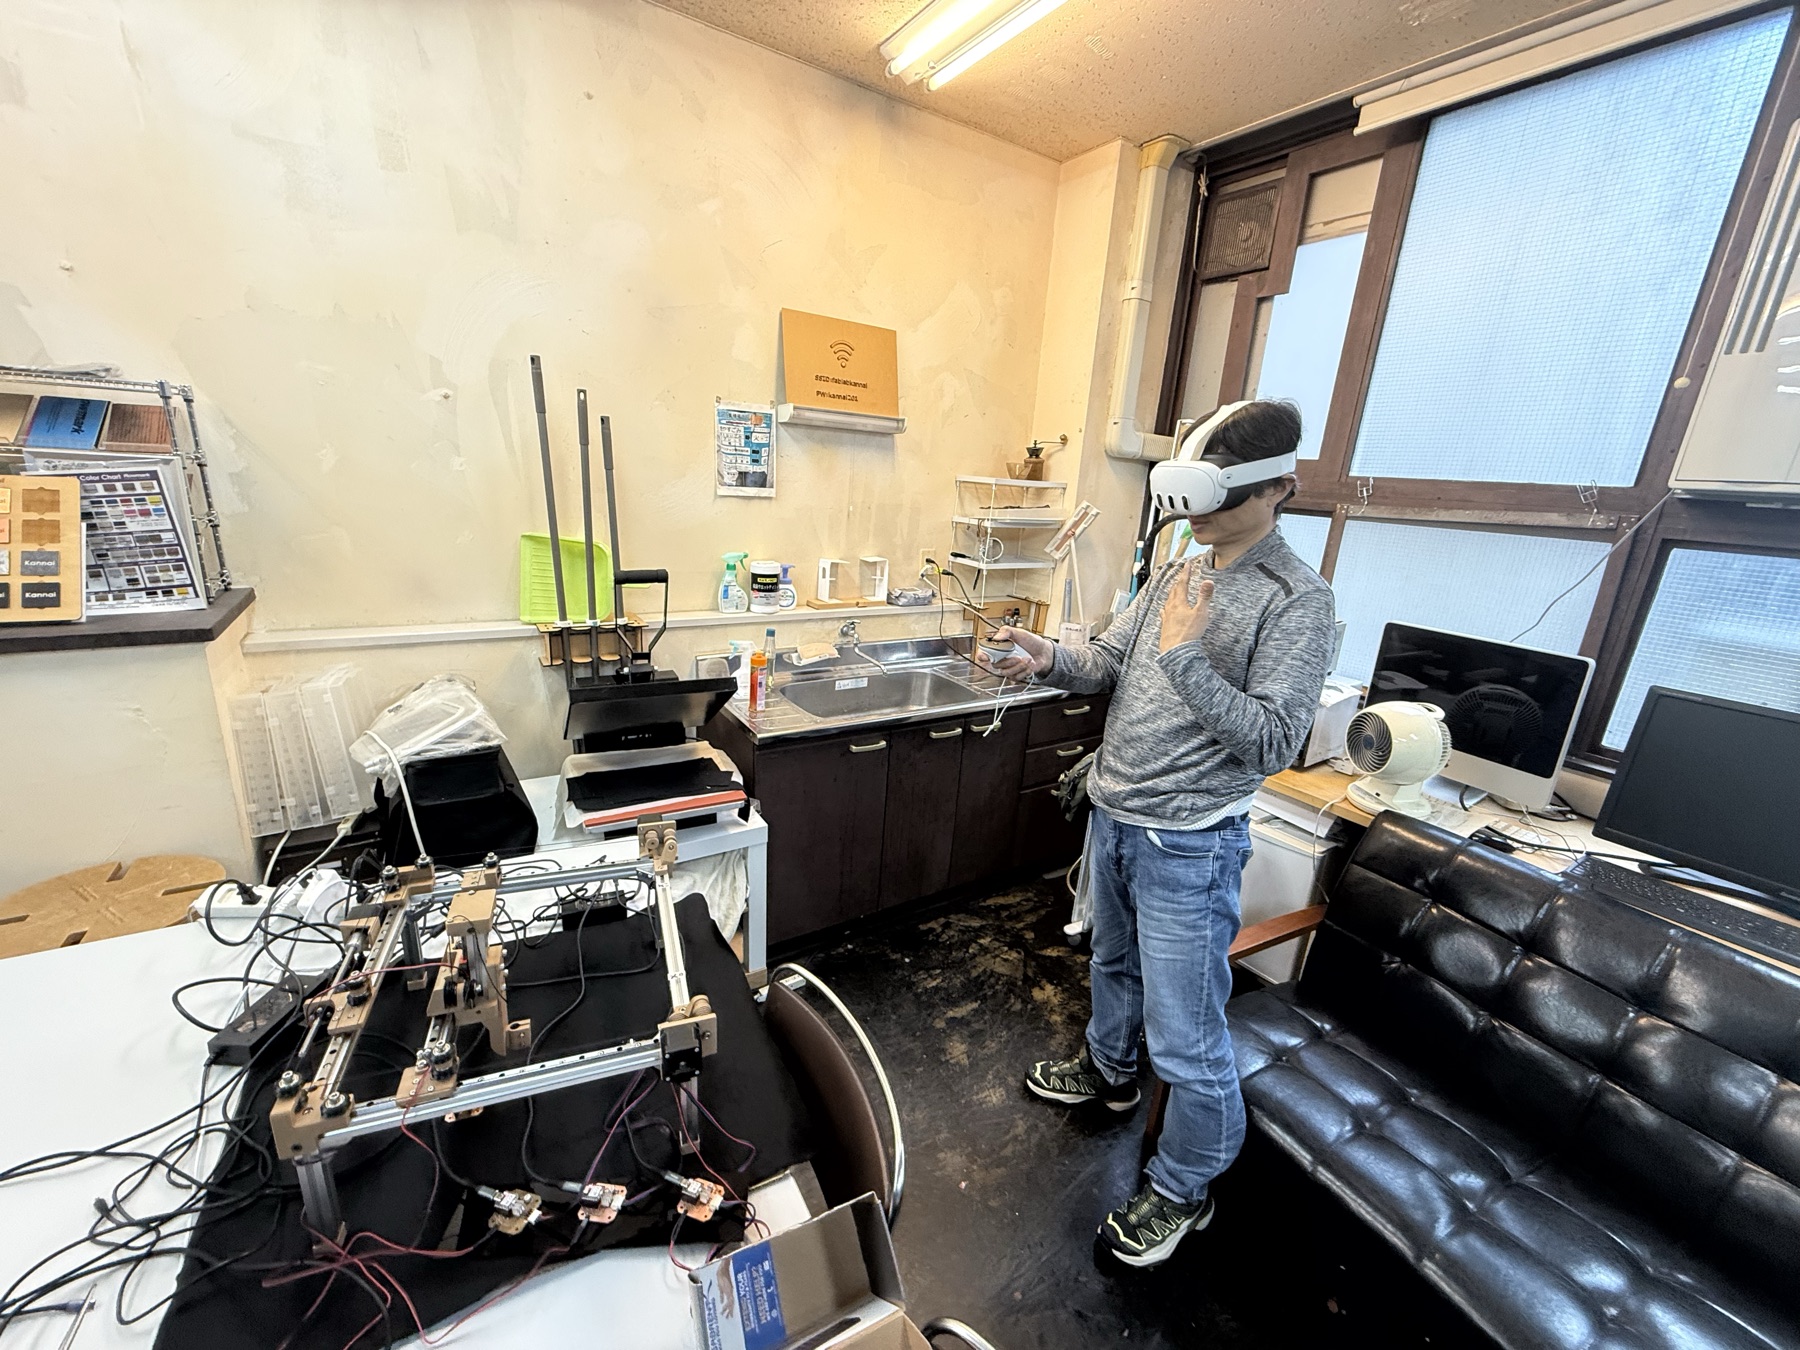
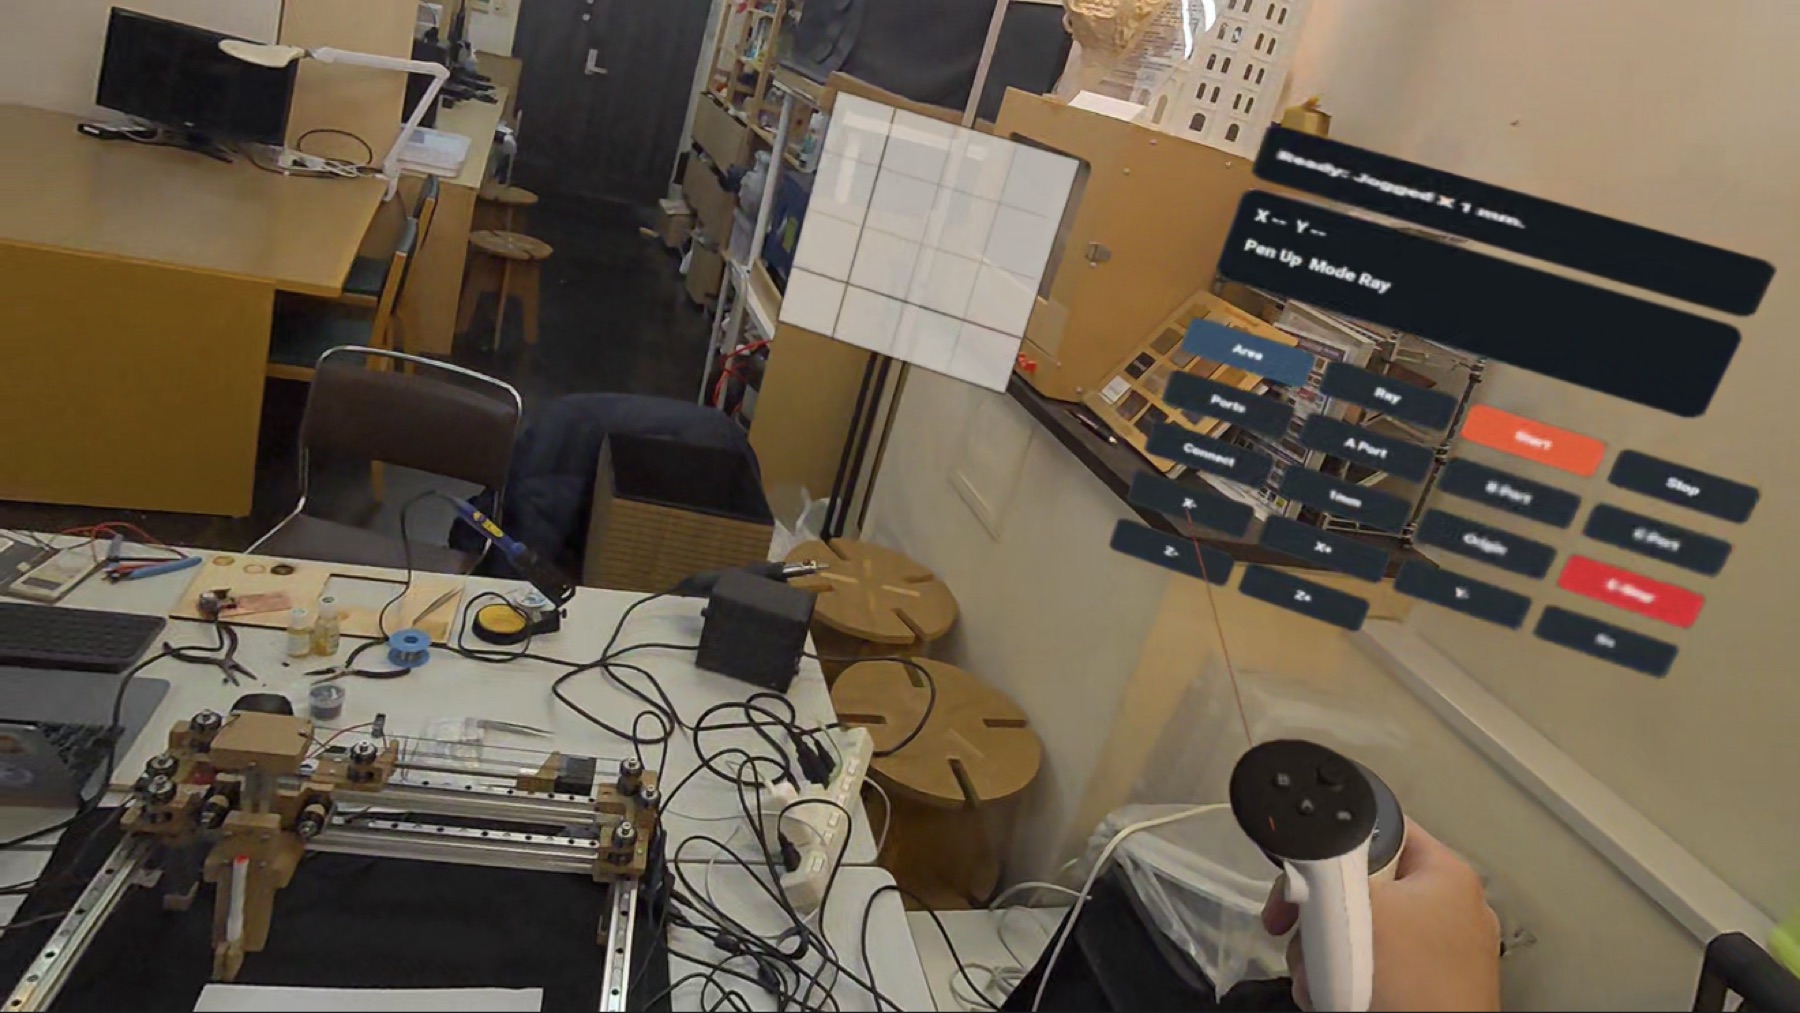
XR Interfaces for the Kanji Drawing Machine
This was my KanjiXYZ interface experiment for Week 15. I already had a physical machine from machine building week that could move in X, Y, and Z and draw from SVG files. The normal dashboard worked, but I wanted to try a different kind of interface after the global session talked about Three.js, WebXR, graphics, and browser interfaces.
I ended up making two related projects because they are actually two different interaction models:
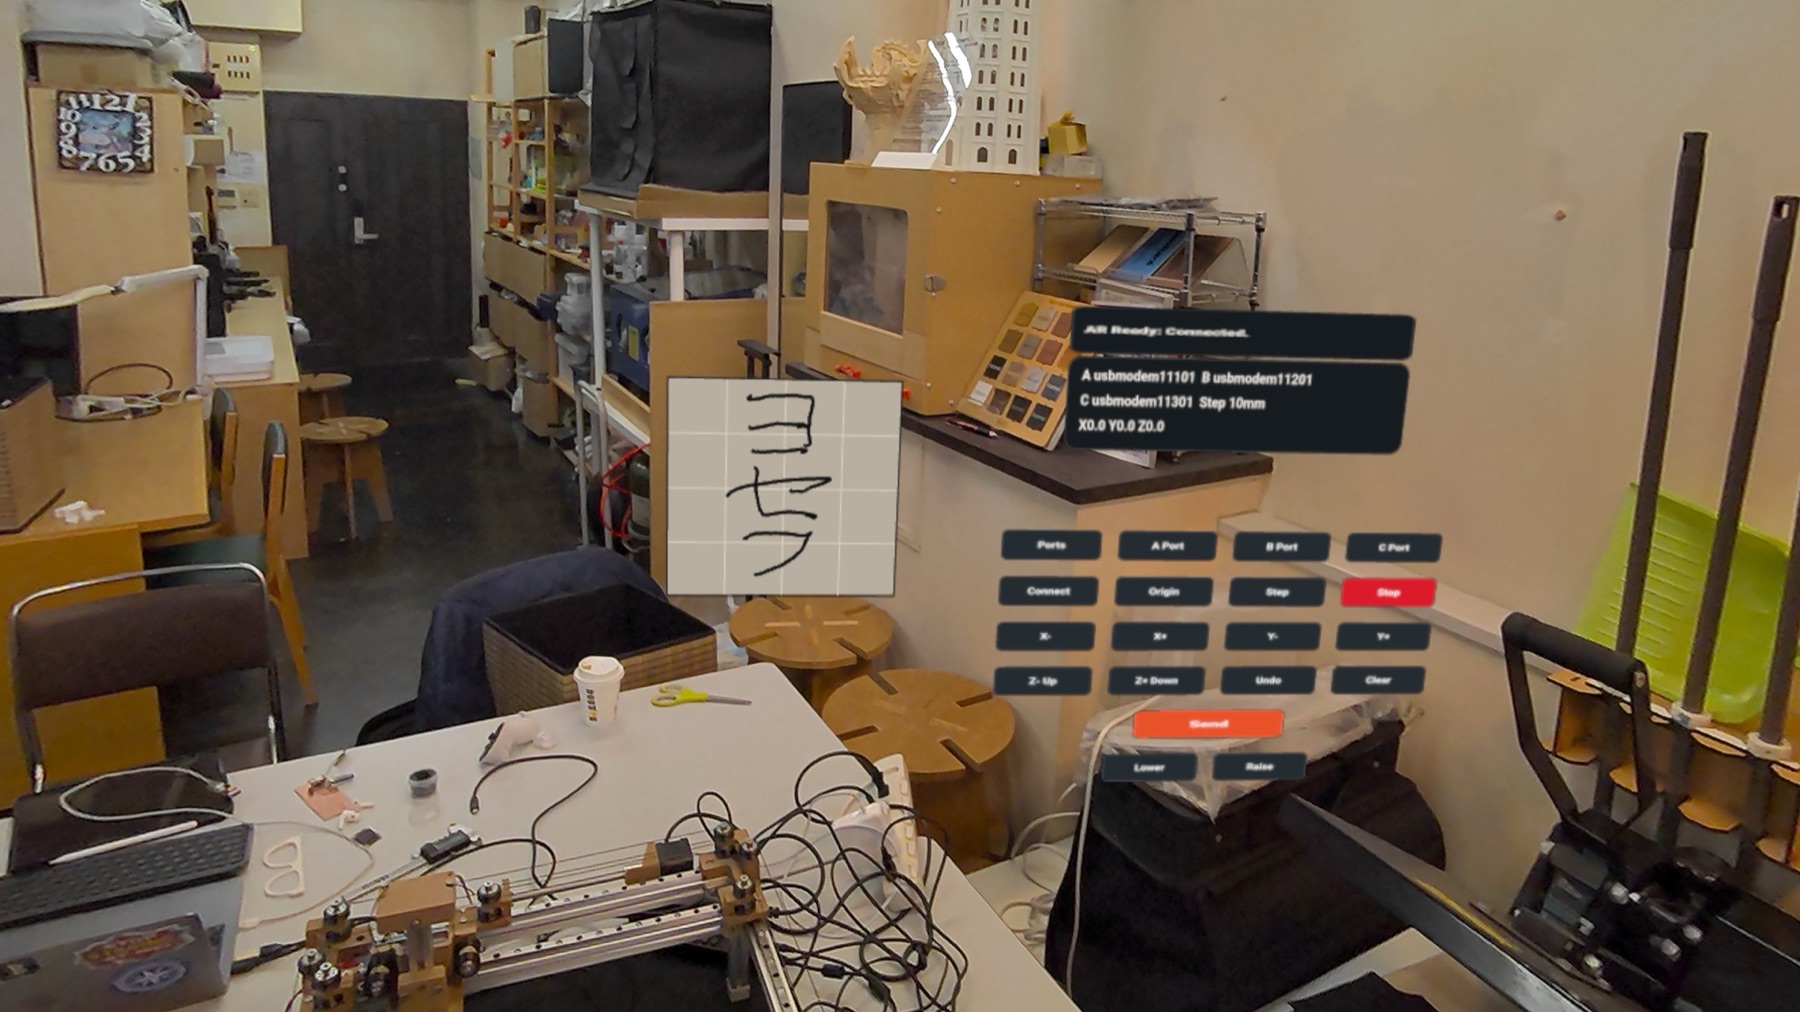
VRKanji: I draw strokes first in VR/AR, preview them as an SVG, validate them, and then send the whole drawing to the machine.ARBrushMachine: I place a 180 mm drawing plane in passthrough AR, move the controller like a brush, and stream the current target position to the machine in real time. This essentially moves the our robotic drawing machine in-real-time.
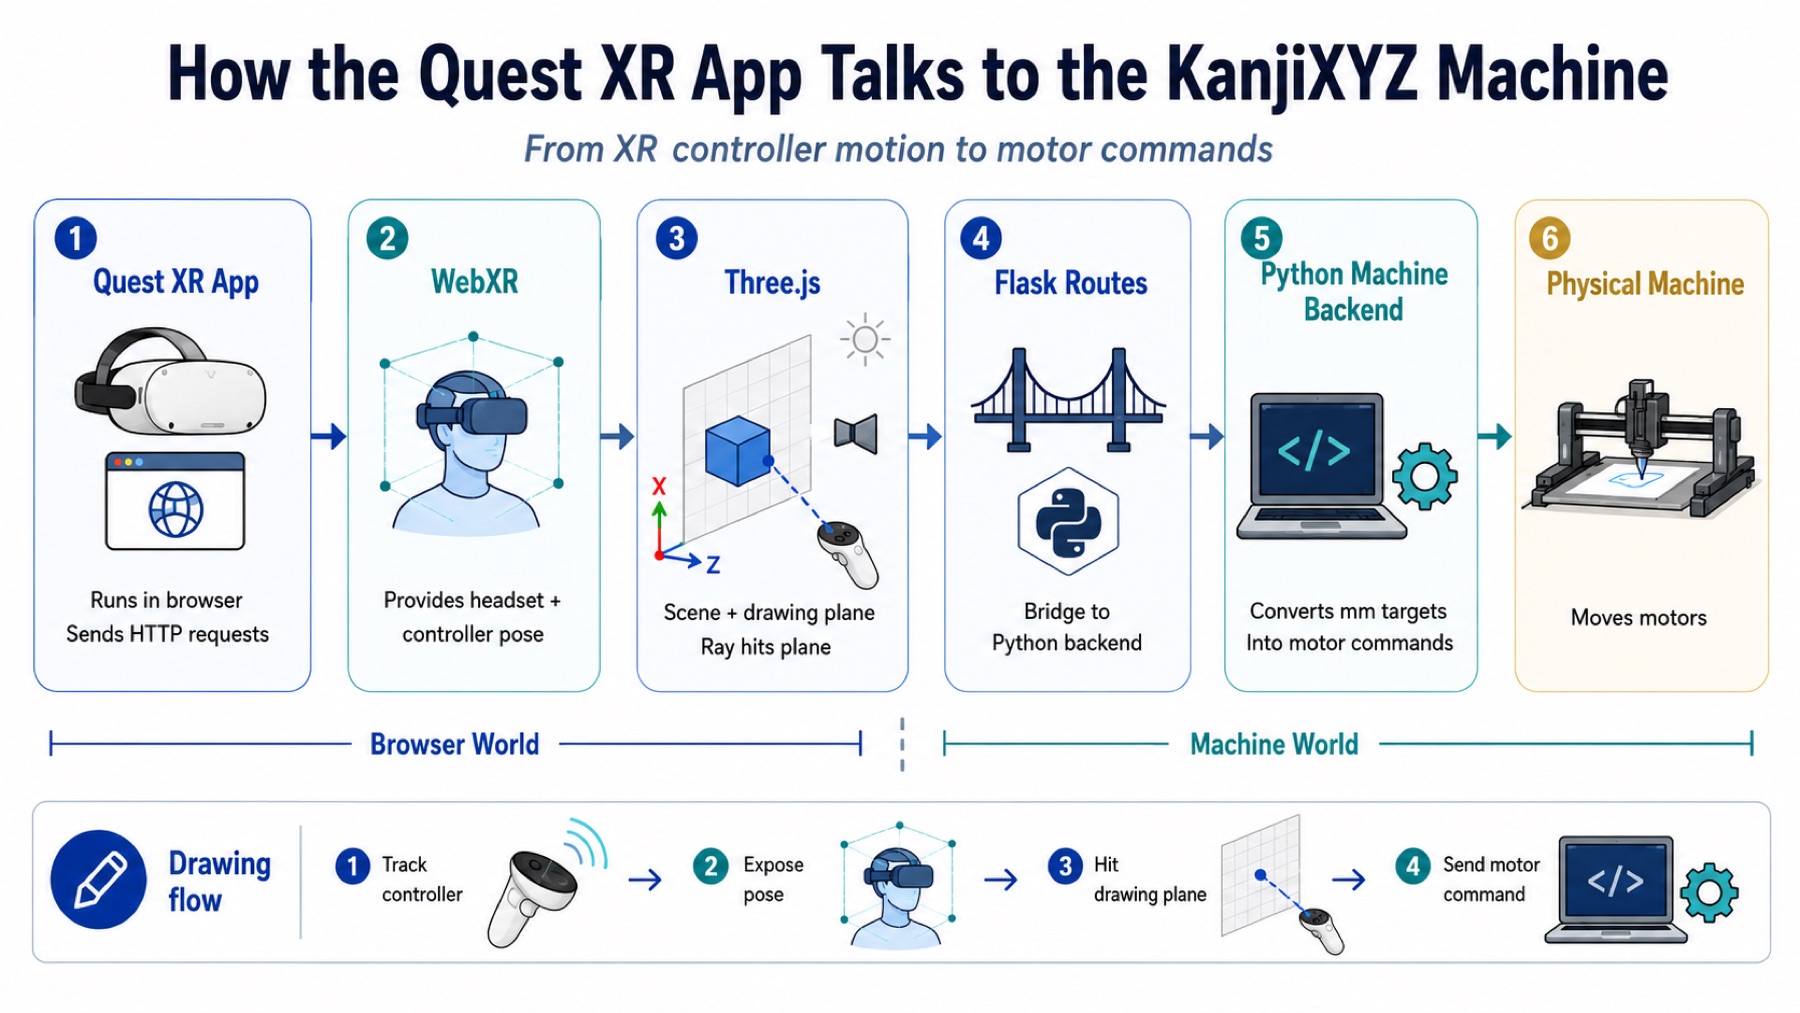
In this section, I am going to explain the projects from the ground up: what the two apps do, how WebXR gets the controller movement, how the data moves from the Quest to Flask, how the coordinates get mapped into the machine workspace, and how the Python backend eventually turns that into motor movement.
The basic data flow for both is:
Quest Browser / WebXR / Three.js
-> JavaScript
-> Flask API
-> CoreXYZMachine
-> serial motor boards
-> physical machine
WebXR gives the browser the headset and controller pose. Three.js lets me build a 3D scene and raycast from the controller into a drawing plane.
JavaScript turns the hit point into machine coordinates. Flask receives those coordinates as JSON.
Then, the Python machine backend sends movement commands to the motor boards over serial.
The basic pieces
Before explaining the code, I think the most useful thing is to separate the jobs of each tool.
Flask is the local web server. It runs on my Mac and has two jobs. First, it serves the webpage that the Quest opens. Second, it exposes API routes like:
POST /api/plot/strokes
POST /api/follow/target
POST /api/connect
POST /api/origin
POST /api/emergency
Those routes are the bridge between the browser world and the machine world. The Quest cannot directly import my Python CoreXYZMachine class. It can only send HTTP requests. Flask receives those requests and calls the Python machine code on my Mac.
Three.js is the graphics layer. I can create a scene, camera, lights, geometry, materials, controller models, and an animation loop.
In this project, the most important Three.js object is the drawing plane. It is a square in the XR scene, and the controller ray intersects with it.
WebXR is the browser API that lets the Quest Browser enter immersive VR or passthrough AR. It gives the app access to the headset pose and controller poses. I do not manually talk to Oculus tracking hardware.
The Quest does the tracking, WebXR exposes the controller transform to the browser, and Three.js gives me a nice way to use that pose in the scene.
The machine backend is the Python side from the KanjiXYZ machine. It knows about serial ports, motor boards, origin state, emergency stop, and kinematics. The XR apps do not directly know how to drive the motors. They send millimeter targets, and the backend converts those targets into motor commands.
The network details that mattered
This part sounds boring, but it is is quite important
When I run Flask on my Mac, I can open:
https://localhost:5443/vr
from the Mac. But inside the Quest Browser, localhost means the Quest itself, not the Mac. So the Quest cannot open the Mac's Flask server using localhost.
When you connect Quest and Mac on the same Wi-Fi/local network, find the Mac's LAN IP address, and open the server like:
https://192.168.1.42:5443/vr
For this to work, Flask also had to bind to all network interfaces:
HOST=0.0.0.0 PORT=5443 python3 server.py
If Flask only binds to 127.0.0.1, then it only listens on the Mac itself. The Quest is another computer on the network, so it needs the server listening on the LAN interface too.
WebXR also needs HTTPS for immersive sessions. That meant the Quest Browser had to open an HTTPS URL and accept the local certificate warning. The certificate was not a public trusted certificate, so the browser complained, but after accepting it the WebXR session could start.
I used separate ports because the two projects are separate Flask apps:
VRKanji:        5443
ARBrushMachine: 5450
Another non-obvious detail was the serial ports. The motor boards sometimes reset or reconnect, so I added a port refresh path in the UI. Also, macOS shows ports that are not the motor boards, like:
/dev/cu.debug-console
/dev/cu.Bluetooth-Incoming-Port
The real motor boards, connected to my Mac through a USB hub, usually show up more like:
/dev/cu.usbmodem11101
/dev/cu.usbmodem11201
/dev/cu.usbmodem11301
So the port helper avoids debug and Bluetooth ports when it auto-suggests motor ports.
The machine connection and origin lived in the Python Flask process.
If I restarted Flask, the Python object was recreated. Physically the machine did not move, but the software forgot which ports were connected and whether origin had been set.
So after restarting the server, I had to reconnect the boards and set origin again.
The coordinate system
Both projects depend on one simple mapping: the virtual drawing plane is the same size as the physical machine drawing workspace.
The machine workspace I set is:
180 mm x 180 mm
The Three.js drawing plane is:
0.18 m x 0.18 m
So the scale is direct:
0.18 m = 180 mm
0.001 m = 1 mm
The local coordinate system of the Three.js canvas has the center at (0, 0). So the local X coordinate goes from about -0.09 meters on the left to +0.09 meters on the right. The machine coordinate system starts at 0 on the left and ends at 180 on the right.
For Y, the browser canvas local Y goes upward, but the drawing machine coordinate convention uses Y going down from the top of the drawing. So Y has to be inverted.
The JavaScript mapping is:
const x = (local.x / CANVAS_M + 0.5) * WORKSPACE_MM;
const y = (0.5 - local.y / CANVAS_M) * WORKSPACE_MM;
In the code:
const WORKSPACE_MM = 180;
const CANVAS_M = 0.18;
The X line does two things. local.x / CANVAS_M converts the local meter position into a fraction of the 0.18 m canvas. Since local X is centered, the value is around -0.5 on the left and +0.5 on the right. Adding 0.5 shifts that into 0..1. Multiplying by 180 turns it into millimeters.
The Y line is similar, but it is inverted. At the top of the canvas, local.y is positive, so the formula makes Y smaller. At the bottom, local.y is negative, so the formula makes Y larger.
Some example values:
local.x = -0.09 m, local.y = +0.09 m -> x = 0 mm,   y = 0 mm
local.x =  0.00 m, local.y =  0.00 m -> x = 90 mm,  y = 90 mm
local.x = +0.09 m, local.y = -0.09 m -> x = 180 mm, y = 180 mm
After mapping, the code clamps coordinates to the valid machine workspace. This is important because the controller ray can hit near the edge, tracking can jitter a little, and I do not want to send a negative coordinate or a coordinate larger than the machine can draw.
Project 1: VRKanji
VRKanji is the draw-first version. The interaction is:
draw stroke in headset
-> store stroke points in millimeters
-> preview drawing as SVG
-> validate and downsample
-> send drawing to machine
-> machine plots the exact points
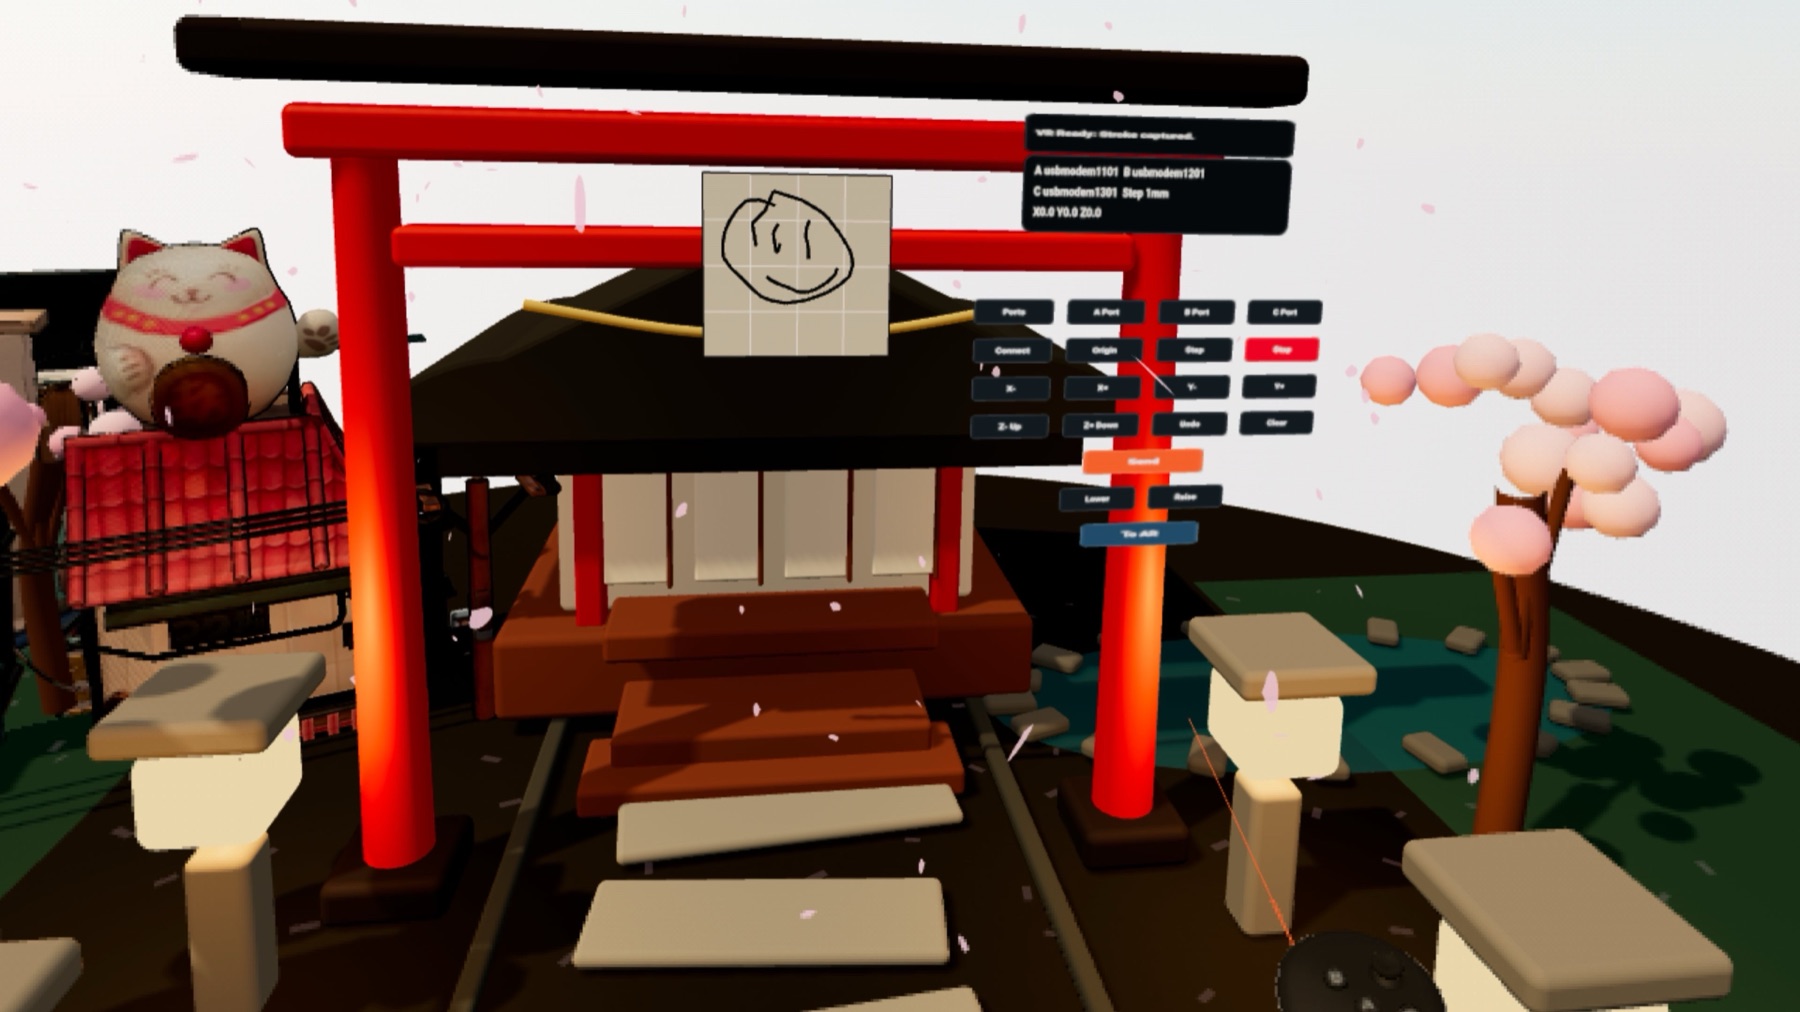
This project can run in full VR or passthrough AR. In full VR, I built a more complete scene with a drawing board and a Japanese environment. In AR, the decorative scene is hidden and the drawing board is placed in front of the real headset view.
Mapping hits in VRKanji
The most important frontend functions are hitToMm() and mmToLocal().
hitToMm() takes a world-space point where the controller ray hit the canvas, converts it into the canvas local coordinate system, and then maps it to machine millimeters:
function hitToMm(worldPoint) {
    const local = canvasGroup.worldToLocal(worldPoint.clone());
    const x = THREE.MathUtils.clamp(
        (local.x / CANVAS_M + 0.5) * WORKSPACE_MM,
        0,
        WORKSPACE_MM,
    );
    const y = THREE.MathUtils.clamp(
        (0.5 - local.y / CANVAS_M) * WORKSPACE_MM,
        0,
        WORKSPACE_MM,
    );
    return [roundMm(x), roundMm(y)];
}
The important line is canvasGroup.worldToLocal(). The controller hit point starts in world coordinates because it exists in the full Three.js scene. But the mapping only makes sense relative to the canvas itself. So first I convert the hit into canvas-local coordinates, then I use the 0.18 m to 180 mm mapping.
mmToLocal() does the reverse. I need this when redrawing saved strokes back into the 3D scene:
function mmToLocal(point) {
    return new THREE.Vector3(
        (point[0] / WORKSPACE_MM - 0.5) * CANVAS_M,
        (0.5 - point[1] / WORKSPACE_MM) * CANVAS_M,
        0.006,
    );
}
Here a machine coordinate like [90, 90] becomes the center of the canvas. A coordinate like [0, 0] becomes the top-left of the plane. The z = 0.006 just lifts the rendered stroke slightly in front of the canvas so it does not z-fight with the canvas surface.
Drawing strokes in JavaScript
The controller input is based on WebXR selectstart and selectend. In Quest controller terms, this is basically the trigger interaction. When the trigger starts, the code checks what the controller ray is pointing at. If it hits a UI button, it runs the button action. If it hits the canvas, it starts a stroke.
The stroke functions are simple:
function startStroke(point) {
    activeStroke = [point];
    activeLine = makeStrokeLine(activeStroke, true);
    strokeGroup.add(activeLine);
    updateStats();
}

function addPoint(point) {
    if (!activeStroke) return;
    const last = activeStroke[activeStroke.length - 1];
    if (distanceMm(last, point) < MIN_POINT_SPACING_MM) return;
    activeStroke.push(point);
    updateLineGeometry(activeLine, activeStroke);
    updateStats();
}

function finishStroke() {
    if (!activeStroke) return;
    if (activeStroke.length >= 2) {
        strokes.push(activeStroke);
    }
    activeStroke = null;
    activeLine = null;
    syncLiveStrokes();
    updateStats();
}
startStroke() creates a new array of millimeter points. addPoint() only adds a point if it is far enough from the last point. The controller can produce dense points while my hand is barely moving.
finishStroke() saves the stroke only if it has at least two points, because one point is not really a drawable line.
I also added mouse drawing on desktop:
pointerdown -> start stroke
pointermove -> add point
pointerup   -> finish stroke
This was useful to test stuff quickly on my computer without having to put the Oculus on.
Sending a finished drawing
When I press Send, the browser posts the strokes to Flask:
async function sendDrawing() {
    if (!strokes.length) {
        setStatus("Nothing to send yet.");
        return;
    }
    const result = await postJson("/api/plot/strokes", {
        strokes,
        z_up: settings.zUp,
        z_down: settings.zDown,
    });
    setStatus(result.ok ? "Plot started." : result.error);
}
The important part is that the browser is not sending pixels or a screenshot. It sends the actual stroke list:
{
  "strokes": [
    [[12.4, 30.1], [13.0, 31.0], [14.2, 32.5]]
  ],
  "z_up": 10,
  "z_down": 60
}
Those numbers are already machine millimeters. This avoids another scaling step later.
Flask routes in VRKanji
The main Flask routes for the drawing are:
@app.post("/api/vr/preview")
def preview_strokes():
    strokes = normalize_strokes(request.json.get("strokes", []))
    return jsonify({
        "ok": True,
        "svg": strokes_to_svg(strokes),
        "strokes": strokes,
    })

@app.post("/api/live/strokes")
def set_live_strokes():
    live_state["strokes"] = normalize_strokes(request.json.get("strokes", []))
    return jsonify({"ok": True})

@app.post("/api/plot/strokes")
def plot_strokes():
    strokes = normalize_strokes(request.json.get("strokes", []))
    job = start_plot(strokes)
    return jsonify({"ok": True, "job": job})
The actual code has more status checks and error handling, but this is the idea. /api/vr/preview is for generating an SVG preview. /api/live/strokes lets the Quest share its current drawing with the computer monitor page. /api/plot/strokes starts the physical plotting job.
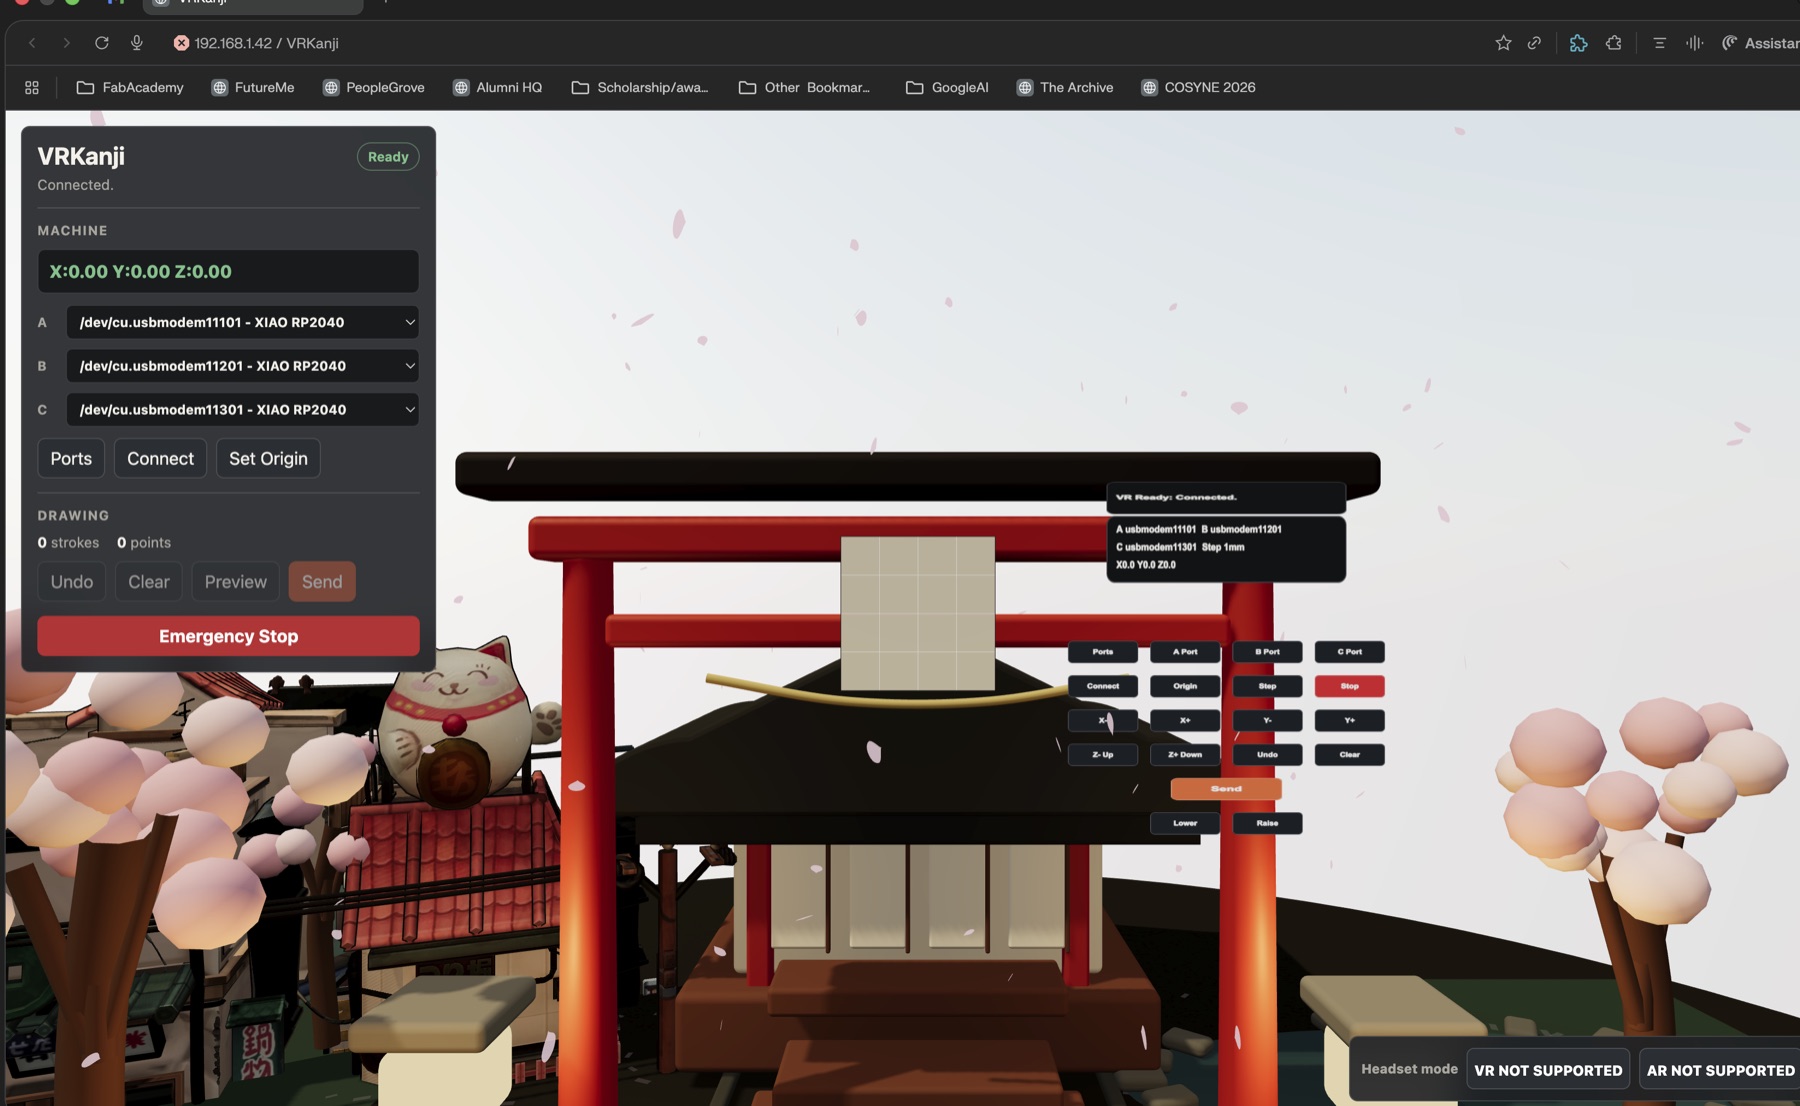
The /monitor page was added because it was hard to know what the headset was sending while I was inside VR.
The computer can mirror the live drawing, show the SVG preview, and expose machine controls.
Stroke validation and SVG preview
The stroke processing lives in strokes.py. The first job is to normalize the incoming JSON into a safe list of points:
def normalize_strokes(payload_strokes, min_spacing_mm=DEFAULT_MIN_SPACING_MM):
    normalized = []
    for payload_stroke in payload_strokes:
        stroke = []
        for payload_point in payload_stroke:
            point = _point_from_payload(payload_point)
            _validate_bounds(point)
            stroke.append(point)
        if len(stroke) >= 2:
            normalized.append(downsample_stroke(stroke, min_spacing_mm))
    if not normalized:
        raise StrokeValidationError("No drawable strokes")
    return normalized
This function protects the machine. It checks that points are valid numbers, checks that they are inside the 180 mm workspace, ignores strokes that are too short, and downsamples dense point streams.
Downsampling is important because the controller can send many points close together:
def downsample_stroke(stroke, min_spacing_mm):
    kept = [stroke[0]]
    for point in stroke[1:]:
        if distance_mm(point, kept[-1]) >= min_spacing_mm:
            kept.append(point)
    if kept[-1] != stroke[-1]:
        kept.append(stroke[-1])
    return kept
This keeps the drawing shape but removes redundant points. The machine does not need to receive 20 tiny points in almost the same place.
For preview, the points become SVG path data:
def stroke_to_path_d(stroke):
    commands = [f"M {stroke[0][0]:.2f} {stroke[0][1]:.2f}"]
    commands.extend(
        f"L {point[0]:.2f} {point[1]:.2f}"
        for point in stroke[1:]
    )
    return " ".join(commands)
The preview SVG uses the same coordinate space as the machine:
viewBox="0 0 180 180"
That means the preview is not just a pretty image. It is showing the same coordinate system that will be plotted physically.
Why the old SVG scaling path was wrong here
At first I tried to reuse the older SVG drawing path from the machine project. That made sense because the machine already knew how to draw SVGs. The problem is that the old SVG path expected to receive arbitrary SVG coordinates and scale them into the machine workspace.
For this XR project, the points were not arbitrary SVG coordinates. The WebXR code was already converting the controller hits into exact 0..180 mm machine coordinates. If I passed those points through another SVG scaler, I would scale something that was already scaled.
So the correct path became:
WebXR hit point
-> machine millimeter point
-> validated stroke array
-> direct CoreXYZ move_absolute calls
The plotting function is intentionally direct:
def plot_strokes_exact(machine, strokes, z_up=10.0, z_down=60.0):
    for stroke in strokes:
        first_x, first_y = stroke[0]
        machine.move_absolute(first_x, first_y, z_up)
        machine.move_absolute(first_x, first_y, z_down)
        for x, y in stroke[1:]:
            machine.move_absolute(x, y, z_down)
        machine.move_absolute(stroke[-1][0], stroke[-1][1], z_up)
This is the physical plotting logic. Move to the first point with the pen up, lower the pen, move through the stroke points, then raise the pen.
In-headset controls
At first the VR view was mostly just a drawing board. That was not enough because if I needed the laptop every time I wanted to connect, jog, set origin, undo, clear, send, or stop, then the headset was only a drawing toy and not the machine interface.
So I added a control panel in the XR scene. The buttons are small Three.js planes with canvas-generated textures. The controller ray can hit them exactly like it hits the drawing surface.
The headset controls include:
Ports
A Port / B Port / C Port
Connect
Origin
Step
X-, X+, Y-, Y+, Z-, Z+
Undo
Clear
Send
Lower / Raise
To AR / To VR
Emergency Stop
Lower and Raise were added because XR reference spaces are a little annoying in practice. I requested local-floor, but depending on how the headset reported the session, the canvas could still feel too high. Manual height controls made the app usable without restarting.
The emergency stop button intentionally blocks normal motion afterward. After emergency stop, I do not want the machine to silently continue because one more request got through.
Project 2: ARBrushMachine
ARBrushMachine is the live-follow version. Instead of storing strokes and plotting them later, the Quest sends target positions continuously:
{
  "x": 92.4,
  "y": 41.2,
  "pen_down": false,
  "tracking": true
}
The browser sends those packets to:
POST /api/follow/target
This project runs on port 5450:
HOST=0.0.0.0 PORT=5450 python3 server.py
and from Quest Browser I opened:
https://<computer-lan-ip>:5450/follow
The biggest difference from VRKanji is timing. In VRKanji, the backend receives a finished drawing. In ARBrushMachine, the backend receives a stream of "the brush should be here now" targets.
Getting the controller target
There are two tracking modes:
Ray mode
Tip mode
Ray mode uses the controller ray intersection with the AR plane. This is the easiest to debug because the visible dot on the plane is exactly the target sent to the machine.
Tip mode uses the controller grip/tip position and projects it onto the plane. This feels more like using the controller as a physical brush, but it depends more on how close the controller is to the plane.
The simplified frontend function is:
function updateControllerTarget(controller) {
    if (trackingMode === "ray") {
        raycaster.setFromXRController(controller);
        const hits = raycaster.intersectObject(canvasMesh, false);
        if (hits.length) {
            const local = canvasGroup.worldToLocal(hits[0].point.clone());
            setTargetFromLocal(local, hits[0].point, controller);
            return;
        }
    }

    const grip = controller.userData.grip;
    const tipWorld = getBrushTipWorldPosition(grip);
    const local = canvasGroup.worldToLocal(tipWorld.clone());
    const projected = canvasGroup.localToWorld(
        new THREE.Vector3(local.x, local.y, 0)
    );
    setTargetFromLocal(local, projected, controller, tipWorld);
}
The idea is the same in both modes: find a point relative to the AR plane, convert it into the plane's local coordinate system, then pass that local point to the mapping function.
I ended up really relying on the “Ray mode,” but the tip mode was a cool to test. Codex made it at the end of the day, so it only cost me some tokens :D
Converting AR plane hits into machine targets
setTargetFromLocal() is the ARBrushMachine version of the coordinate mapping:
function setTargetFromLocal(local, projectedWorld, controller, rawWorld = null) {
    const x = THREE.MathUtils.clamp(
        (local.x / CANVAS_M + 0.5) * WORKSPACE_MM,
        0,
        WORKSPACE_MM,
    );
    const y = THREE.MathUtils.clamp(
        (0.5 - local.y / CANVAS_M) * WORKSPACE_MM,
        0,
        WORKSPACE_MM,
    );

    lastTarget = {
        x: roundMm(x),
        y: roundMm(y),
        valid: true,
    };
}
This is the same math as before. The AR plane is 0.18 m, the machine is 180 mm, X is shifted from centered local coordinates into 0..180, and Y is inverted so the top of the plane is machine Y zero.
The browser does not send every animation frame blindly. It streams at a controlled rate:
function maybeStreamTarget(now) {
    if (!followEnabled || !lastTarget.valid) return;
    if (now - lastStreamAt < 1000 / STREAM_HZ) return;
    lastStreamAt = now;

    postJson("/api/follow/target", {
        x: lastTarget.x,
        y: lastTarget.y,
        pen_down: penDown,
        tracking: true,
    });
}
This avoids flooding Flask with more target packets than the machine can use. The physical machine has inertia and motor limits, so sending more points does not automatically make it better.
The follow target route
The Flask route receives those packets:
@app.post("/api/follow/target")
def follow_target():
    result = follow_controller.update_target(request.get_json(force=True))
    status = 200 if result.get("ok") else 400
    return jsonify(result), status
The route itself is intentionally small. The important logic is in FollowController, because I did not want the machine to move directly inside each HTTP request. HTTP requests can arrive with jitter, and the machine should move with its own controlled timing.
Initially codex suggested otherwise, but I thought this would be a better direction since our machine is also sensitive to very aggressive movements.
FollowController.update_target()
update_target() stores the latest target and validates whether follow is allowed:
def update_target(self, data):
    if not self.enabled:
        return {"ok": False, "error": "follow is not enabled"}

    tracking = bool(data.get("tracking", True))
    if not tracking:
        self._queue_pen(False)
        self.target = None
        return {"ok": True, "tracking": False}

    x = clamp_workspace(float(data["x"]), 0.0, self.workspace_mm)
    y = clamp_workspace(float(data["y"]), 0.0, self.workspace_mm)
    pen_down = bool(data.get("pen_down", False))

    self.target = FollowTarget(x=x, y=y, pen_down=pen_down, t=time.monotonic())
    self.last_payload = data
    self._queue_pen(pen_down)
    return {"ok": True, "target": {"x": x, "y": y}}
The important detail is that update_target() stores the latest target. It does not immediately move the motors. The movement happens in a worker loop.
It also clamps X and Y into the workspace. Even if the frontend has a bug or tracking jitters slightly outside the plane, the backend still protects the physical machine ( I really didn’t want to have to tension the wires in our machine again).
The motion loop
The follow loop runs on the server at a fixed rate. A simplified version is:
def _tick(self, now):
    target = self.target

    if target is None or now - target.t > self.stale_timeout_s:
        self._queue_pen(False)
        self._lift_if_needed()
        return

    dx = target.x - self.current_x
    dy = target.y - self.current_y
    distance = math.hypot(dx, dy)

    if distance < self.deadband_mm:
        return

    max_step = min(
        self.max_step_mm,
        self.speed_mm_s / self.follow_hz,
        distance,
    )

    next_x = self.current_x + dx / distance * max_step
    next_y = self.current_y + dy / distance * max_step
    self.machine.move_absolute(next_x, next_y, self.current_z)
This is the part that makes the real-time control sane. The browser may send targets at around 24 Hz, but the server decides how far the machine is allowed to move each tick. The movement is limited by speed, max step size, and a deadband.
The deadband avoids tiny jitter becoming tiny machine commands. The max step prevents jumps. The stale timeout is a safety feature: if the Quest stops sending target packets, the server lifts the pen instead of continuing forever.
The actual code also handles pen transitions, origin checks, and emergency state. Follow mode refuses to start unless the machine is connected and the origin is set.
Pen down was more than a boolean
One of the more subtle problems was pen down. In the headset, pressing the grip means pen down and releasing it means pen up. That sounds like a boolean, but a quick press/release can happen between two worker ticks.
If I only stored the latest boolean, the follow loop might miss the transition completely.
So I added a pen command queue. The server queues pen transitions and handles them in order.
Another detail is the pen anchor. When pen down starts, the code remembers where the controller was at that moment. The machine first moves to that anchor with the pen up, then lowers the pen. Without this, the controller could move while the Z axis is lowering, and the line would start in the wrong place.
The follow behavior is more like:
move with pen up
go to pen-down anchor
lower Z
wait briefly for contact
draw while following
lift Z when pen is released
lift Z if tracking becomes stale
Machine backend and kinematics
Both XR projects eventually call the same kind of machine command:
machine.move_absolute(x, y, z)
The backend checks that the machine has an origin, clamps movement into the safe travel range, and then calls the kinematics function. The workspace limits are basically:
X: 0..180 mm
Y: 0..180 mm
Z: 0..65 mm
The physical KanjiXYZ machine uses a CoreXY-style arrangement for X/Y, so the two horizontal motors are not simply "X motor" and "Y motor." Both motors combine to make X/Y movement.
This is essentially the same as machine building week and the CoreXYZ machine.
The backend converts XYZ millimeters into motor revolutions like this:
def execute_kinematics(self, x_mm, y_mm, z_mm):
    xy_mm_to_rev = 1.0 / (capstan_dia * math.pi)
    z_mm_to_rev = 1.0 / (z_pitch * z_start)

    x_rev = x_mm * xy_mm_to_rev
    y_rev = -y_mm * xy_mm_to_rev
    z_rev = -z_mm * z_mm_to_rev

    target_a = y_rev + x_rev
    target_b = y_rev - x_rev
    target_c = z_rev
Motor A and motor B together create X/Y movement. If the machine needs to move in X, the two motors move in a combined pattern. If it needs to move in Y, they move in a different combined pattern. Motor C is the Z axis.
The negative signs for Y and Z are there because the machine's physical direction convention is not the same as the positive coordinate convention in the drawing interface.
The interface can say "Y goes down on the page" and the backend can translate that into whatever direction the motor actually needs to rotate.
This is also why I wanted the XR apps to stop at machine millimeters, meaning it just gives the measurements/coordinates and then the machine backend handles the rest.
The browser should not know motor math. The browser knows "the brush target is x=92 mm, y=41 mm." The backend knows how that becomes motor A, B, and C targets.
Debugging notes
A lot of the project was not about writing a fancy scene that was quite easy with Codex. It was about making all the layers agree. I mention some of these above but here is sort of a recap.
The first issue was networking. I needed to make sure I had the correct Wi-Fi, Mac LAN IP, and Flask binding to 0.0.0.0. I initially had the Mac connected to the normal WiFi network and the Quest to the 5g network, so jus twatch out for simillar mistakes.
The second issue was HTTPS. WebXR would not start properly from plain HTTP, so I had to use HTTPS and accept the local certificate warning in Quest Browser.
The third issue was the old SVG scaling path. I originally tried to send XR strokes through the normal SVG scaling system, but XR points were already machine millimeters. Scaling again was wrong.
The fourth issue was dense controller data. The controller can create too many points, so the stroke code validates, downsamples, and limits point counts.
The fifth issue was AR placement. At first passthrough AR showed nothing because the objects were placed like a normal VR scene. In AR, the headset controls the camera pose, so I had to wait for the AR camera pose and place the stage in front of the user.
Then AR had height, orientation, and mirrored-surface problems. The fix was headset-relative yaw (for context, yaw means the side-to-side rotation of an object around its vertical axis) placement and front-facing canvas/UI surfaces.
The sixth issue was machine state. Restarting Flask lost port connection and origin state because those lived inside the Python process. That was not a physical-machine problem, it was software state.
The last safety detail was emergency stop. Emergency stop intentionally blocks motion afterward. That is the safer behavior because clearing an emergency state should be a conscious action.
Testing and cleanup
Codex helped me create those tests. I kept simulation mode because it let me test the APIs without the physical machine connected:
SIMULATE=1 HTTPS=0 python3 -m unittest discover -s tests
For JavaScript syntax I checked:
node --check vrkanji/static/vr.js
node --check arbrushmachine/static/app.js
The tests covered preview generation, invalid strokes, plot rejection before origin, follow rejection before origin, follow movement, speed limiting, stale target lift, fast pen down/up queueing, emergency stop, and emergency reset.
I also prepared a cleaned repo folder:
kanjixyz-xr/
  corexyz/
  vrkanji/
  arbrushmachine/
  tests/
  README.md
  requirements.txt
  .gitignore
The cleaned version does not include .venv, .certs, __pycache__, local certificates, or the long generated-looking process notes.
The useful details from those notes belong in this documentation, while the repo README should be practical and short. A heads-up though, the README was AI-generated.
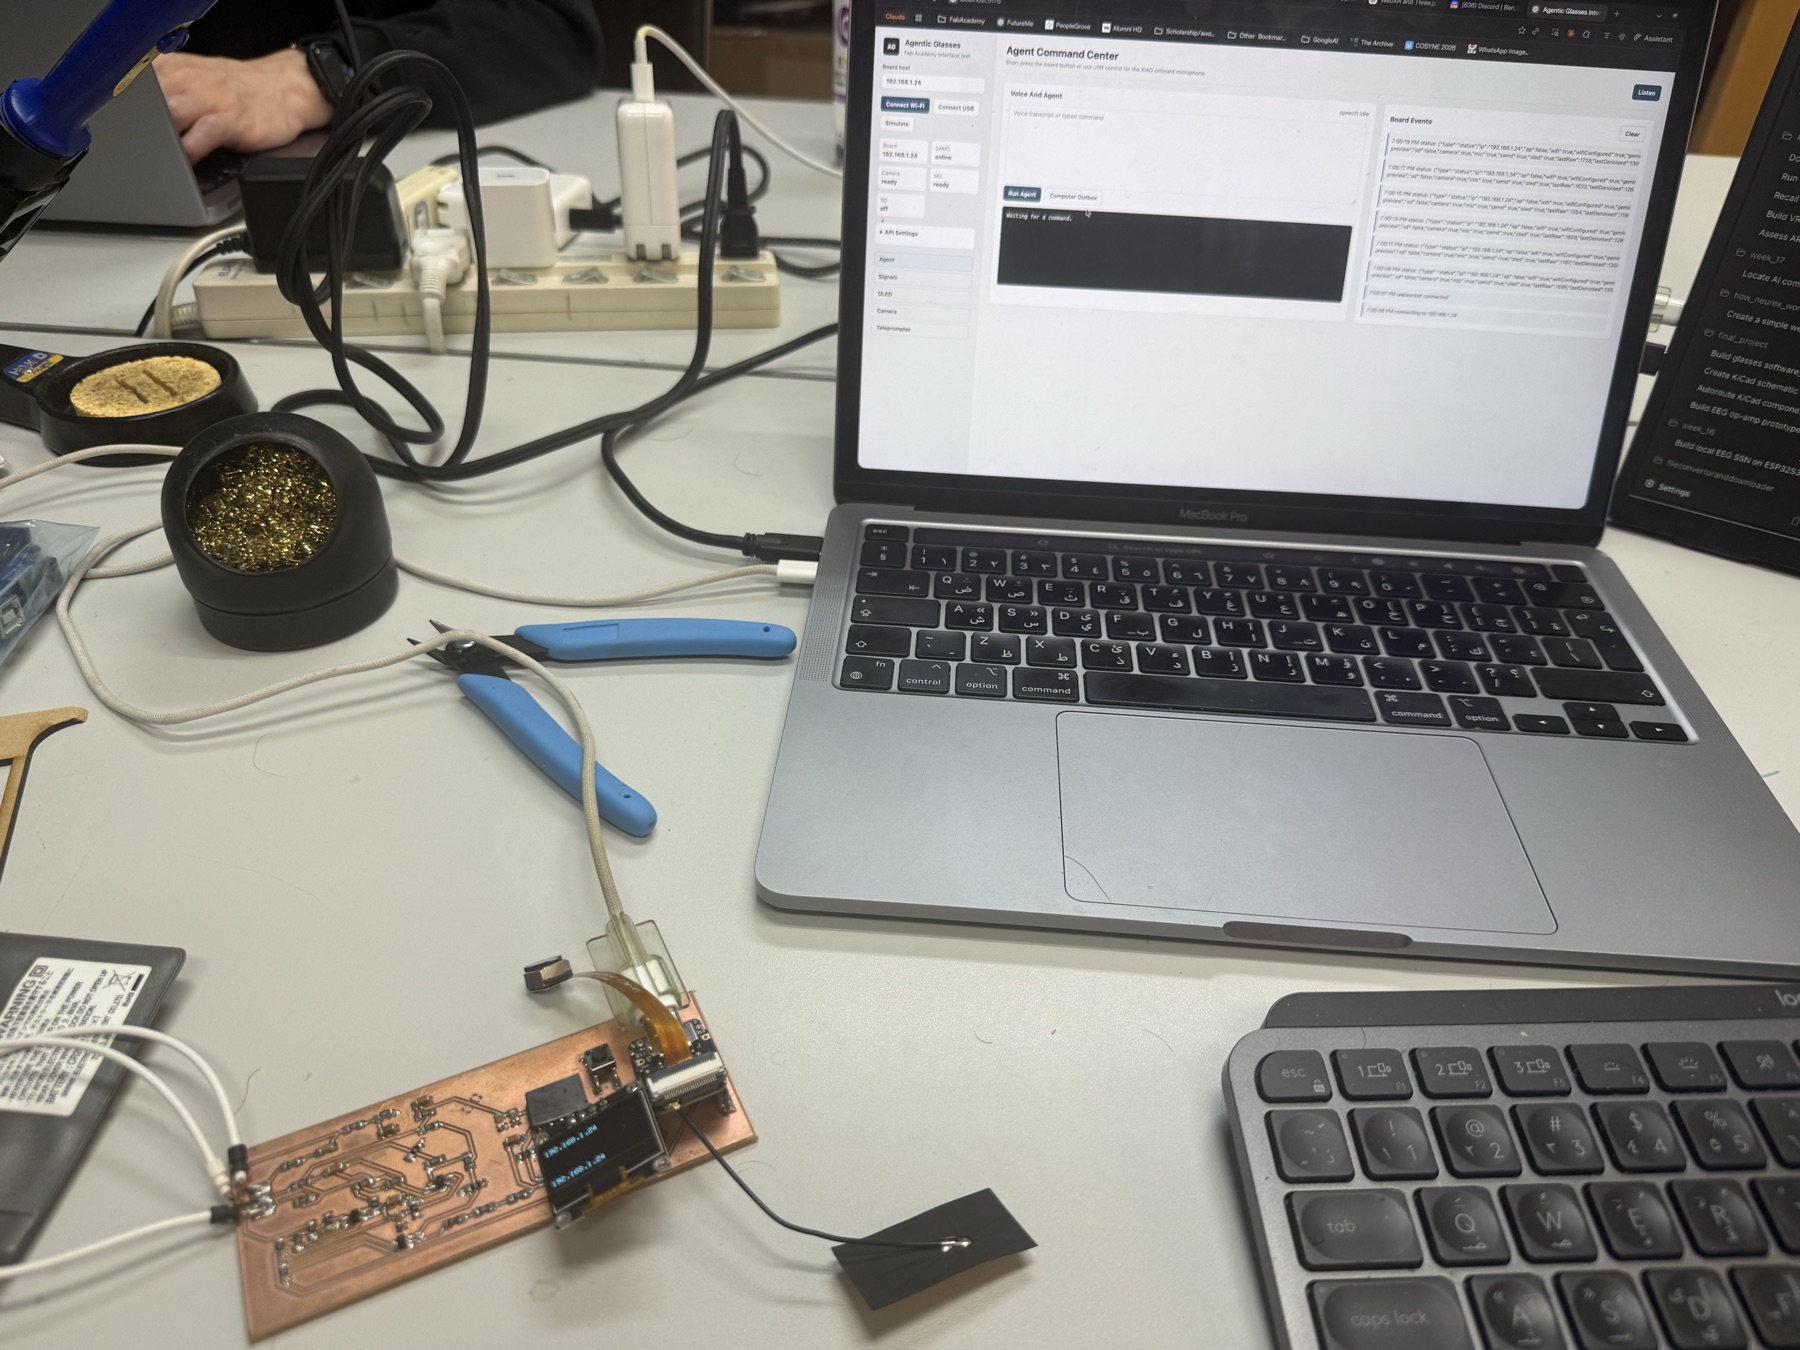
Agentic Glasses Interface
After the XR machine interface, I built the second interface, and it was for my final project (at least a version of it): the agentic glasses interface.
To preface, this is a truly agentic system, but it is a first step towards that.
The goal was to test the glasses as a full interaction loop. A person presses the button, the XIAO ESP32-S3 Sense listens or captures an image, the firmware talks to the peripherals, the dashboard shows what happened, and the OLED gives feedback directly on the wearable side.
The full system is basically:
browser dashboard
-> USB serial or Wi-Fi
-> XIAO ESP32-S3 Sense
-> mic / camera / OLED / SD / SAMD11 EEG-side chip
-> JSON events back to the dashboard
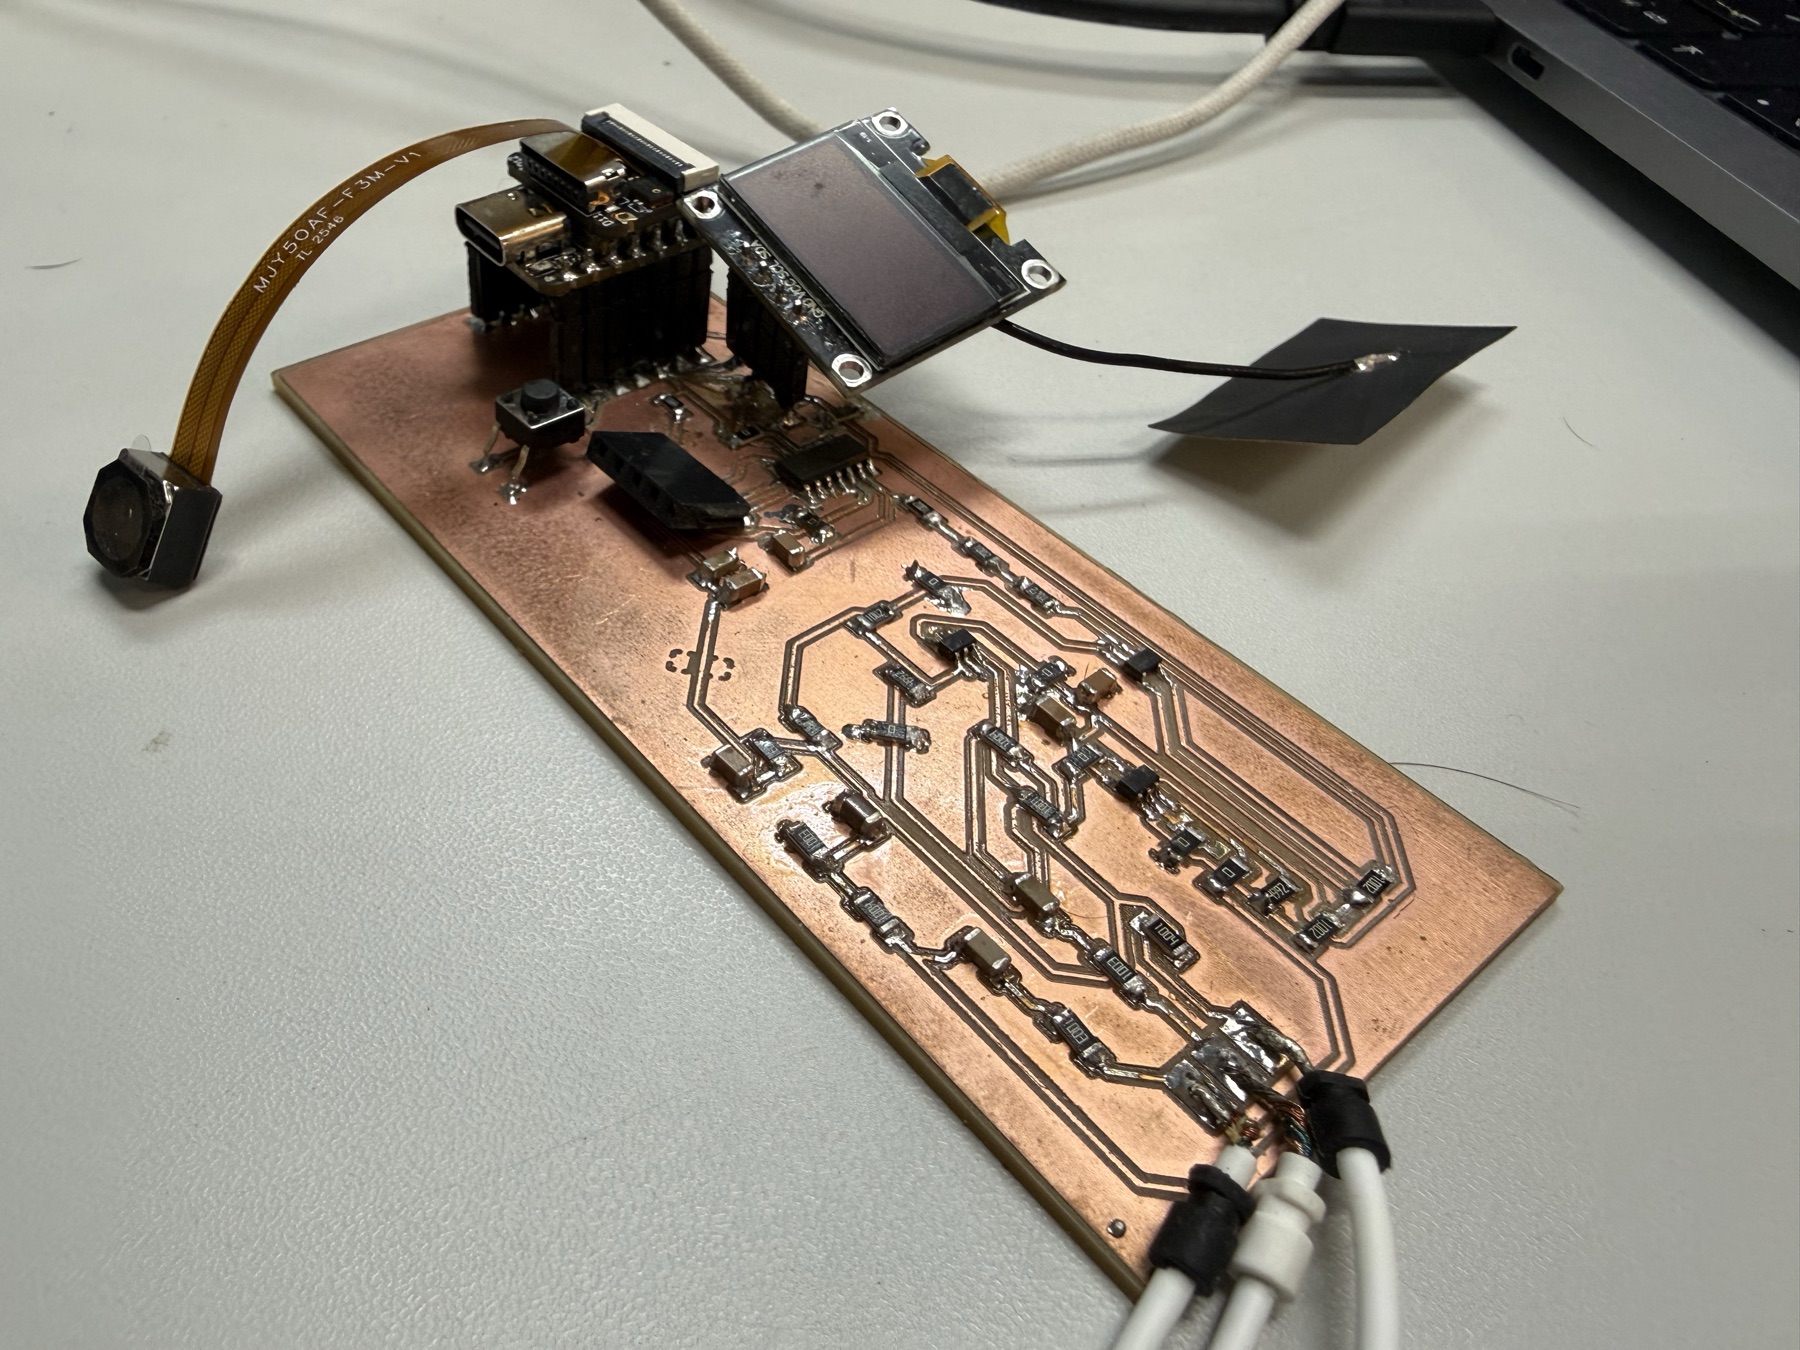
The board’s basic pieces
The hardware stack has two main chips doing different jobs.
The ESP32-S3 on the XIAO ESP32-S3 Sense is the hub. It gives me Wi-Fi, USB serial, the Sense camera, the onboard PDM microphone, SD card access, and enough memory to run a small HTTP/WebSocket interface. It also drives the OLED and acts as the bridge to the EEG side.
The SAMD11 is the second microcontroller chip in this setup. It is part of the first spiral of the EEG hardware I made for the final project (spoiler alert: it wasn’t really good).
How the EEG side works?
The full build of this board is in my final project development log, so I will keep this part focused on what matters for the interface.
The EEG side starts with a very small analog signal from the electrodes. That signal goes through the op-amp/filter side of the board so it can become something the SAMD11 ADC can read as ADC_IN.
The SAMD11 then samples that ADC value and wraps each sample into a small packet with a magic value, sequence number, timestamp, raw value, and flags (I explain those below).
The important part for Week 15 is that the SAMD11 is not drawing the graph and it is not running the dashboard. It is acting like the small signal-sampling chip.
The ESP32-S3 asks it for the newest packet over I2C, then the ESP32-S3 forwards that packet into the browser interface.
I used the dashboard to work with that EEG signal directly. First I made the live packets visible. Then I used the same interface to set a resting baseline, train on clear blinks, and check whether normal blinks were detected from the signal.
The question was: can the SAMD11 side send usable signal data to the ESP32-S3, and can the dashboard help me see, calibrate, train, and test the blink detector live?
The XIAO talks to the SAMD11 over I2C at:
0x10
and the OLED is on:
0x3C
The EEG packet is deliberately small:
struct EegPacket {
  uint16_t magic;
  uint16_t seq;
  uint32_t sampleUs;
  uint16_t raw;
  uint16_t flags;
};
I used the packet fields like this:
magic is a fixed value at the start of the packet. If it does not match what the ESP32-S3 expects, the read is probably broken or misaligned, so the firmware ignores it.
seq is the sample counter. It goes up each time the SAMD11 sends a new sample, so I can tell whether packets are arriving in order or if samples were skipped.
sampleUs is the timestamp from the SAMD11 side in microseconds. It tells me when that sample was taken, which is useful when checking timing and plotting live data.
raw is the ADC reading from the EEG analog circuit. This is the actual number coming from the signal path before the ESP32-S3 baseline/filter/blink logic.
flags is a small status field. I used it as space for extra SAMD11-side state bits without changing the whole packet format later.
These fields are what make the blink test possible: the interface can show the live signal, the firmware can estimate a resting baseline, and then the dashboard can train and test blink detection from the same packet stream.
The Software
The software for this interface has three pieces, and they are not all doing the same job.
The firmware is written in C++ with the Arduino framework for the ESP32-S3. That is the code running on the XIAO. It talks to the pins, Wi-Fi, camera, microphone, OLED, SD card, I2C bus, and Gemini.
The dashboard is browser JavaScript with HTML/CSS. It is not a React app or a big frontend framework. It is mostly DOM elements, button event listeners, fetch(), Web Serial, WebSocket, and a canvas for the EEG trace.
The small local setup server is Node.js JavaScript. It uses Node’s built-in modules instead of Express:
import { createServer } from 'node:http';
import { readFile, writeFile } from 'node:fs/promises';
import path from 'node:path';
The local server is intentionally boring. It serves the dashboard and handles settings. The main route switch looks like this:
const server = createServer(async (req, res) => {
  if (req.url === '/api/settings' && req.method === 'GET') {
    return handleGetSettings(req, res);
  }

  if (req.url === '/api/settings' && req.method === 'POST') {
    return handleSaveSettings(req, res);
  }

  if (req.url === '/api/device-config') {
    return json(res, 200, {
      GEMINI_API_KEY: getSetting('GEMINI_API_KEY'),
      WIFI_SSID: getSetting('WIFI_SSID'),
      WIFI_PASSWORD: getSetting('WIFI_PASSWORD')
    });
  }

  return serveStatic(req, res);
});
The Node side is not controlling the glasses directly. It is mostly the setup layer: save the local settings, hide secrets from the UI, and give the browser a clean config packet to send to the XIAO.
The browser is where the interface logic lives. When I connect over USB, the dashboard opens Web Serial at:
921600 baud
Then it reads board output as lines of text. The important part is that every complete JSON line goes into the same event handler:
async function readSerialLoop() {
  const decoder = new TextDecoderStream();
  serialPort.readable.pipeTo(decoder.writable).catch(() => {});
  serialReader = decoder.readable.getReader();
  let buffer = '';

  while (true) {
    const { value, done } = await serialReader.read();
    if (done) break;
    buffer += value;
    const lines = buffer.split(/\r?\n/);
    buffer = lines.pop() || '';
    for (const line of lines) handleSerialLine(line.trim());
  }
}

function handleSerialLine(line) {
  if (!line.startsWith('{')) return logEvent(`serial: ${line}`);
  handleBoardEvent(JSON.parse(line));
}
That is the core dashboard pattern: serial, WebSocket, and HTTP results all become board events. Then handleBoardEvent() updates the right part of the interface:
if (event.type === 'status') applyStatus(event);
if (event.type === 'eeg') ingestEeg(event);
if (event.type === 'agent_transcript') appendTranscript(event.text);
if (event.type === 'agent_response') {
  els.agentOutput.textContent = event.ok
    ? (event.text || 'Gemini returned no text.')
    : `Gemini error: ${event.error}`;
}
On the firmware side, the ESP32-S3 exposes HTTP routes and also listens for serial commands. The important HTTP routes are:
/status
/config
/frame
/capture
/oled
/eeg
/gemini
and the serial command path includes:
STATUS
CONFIG_JSON
MIC_START
MIC_STOP
OLED_JSON
PROMPT_START
PROMPT_STOP
EEG_BASELINE
EEG_BLINK_TRAIN
EEG_RESET
EEG_PAUSE
EEG_RESUME
This is why the dashboard can work in two modes. USB is best for setup and reliable command/debug text. Wi-Fi is better for camera frames, Gemini requests, and live board status.
The firmware loop() services HTTP, WebSocket, serial commands, the button, Gemini Live, the mic stream, OLED paging, and EEG polling:
void loop() {
  server.handleClient();
  webSocket.loop();
  pollSerialCommands();
  pollButton();
  geminiLiveLoop();

  if (micRecording) {
    readAndSendMicChunk();
  }

  uint32_t nowMs = millis();
  updateOledPaging(nowMs);

  if (nowMs - lastEegPollMs >= EEG_POLL_PERIOD_MS) {
    lastEegPollMs = nowMs;
    pollEeg();
  }
}
Because these tasks run from the same firmware loop, any blocking function can delay camera, mic, OLED, serial, Wi-Fi, or EEG updates. Each path has to return quickly enough for the rest of the interface to keep updating.
Settings and board configuration
The first practical problem was configuration. The board needs Wi-Fi credentials and a Gemini key/model setting, but hard-coding that into firmware would make every small change require a reflash.
The dashboard handles this through a local settings flow. When I save the settings form, saveSettings() sends JSON to the local server:
const body = {
  GEMINI_API_KEY: secretValueOrKeep(els.geminiKey),
  GEMINI_MODEL: els.geminiModel.value.trim(),
  GEMINI_LIVE_MODEL: els.geminiLiveModel.value.trim(),
  WIFI_SSID: els.wifiSsid.value.trim(),
  WIFI_PASSWORD: secretValueOrKeep(els.wifiPassword)
};

await postJson('/api/settings', body);
The secretValueOrKeep() part matters because I did not want an empty password/API-key field to erase a secret that was already saved. On the server side, the same idea is handled with __KEEP__:
for (const key of keys) {
  const value = String(input[key] || '').trim();
  if (value === '__KEEP__') continue;
  next[key] = value;
}

await writeFile(settingsPath, JSON.stringify(savedSettings, null, 2) + '\n', {
  mode: 0o600
});
When I connect through USB, the dashboard opens Web Serial and immediately asks the local server for the device configuration:
GET /api/device-config
Then it sends the result to the XIAO as one serial line:
const payload = {
  geminiApiKey: config.GEMINI_API_KEY || '',
  geminiModel: config.GEMINI_MODEL || 'gemini-3-flash-preview',
  geminiLiveModel: config.GEMINI_LIVE_MODEL || 'gemini-3.1-flash-live-preview',
  wifiSsid: config.WIFI_SSID || '',
  wifiPassword: config.WIFI_PASSWORD || ''
};

await sendSerialLine(`CONFIG_JSON ${JSON.stringify(payload)}`);
On the ESP32-S3 side, the serial parser sees CONFIG_JSON, parses the JSON, and passes it into applyRuntimeConfig():
if (line.startsWith("CONFIG_JSON ")) {
  JsonDocument doc;
  deserializeJson(doc, line.substring(12));
  applyRuntimeConfig(doc, res);
  serializeJson(res, Serial);
  Serial.println();
  return;
}
Then the firmware stores the values in ESP32 NVS using Preferences, so the configuration survives reset:
if (jsonHasString(doc, "wifiSsid")) {
  runtimeWifiSsid = jsonString(doc, "wifiSsid");
  prefs.putString("wifiSsid", runtimeWifiSsid);
}

if (jsonHasString(doc, "geminiApiKey")) {
  runtimeGeminiApiKey = jsonString(doc, "geminiApiKey");
  prefs.putString("geminiKey", runtimeGeminiApiKey);
}
If the Wi-Fi values changed, the firmware reconnects Wi-Fi using the new settings.
After that, I can configure it from the browser once, then the XIAO can boot again with the same Wi-Fi/Gemini configuration instead of depending on hard-coded secrets.
USB Connection:
Wi-Fi Connection:
Microphone and agent flow
The main wearable interaction is the button and microphone path.
The flow can start from the physical button or from the dashboard command:
MIC_START
In the firmware serial parser, that command is very direct:
if (line == "MIC_START") {
  startMicRecording(true, false);
  return;
}

if (line == "MIC_STOP") {
  stopMicRecording();
  return;
}
The firmware also polls the physical button. A short press toggles recording, and a long press is reserved for camera capture. That gave the board a simple interaction model: tap to talk, hold to capture.
When recording starts, the firmware calls startMicRecording() and initializes the onboard PDM microphone. The audio source is the wearable board itself. The dashboard is only the control/display surface.
Inside startMicRecording(), the firmware decides whether it can use Gemini Live directly:
bool useGeminiLive = !micTeleprompterMode &&
                     micDirectGeminiOnStop &&
                     directGeminiReady();

micGeminiLiveSession = useGeminiLive;
if (micGeminiLiveSession && !geminiLiveStartSession()) {
  micRecording = false;
  micGeminiLiveSession = false;
  releaseMic();
  drawStatus("Gemini Live", "connect failed");
  return;
}
Then it broadcasts an audio_begin JSON event so the dashboard knows the board mic is actually running:
doc["type"] = "audio_begin";
doc["sr"] = MIC_SAMPLE_RATE_HZ;
doc["bits"] = 16;
doc["ch"] = 1;
doc["directGemini"] = micDirectGeminiOnStop && directGeminiReady();
doc["liveGemini"] = micGeminiLiveSession;
serializeJson(doc, Serial);
Serial.println();
The ESP32-S3 processes the mic samples before sending them forward. The firmware removes DC offset, applies adaptive gain, uses a light noise gate, soft-limits the signal, and tracks RMS/peak values plus voice activity.
This is embedded audio cleanup, not speech recognition or audio ML. The goal is to make the tiny onboard mic produce a cleaner signal before Gemini receives it.
Codex guided me through this part. Later, I might use ESP-SR MultiNet to transcribe a limited set of custom phrases/commands directly on the XIAO.
When recording stops, stopMicRecording() finalizes the captured speech path. If Wi-Fi and Gemini configuration are available, the board uses Gemini for the agent response flow. The dashboard receives events such as:
agent_status
agent_transcript
agent_response_delta
agent_response
and updates the transcript/output areas. The OLED also shows the state changes, like listening, finalizing, thinking, and then the response. The animations were created by codex.
One problem I ran into here was that the XIAO looked like it was not receiving the full Gemini result. The issue was partly timing.
Gemini Live was still sending transcript chunks, but the firmware could finalize too early and send the REST Gemini prompt before the transcript had really settled.
I fixed that by increasing the transcript settle time to 3000 ms, and changing the finalization logic so it waits for the transcript to settle and the Live turn to complete, or waits for a longer fallback timeout if the turn-complete signal does not arrive cleanly.
This makes the system a bit slow at time, but I have a workaround for this whole thing in the second spiral of my final project.
I also increased the OLED answer cleanup limit from 260 characters to 520 characters. This does not make the OLED unlimited, but it means longer Gemini answers have more room to be paged on the display instead of being shortened too aggressively.
One important cleanup I did that Codex continuously insisted on was stopping the interface from using the laptop’s microphone. For some reason, Codex thought I wouldn’t notice.
Camera flow
The camera path is the long-press path.
A long press in the button polling code calls captureAndBroadcast(false). The dashboard can also ask the board to capture through HTTP:
GET /capture
The board exposes a second camera route:
GET /frame
/capture takes a still image and returns metadata like width, height, byte count, and SD path when SD is available. /frame returns a fresh JPEG for the browser preview.
At first the camera would fail or behave inconsistently, but the route and dashboard code were not the real problem.
The problem was that the microphone I2S/PDM driver could stay active, and that blocked reliable camera capture on the XIAO Sense.
The fix was to treat the mic as a resource that is only active when needed. The firmware initializes the mic for recording, then releases it before camera capture using the mic-release path.
If audio is currently recording, the firmware refuses capture or stops/release the mic first. After that, the camera can grab the JPEG frame normally.
The dashboard tries Wi-Fi first because image data belongs over HTTP, not serial text. The browser-side capture function calls /capture, prints the returned JSON metadata, and then asks /frame for the actual preview image:
async function captureFrame() {
  const result = await fetchJson(boardUrl('/capture'));
  els.cameraOutput.textContent = JSON.stringify(result, null, 2);

  if (result.ok) await drawCameraFrame();
}

async function drawCameraFrame() {
  const image = new Image();
  image.onload = () => {
    const ctx = els.cameraCanvas.getContext('2d');
    ctx.drawImage(image, 0, 0, els.cameraCanvas.width, els.cameraCanvas.height);
  };
  image.src = boardUrl(`/frame?ts=${Date.now()}`);
}
On the firmware side, the HTTP routes connect those browser calls to the camera functions:
server.on("/capture", HTTP_GET, []() { captureAndBroadcast(true); });
server.on("/frame", HTTP_GET, handleFrame);
The actual capture path checks the camera, refuses capture if audio is actively recording, releases the mic driver, gets a frame, optionally saves it to SD, and sends the metadata back:
static void captureAndBroadcast(bool respondToHttp) {
  if (!cameraOk) {
    doc["error"] = "camera_not_ready";
    if (respondToHttp) sendJson(503, doc);
    return;
  }

  if (micRecording) {
    doc["error"] = "camera_busy_recording_audio";
    if (respondToHttp) sendJson(409, doc);
    return;
  }

  releaseMic();
  camera_fb_t *fb = getCameraFrameWithRetry();
  String path = saveFrame(fb);

  doc["ok"] = true;
  doc["bytes"] = fb->len;
  doc["width"] = fb->width;
  doc["height"] = fb->height;
  doc["path"] = path;
}
If /capture fails but USB is connected, the dashboard can still send a serial CAPTURE command. The preview image still comes from /frame, so Wi-Fi is still needed for the actual image preview.
Displaying material on the OLED
The OLED gives feedback on the board itself.
There are two OLED paths: text and bitmap.
For text, the dashboard sends a JSON message:
{"mode":"text","text":"hello"}
Over USB, this becomes:
OLED_JSON {"mode":"text","text":"hello"}
Over Wi-Fi, the same idea goes to:
POST /oled
The firmware parses the JSON and calls drawTextToOled(). The first version split text every 21 characters because that is about what fits across the display. That made words break in the middle and made Gemini responses hard to read.
The fix was to sanitize the text, collapse whitespace, keep printable characters, and wrap by word boundaries. The important function is oledNextWrappedLine(): instead of blindly cutting every 21 characters, it looks backward for a space and breaks the line there when possible.
uint16_t end = min<uint16_t>(start + maxChars, text.length());
uint16_t breakAt = end;

if (end < text.length()) {
  bool foundSpace = false;
  for (int i = end; i > (int)start; i--) {
    if (text[i - 1] == ' ') {
      breakAt = i - 1;
      foundSpace = true;
      break;
    }
  }
  if (!foundSpace) breakAt = end;
}

line = text.substring(start, breakAt);
For Gemini answers, the firmware uses a separate paged display path:
uint8_t total = oledCountPages(clean);
if (total <= 1) {
  drawTextToOled(clean);
  return;
}

oledPagedText = clean;
oledPagedTotal = total;
oledPagedPage = 0;
oledPagingActive = true;
oledNextPageMs = millis() + OLED_ANSWER_PAGE_MS;
So longer text can rotate through pages instead of being crushed into one unreadable screen.
For bitmap output, the browser prepares the image before sending it. The image is drawn into a 128x64 canvas, thresholded into black/white pixels, packed into a one-bit buffer, and base64-encoded. The buffer size is exactly:
128 / 8 * 64 = 1024 bytes
Over serial, the bitmap is chunked:
OLED_B64_BEGIN 128 64
OLED_B64_CHUNK ...
OLED_B64_END
The firmware collects the chunks, decodes the base64, and draws the bitmap on the SSD1306. This supports both normal text feedback and image-style output on the tiny display.
Teleprompter flow
The teleprompter uses the OLED as a wearable script display.
The dashboard starts with a script in a text area. Since the script can be longer than one serial line, the browser encodes the text as UTF-8, converts it to base64, and sends it in chunks:
const bytes = new TextEncoder().encode(script);
const b64 = bytesToBase64(bytes);

await sendSerialLine('PROMPT_B64_BEGIN');
for (let i = 0; i < b64.length; i += 900) {
  await sendSerialLine(`PROMPT_B64_CHUNK ${b64.slice(i, i + 900)}`);
}
await sendSerialLine('PROMPT_B64_END');
On the wire, that becomes:
PROMPT_B64_BEGIN
PROMPT_B64_CHUNK ...
PROMPT_B64_END
The firmware decodes the text, stores it as teleprompterText, counts the words, and resets the current word index. Then the dashboard starts it with:
PROMPT_START
On the board, startTeleprompterMode() starts the mic in teleprompter mode. This is not full local speech-to-text. The ESP32-S3 is not running a local transcription model here.
Instead, it uses voice activity and an estimated speaking rate to move through the words. I developed this sort of “trick” with Codex.
The OLED shows a small moving window of the script, and the dashboard receives teleprompter JSON events with the current progress.
The board can detect speech activity locally, so I used that signal to move the prompt without pretending the ESP32-S3 understands every word.
EEG viewing and blink training
The EEG part has three connected parts: seeing the signal live, setting a baseline, and training/testing blinks.
The SAMD11 side sends compact packets over I2C. The ESP32-S3 reads from address 0x10 using readEegPacket(). The packet includes a magic value, sequence number, timestamp, raw ADC value, and flags:
struct EegPacket {
  uint16_t magic;
  uint16_t seq;
  uint32_t sampleUs;
  uint16_t raw;
  uint16_t flags;
};
pollEeg() runs in the firmware loop. When a valid packet arrives, the ESP32-S3 updates the latest raw value, sequence number, and flags. Then it sends the raw value through processEegSignal().
That function tracks a baseline, centers the signal around that baseline, runs the centered value through notch/low-pass filters, and creates a denoised value.
The dashboard receives the eeg JSON event and passes it into ingestEeg(). The browser stores the newest samples in a rolling buffer, updates the packet text, and redraws the canvas trace with drawEeg().
The visual trace shows whether the signal moves when I blink and whether the detected marker lines up with the physical blink.
The blink-training steps are:
1 Calibrate Baseline
2 Train Blink
3 Test blink detection
The dashboard buttons send these commands:
EEG_BASELINE
EEG_BLINK_TRAIN
EEG_RESET
EEG_PAUSE / EEG_RESUME
They can go over USB serial, or through the /eeg HTTP route when using Wi-Fi.
For baseline calibration, the interface tells me to sit still and avoid blinking. The dashboard sends either EEG_BASELINE over USB or { command: 'baseline' } through /eeg:
if (serialWriter) {
  await sendSerialLine(eegSerialCommands[command] || 'EEG_STATUS');
  return;
}

const result = await postBoard('/eeg', { command });
applyEegStatus(result);
On the firmware side, applyEegCommand() turns that into a baseline calibration window:
} else if (cmd == "baseline" || cmd == "calibrate") {
  startEegBaselineCalibration();
  res["event"] = "baseline_started";
  res["durationMs"] = EEG_BASELINE_CALIBRATE_MS;
}
Then finishEegBaselineCalibration() averages the raw samples into eegBaselineRaw and resets the filters:
eegBaselineRaw = (float)(eegCalibrationRawSum / (double)eegCalibrationCount);
resetEegFilters();
statusDoc["event"] = "baseline_calibrated";
statusDoc["baseline"] = (int)lroundf(eegBaselineRaw);
This gives the detector a resting level instead of assuming that every electrode setup starts at the same ADC value.
For blink training, the dashboard starts a timed window and tells me to blink clearly 3 to 5 times. The firmware runs startBlinkTraining(), watches the filtered signal envelope, and records the largest blink peak plus the average absolute activity during the window.
When the timer ends, finishBlinkTraining() checks whether the peak was large enough compared with the background movement:
const float meanAbs = blinkTrainCount > 0
  ? (float)(blinkTrainAbsSum / (double)blinkTrainCount)
  : 0.0f;

const bool trainedNow = blinkTrainPeak >= BLINK_MIN_AMPLITUDE &&
                        blinkTrainPeak >= meanAbs * 1.8f;
If it was clear enough, the firmware sets a threshold from the trained peak and background movement:
blinkThreshold = max(BLINK_MIN_AMPLITUDE,
  max(meanAbs * BLINK_ENVELOPE_MULTIPLIER, blinkTrainPeak * 0.45f));
blinkTrained = true;
If not, it sends a blink_train_failed event and the dashboard tells me to recalibrate and try again.
After training, the firmware keeps computing a blink score from the filtered envelope. A blink is counted only when the signal rises above the threshold, passes the edge check, and is outside the refractory window. Then the JSON event includes fields like:
blink
blinkScore
blinkThreshold
blinkCount
lastBlinkSeq
The dashboard stores every incoming EEG event as a sample and keeps only the newest 600 points:
const sample = {
  raw,
  denoised,
  filtered,
  baseline,
  blink: Boolean(packet.blink),
  seq: Number(packet.seq) || 0,
  flags: Number(packet.flags) || 0,
  sampleUs,
  t: performance.now()
};

eeg.samples.push(sample);
if (eeg.samples.length > 600) eeg.samples.shift();
Then drawEeg() redraws the canvas trace from those samples. The dashboard uses the blink fields to show Blink detected, increase the count, and draw a marker on the plot.
In my hardware setup, the EEG signal was not amplified enough leading to pretty unreliable signals, so a big portion of the visible fluctuations were noise instead of clear signal changes.
Since the detection was based on the signal crossing a threshold, I also tried the same logic with EMG from my wrist. It worked somewhat for hard clenches, but it was not reliable.
Starting this, I didn't expect a great result with my DIY EEG board because the world is still governed by physics, especially the noise that'd be added from the surroundings, lol. It was a really good experience for me to connect all the different aspects of the glasses together through one dashboard and get to experiment with the EEG signals.
For the glasses, since this DIY board's EEG was unreliable, I ordered a dedicated chip called the ADS1292, which is an Analog-to-Digital Converter (ADC) with a built-in Programmable Gain Amplifier (PGA) designed for biopotentials, especially ECG, but with the right circuit, it works for EEG. Its counterpart the ADS1299 that's designed for EEG is unmillable, and for the purposes of the project at this stage, it isn't really needed.
You can view the development in the following locations:
Original Code
This week's checklist
- Linked to the group assignment page.
- Documented your process.
- Explained the UI that you made and how you did it.
- Explained how your application communicates with your embedded microcontroller board.
- Explained any problems you encountered and how you fixed them.
- Included original source code (or a screenshot of the app code if that's not possible).
- Included a ‘hero shot’ of your application running & communicating with your board.