Week 13. Interface and application programming
Assignment
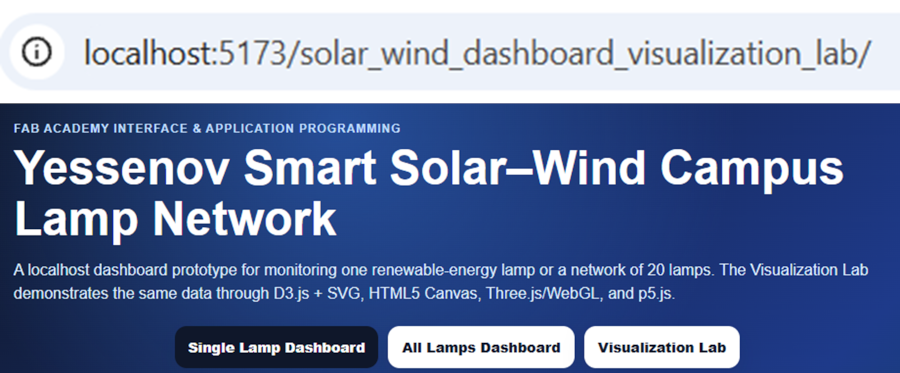
For this week, I practiced interface and application programming by creating a browser-based dashboard for my final project idea: an autonomous catamaran powered by solar and wind energy.
The main goal was to understand how data from an input/output device can be shown to a user through an application interface. In my current version, I used simulated data, but the structure is prepared so that later I can replace the simulated values with real data from a microcontroller such as ESP32, ESP8266, Arduino, or another board.
I wanted to explore not only one interface method, but several different ways of visualizing the same energy data. Therefore, I practiced four browser-based visualization approaches:
  1. D3.js + SVG
  2. HTML5 Canvas
  3. Three.js / WebGL
  4. p5.js
I also created a second version using:
Express.js + Socket.IO
This helped me move from a browser-only visualization to a real-time server-to-browser communication structure.
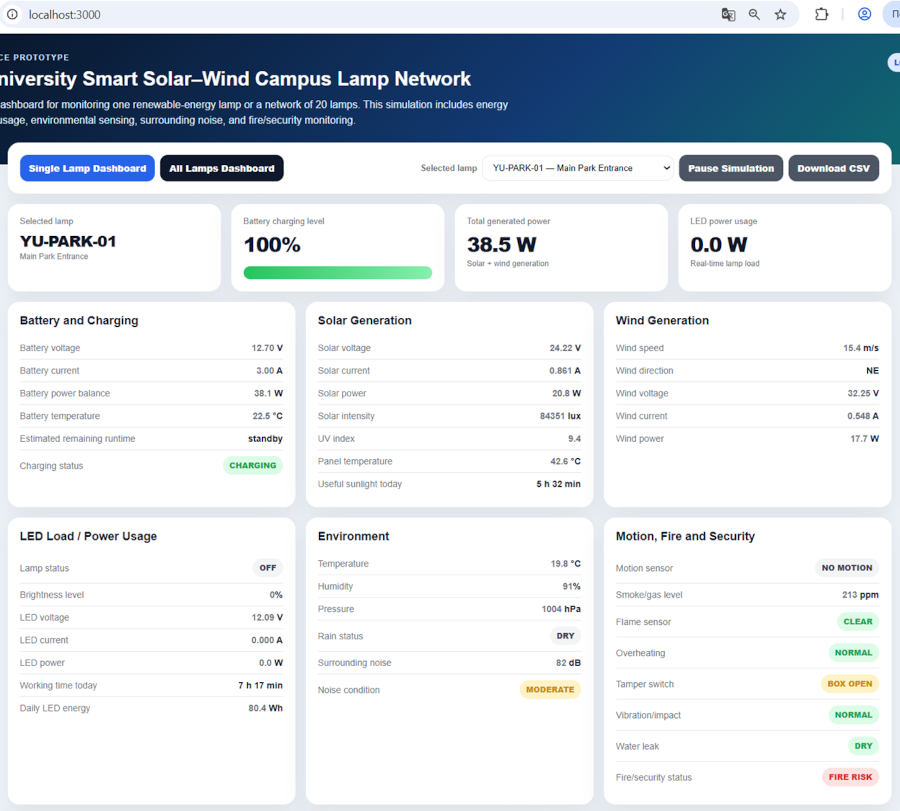
My final project is related to a solar and wind powered catamaran. Such a system needs an interface to show the user important data, such as:
  solar voltage
  charging current
  generated power
  light level
  wind turbine speed
  battery level
  charging status
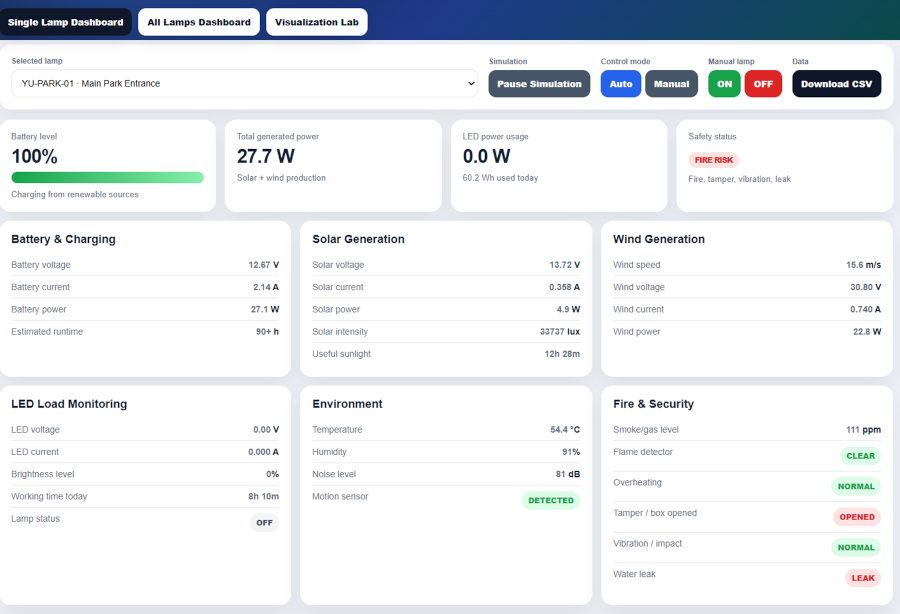
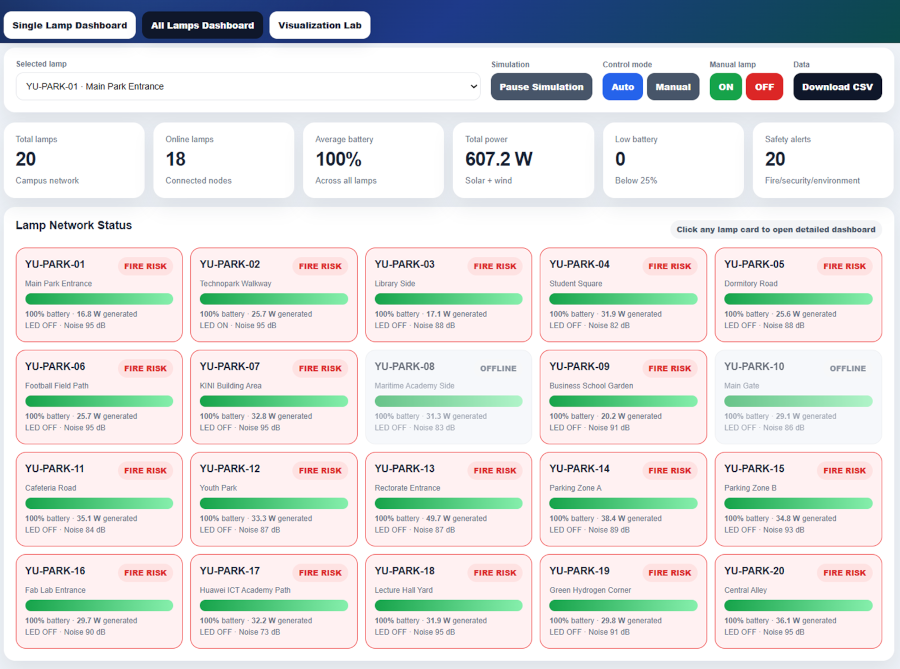
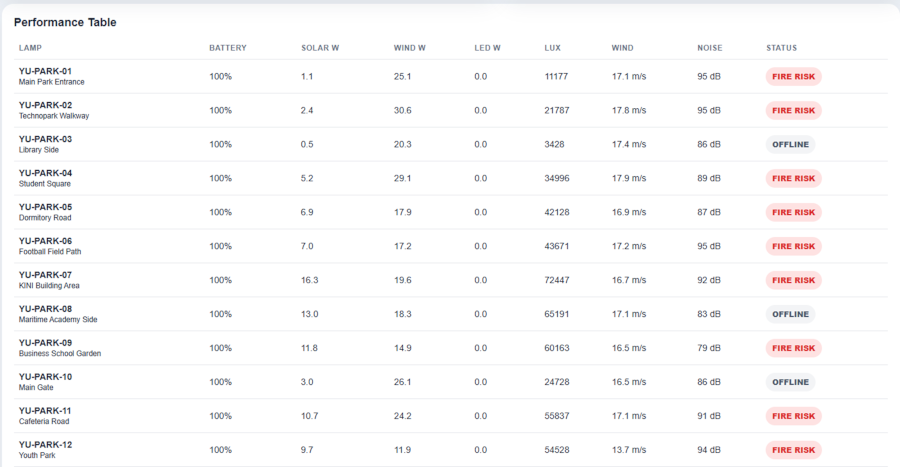
For this assignment, I created a dashboard that simulates these values and shows them through different visualization methods.
The current version is not yet connected to the real physical boat. However, it is a useful interface prototype. Later, the same interface can receive real data from sensors through Serial, Web Serial, MQTT, or Socket.IO.
System logic
The full logic of the interface is:
  Simulated energy data
          ↓
  JavaScript state object
          ↓
  Dashboard values
          ↓
  D3.js chart
          ↓
  Canvas animation
          ↓
  Three.js 3D model
          ↓
  p5.js creative visualization
For the Express + Socket.IO version, the logic becomes:
  server.js generates data
          ↓
  Socket.IO sends data every second
          ↓
  browser receives "energy-data"
          ↓
  script.js updates the dashboard
          ↓
  D3.js + Canvas + Three.js + p5.js update visually
With hardware version will be:
  ESP32 / ESP8266 / Arduino
          ↓ USB Serial
  Node.js SerialPort
          ↓
  Express + Socket.IO
          ↓
  Browser dashboard
          ↓
  D3.js / Canvas / Three.js / p5.js
Dashboard structure
I created two versions of the dashboard data connection.
1. Static localhost version
This version runs with Python local server:
C:\Fab 2026_Assignment\Interface and Application Programming_localhost
It contains:
  Interface and Application Programming_localhost/
  ├── index.html
  ├── style.css
  ├── script.js
  ├── sketch.js
  └── index.js
I started it with:
python -m http.server 5173 --directory "C:\Fab 2026_Assignment\Interface and Application Programming_localhost"
Then I opened:
http://localhost:5173/
2. Express + Socket.IO version
This version runs with Node.js:
C:\Fab 2026_Assignment\Interface and Application Programming_Express_Socket.IO
The structure is:
  Interface and Application Programming_Express_Socket.IO/
  ├── server.js
  ├── package.json
  ├── package-lock.json
  ├── node_modules/
  └── public/
      ├── index.html
      ├── style.css
      ├── script.js
      ├── sketch.js
      └── index.js
I started it with:
cd "C:\Fab 2026_Assignment\Interface and Application Programming_Express_Socket.IO" node server.js
Then I opened:
http://localhost:3000/
Main dashboard structure
The index.html file creates the structure of the dashboard. It includes sections for the main sensor values and for four different visualization approaches.
  <section class="metrics-grid">
    <article class="metric-card">
      <span class="metric-label">Solar voltage</span>
      <strong id="voltageValue">0.00 V</strong>
      <small>Simulated panel voltage</small>
    </article>

    <article class="metric-card">
      <span class="metric-label">Current</span>
      <strong id="currentValue">0.00 A</strong>
      <small>Charging current</small>
    </article>

    <article class="metric-card">
      <span class="metric-label">Power</span>
      <strong id="powerValue">0.00 W</strong>
      <small>Voltage × current</small>
    </article>

    <article class="metric-card">
      <span class="metric-label">Light level</span>
      <strong id="lightValue">0</strong>
      <small>Solar intensity</small>
    </article>

    <article class="metric-card">
      <span class="metric-label">Wind speed</span>
      <strong id="windValue">0 rpm</strong>
      <small>Turbine rotation</small>
    </article>

    <article class="metric-card">
      <span class="metric-label">Battery</span>
      <strong id="batteryValue">0%</strong>
      <small id="chargingStatus">Waiting for data</small>
    </article>
  </section>
For the visualization sections, I created separate containers:
    <div id="d3Chart" class="chart-box"></div>

    <canvas id="energyCanvas" width="640" height="420"></canvas>

    <div id="threeContainer" class="three-box"></div>

    <div id="p5Container" class="p5-box"></div>
This helped me keep each visualization method separate and easier to understand.
Data structure
I used one shared JavaScript state object to store the simulated energy values:
    const state = {
      time: 0,
      voltage: 0,
      current: 0,
      power: 0,
      light: 0,
      windRpm: 0,
      battery: 52,
      chargingStatus: "Starting"
    };

    const history = [];
    const maxHistory = 50;

    window.energyState = state;
    window.energyHistory = history;
This object works like the central data source for the whole dashboard. The dashboard values, D3 chart, Canvas animation, Three.js model, and p5.js sketch all use the same data.
Simulating energy data
Before connecting real sensors, I generated simulated solar and wind data. This allowed me to test the interface without hardware.
  function updateSimulatedData() {
    state.time += 1;

    const lightWave = Math.sin(state.time * 0.18);
    const windWave = Math.cos(state.time * 0.13);

    state.light = Math.round(clamp(620 + lightWave * 230 + Math.random() * 50, 150, 950));
    state.windRpm = Math.round(clamp(260 + windWave * 130 + Math.random() * 70, 60, 560));

    state.voltage = clamp(2.4 + state.light / 310 + Math.random() * 0.15, 2.5, 5.4);
    state.current = clamp(0.08 + state.windRpm / 1600 + state.light / 4200, 0.05, 0.85);
    state.power = state.voltage * state.current;

    if (state.power > 1.6) {
      state.battery += 0.35;
      state.chargingStatus = "Good charging";
    } else if (state.power > 0.9) {
      state.battery += 0.12;
      state.chargingStatus = "Weak charging";
    } else {
      state.battery -= 0.08;
      state.chargingStatus = "Not charging";
    }

    state.battery = clamp(state.battery, 5, 100);
  }
This JS code creates values that behave like a simple renewable energy system. Stronger light increases voltage, wind affects current, and power affects the battery level.
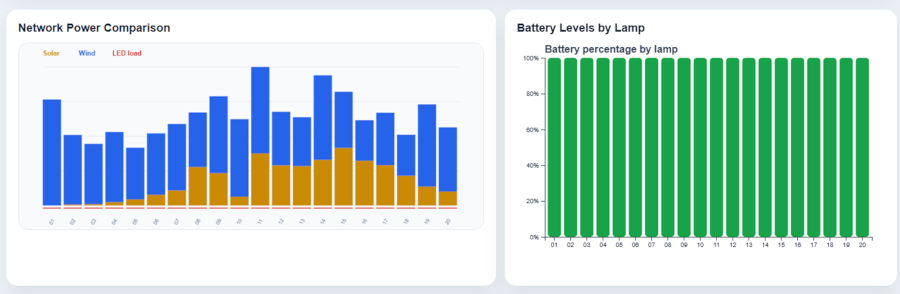
Approach 1: D3.js + SVG
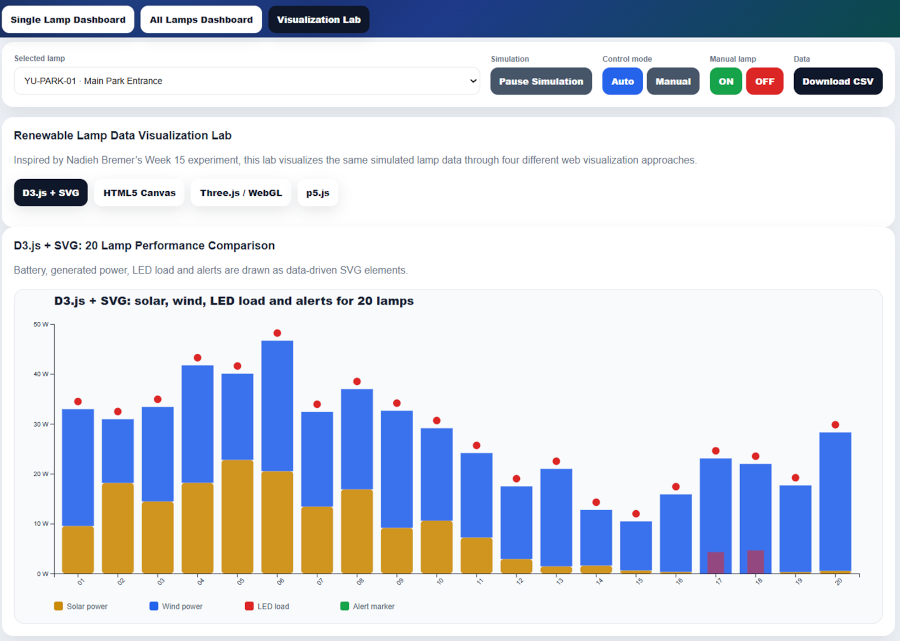
The first visualization method I practiced was D3.js with SVG.
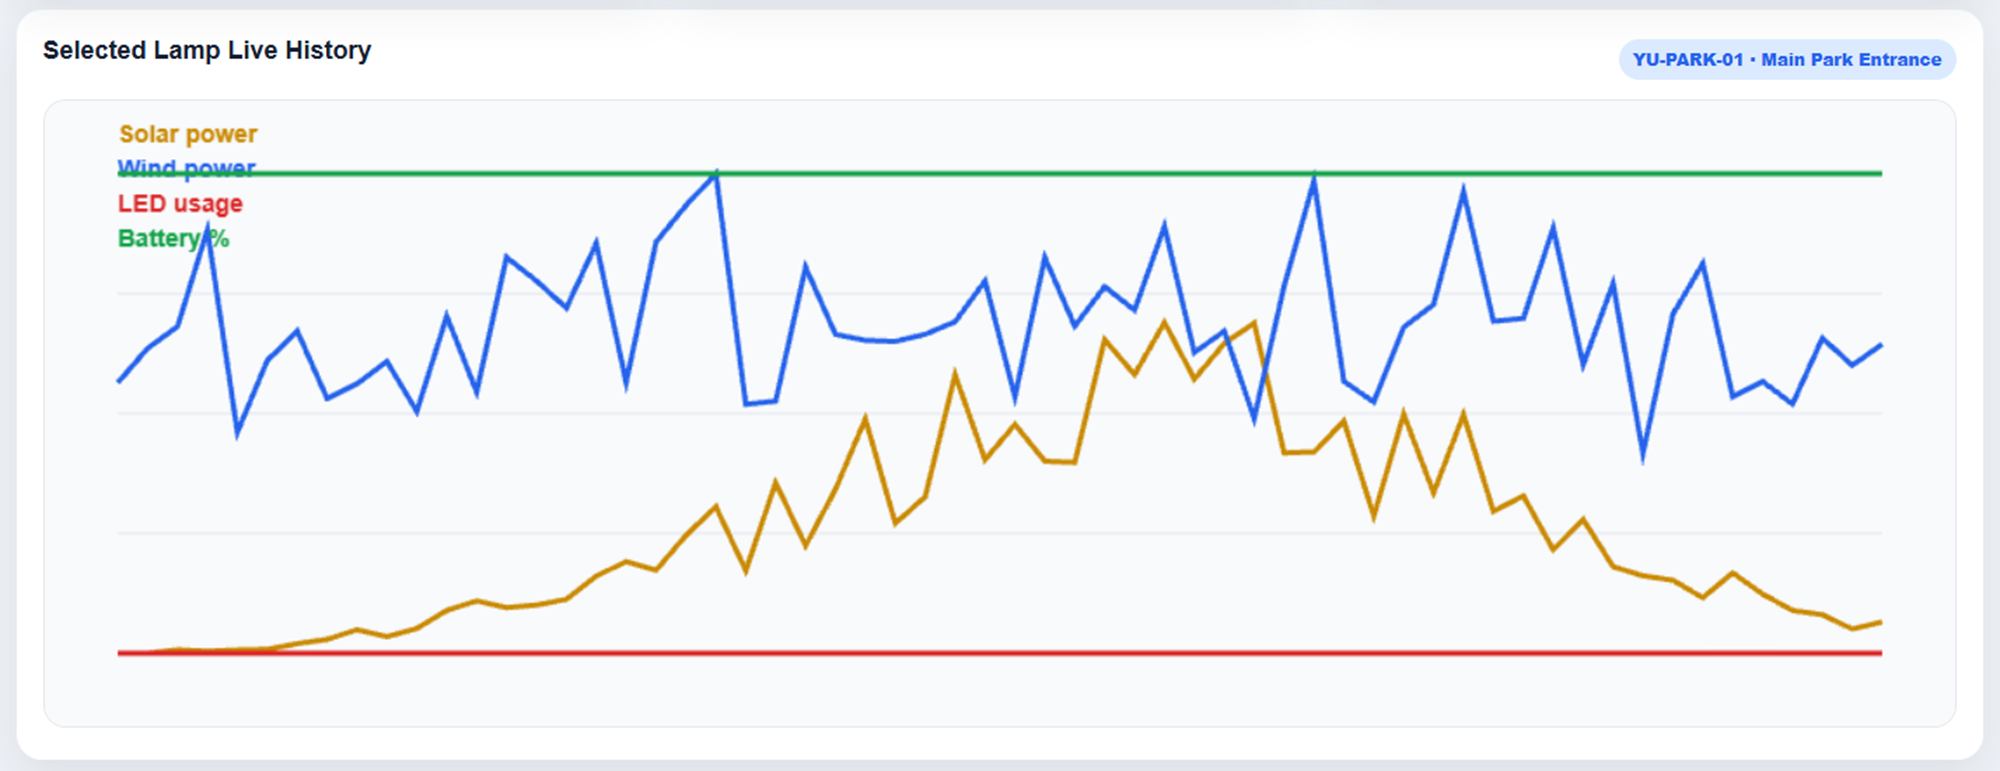
D3.js is useful for data-driven visualization. I used it to create a voltage history chart. This is important for my final project because I may need to show how voltage, current, power, or battery level changes over time.
  function drawD3Chart() {
    const container = document.getElementById("d3Chart");

    if (!container || !window.d3 || history.length < 2) {
      return;
    }

    container.innerHTML = "";

    const width = container.clientWidth || 900;
    const height = 330;

    const margin = {
      top: 30,
      right: 28,
      bottom: 42,
      left: 52
    };

    const svg = d3
      .select(container)
      .append("svg")
      .attr("width", width)
      .attr("height", height)
      .attr("viewBox", `0 0 ${width} ${height}`);

    const x = d3
      .scaleLinear()
      .domain(d3.extent(history, d => d.time))
      .range([margin.left, width - margin.right]);

    const y = d3
      .scaleLinear()
      .domain([0, Math.max(6, d3.max(history, d => d.voltage) + 0.5)])
      .nice()
      .range([height - margin.bottom, margin.top]);

    const line = d3
      .line()
      .x(d => x(d.time))
      .y(d => y(d.voltage))
      .curve(d3.curveMonotoneX);

    svg
      .append("path")
      .datum(history)
      .attr("class", "d3-line")
      .attr("d", line);

    svg
      .append("g")
      .attr("class", "axis")
      .attr("transform", `translate(0, ${height - margin.bottom})`)
      .call(d3.axisBottom(x).ticks(6));

    svg
      .append("g")
      .attr("class", "axis")
      .attr("transform", `translate(${margin.left}, 0)`)
      .call(d3.axisLeft(y).ticks(5));
  }
This chart shows the voltage history. Every second, a new value is added to the history array and the chart is redrawn.
Approach 2: HTML5 Canvas
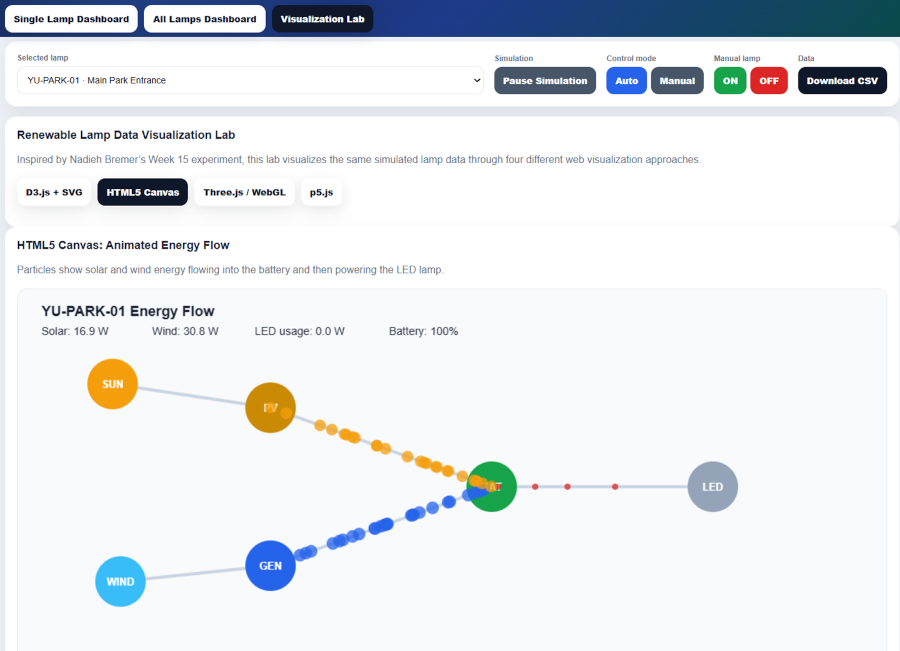
The second method I practiced was HTML5 Canvas.
Canvas works like a drawing surface. It is good for animations and visual scenes. I used it to draw a simple renewable-energy scene with a sun, waves, catamaran, solar panel, wind turbine, and battery.
    function drawCanvas() {
      const canvas = document.getElementById("energyCanvas");

      if (!canvas) {
        return;
      }

      const ctx = canvas.getContext("2d");
      const width = canvas.width;
      const height = canvas.height;

      ctx.clearRect(0, 0, width, height);

      ctx.fillStyle = "#bfe9ff";
      ctx.fillRect(0, 0, width, height);

      const sunRadius = 32 + state.light / 40;

      ctx.beginPath();
      ctx.arc(92, 82, sunRadius, 0, Math.PI * 2);
      ctx.fillStyle = "#ffc94a";
      ctx.fill();

      ctx.fillStyle = "#3aa6c8";
      ctx.beginPath();
      ctx.moveTo(0, 292);

      for (let x = 0; x <= width; x += 12) {
        const y = 292 + Math.sin(x * 0.035 + waveOffset) * 10;
        ctx.lineTo(x, y);
      }

      ctx.lineTo(width, height);
      ctx.lineTo(0, height);
      ctx.closePath();
      ctx.fill();

      canvasAngle += state.windRpm / 8000;

      ctx.save();
      ctx.translate(430, 135);
      ctx.rotate(canvasAngle);

      for (let i = 0; i < 3; i++) {
        ctx.rotate((Math.PI * 2) / 3);
        ctx.beginPath();
        ctx.moveTo(0, 0);
        ctx.lineTo(12, -8);
        ctx.lineTo(72, 0);
        ctx.lineTo(12, 8);
        ctx.closePath();
        ctx.fillStyle = "#f5f7fa";
        ctx.fill();
      }

      ctx.restore();

      drawBattery(ctx, 492, 185, 90, 42, state.battery);
    }
The light value changes the size of the sun. The wind speed changes the rotation of the turbine. The battery level changes the battery drawing.
Approach 3: Three.js / WebGL
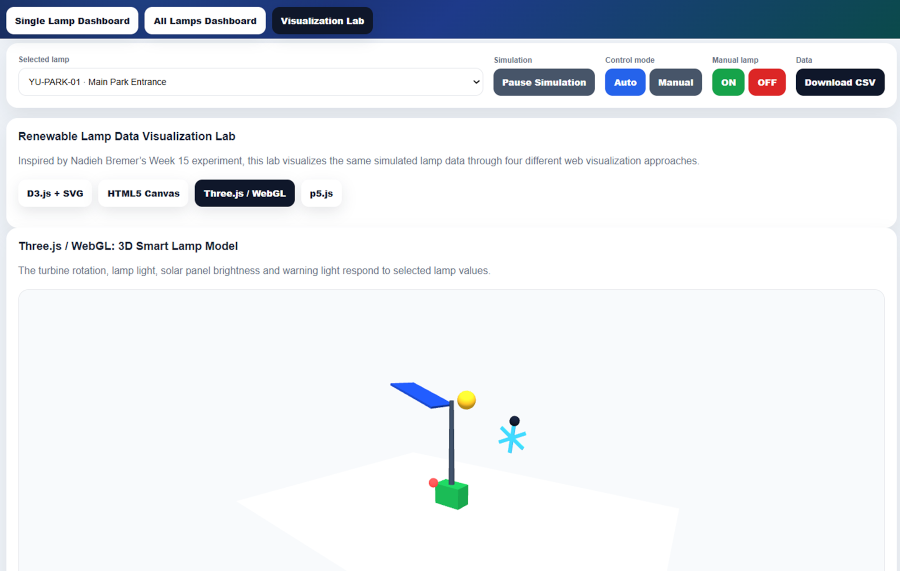
The third method was Three.js with WebGL.
This approach was useful because my final project is a physical object. A 3D interface can help represent the catamaran, solar panel, wind turbine, and battery in a more spatial way.
    import * as THREE from "three";

    const container = document.getElementById("threeContainer");

    let scene;
    let camera;
    let renderer;
    let turbineGroup;
    let batteryMesh;
    let solarPanelMesh;

    function initThreeScene() {
      scene = new THREE.Scene();
      scene.background = new THREE.Color(0xeef6fb);

      const width = container.clientWidth || 520;
      const height = 330;

      camera = new THREE.PerspectiveCamera(45, width / height, 0.1, 100);
      camera.position.set(4.5, 3.2, 6.5);
      camera.lookAt(0, 0, 0);

      renderer = new THREE.WebGLRenderer({
        antialias: true
      });

      renderer.setSize(width, height);
      container.appendChild(renderer.domElement);

      const ambientLight = new THREE.AmbientLight(0xffffff, 0.72);
      scene.add(ambientLight);

      const directionalLight = new THREE.DirectionalLight(0xffffff, 1);
      directionalLight.position.set(4, 8, 6);
      scene.add(directionalLight);

      createWaterPlane();
      createCatamaran();
      createTurbine();
      createBattery();
    }
In the animation loop, the turbine rotation depends on wind speed:
    function animateThreeScene() {
      requestAnimationFrame(animateThreeScene);

      const data = window.energyState || {
        windRpm: 200,
        battery: 50,
        light: 500
      };

      if (turbineGroup) {
        turbineGroup.rotation.z += data.windRpm / 9000;
      }

      if (batteryMesh) {
        if (data.battery > 60) {
          batteryMesh.material.color.set(0x3ca66b);
        } else if (data.battery > 30) {
          batteryMesh.material.color.set(0xf2b84b);
        } else {
          batteryMesh.material.color.set(0xe05c5c);
        }

        batteryMesh.scale.y = 0.65 + data.battery / 140;
      }

      renderer.render(scene, camera);
    }
This means the 3D scene is not static. It reacts to the changing energy data.
Approach 4: p5.js
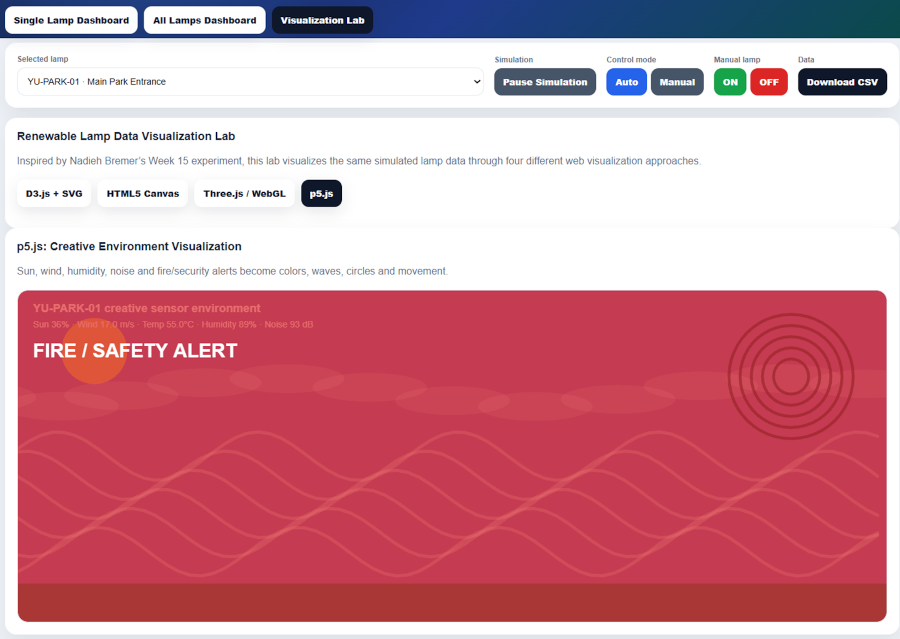
The fourth method was p5.js.
p5.js is useful for creative coding. I used it to make a more artistic visualization where light, wind, voltage, and battery level affect the drawing.
    const sketch = function (p) {
      let turbineAngle = 0;

      p.setup = function () {
        const width = container.clientWidth || 520;
        p.createCanvas(width, 330);
        p.textFont("Arial");
      };

      p.draw = function () {
        const data = window.energyState || {
          light: 500,
          windRpm: 200,
          battery: 50,
          voltage: 3.3,
          power: 1.2
        };

        p.background(234, 248, 255);

        drawSun(p, data);
        drawWindLines(p, data);
        drawTurbine(p, data);
        drawBattery(p, data);
        drawLabels(p, data);
      };
    };
The sun size changes according to the light value:
    function drawSun(p, data) {
      const sunSize = p.map(data.light, 150, 950, 32, 95);
      const alpha = p.map(data.light, 150, 950, 80, 180);

      p.noStroke();
      p.fill(255, 205, 60, alpha);
      p.circle(86, 82, sunSize + 45);

      p.fill(255, 193, 55);
      p.circle(86, 82, sunSize);
    }
The turbine rotates faster when wind speed increases:
    function drawTurbine(p, data) {
      const cx = p.width * 0.62;
      const cy = 145;

      turbineAngle += p.map(data.windRpm, 50, 560, 0.01, 0.13);

      p.stroke(60, 75, 90);
      p.strokeWeight(5);
      p.line(cx, cy, cx, 260);

      p.push();
      p.translate(cx, cy);
      p.rotate(turbineAngle);

      for (let i = 0; i < 3; i++) {
        p.rotate((p.TWO_PI) / 3);
        p.fill(255);
        p.triangle(0, 0, 18, -9, 78, 0);
        p.triangle(0, 0, 18, 9, 78, 0);
      }

      p.pop();
    }
This method was easier for quick visual experimentation compared with Three.js.
Express.js local server
After testing the static dashboard, I created an Express.js server. Express serves the dashboard files from the public folder.
The main server code is:
    const express = require("express");
    const http = require("http");
    const path = require("path");
    const { Server } = require("socket.io");

    const app = express();
    const server = http.createServer(app);
    const io = new Server(server);

    const PORT = 3000;

    app.use(express.static(path.join(__dirname, "public")));
This line is important:
app.use(express.static(path.join(__dirname, "public")));
It tells Express to serve:
  index.html
  style.css
  script.js
  sketch.js
  index.js
from the public folder.
Socket.IO real-time communication
The next step was to use Socket.IO. This allowed the server to send live data to the browser every second.
The server generates energy data:
  function generateEnergyData() {
    time += 1;

    const lightWave = Math.sin(time * 0.18 + weatherShift);
    const windWave = Math.cos(time * 0.13 + weatherShift * 0.5);

    const light = Math.round(clamp(620 + lightWave * 230 + Math.random() * 50, 150, 950));
    const windRpm = Math.round(clamp(260 + windWave * 130 + Math.random() * 70, 60, 560));

    const voltage = clamp(2.4 + light / 310 + Math.random() * 0.15, 2.5, 5.4);
    const current = clamp(0.08 + windRpm / 1600 + light / 4200, 0.05, 0.85);
    const power = voltage * current;

    return {
      time,
      voltage: Number(voltage.toFixed(2)),
      current: Number(current.toFixed(2)),
      power: Number(power.toFixed(2)),
      light,
      windRpm,
      battery: Number(battery.toFixed(1)),
      chargingStatus
    };
  }
Then it sends the data to the browser:
    setInterval(() => {
      const data = generateEnergyData();
      io.emit("energy-data", data);
      console.log("Sent:", data);
    }, 1000);
The browser receives it:
    const socket = io();

    socket.on("energy-data", function (incoming) {
      state.time = incoming.time;
      state.voltage = incoming.voltage;
      state.current = incoming.current;
      state.power = incoming.power;
      state.light = incoming.light;
      state.windRpm = incoming.windRpm;
      state.battery = incoming.battery;
      state.chargingStatus = incoming.chargingStatus;

      updateDashboardText();
      drawD3Chart();
    });
This makes the interface real-time.
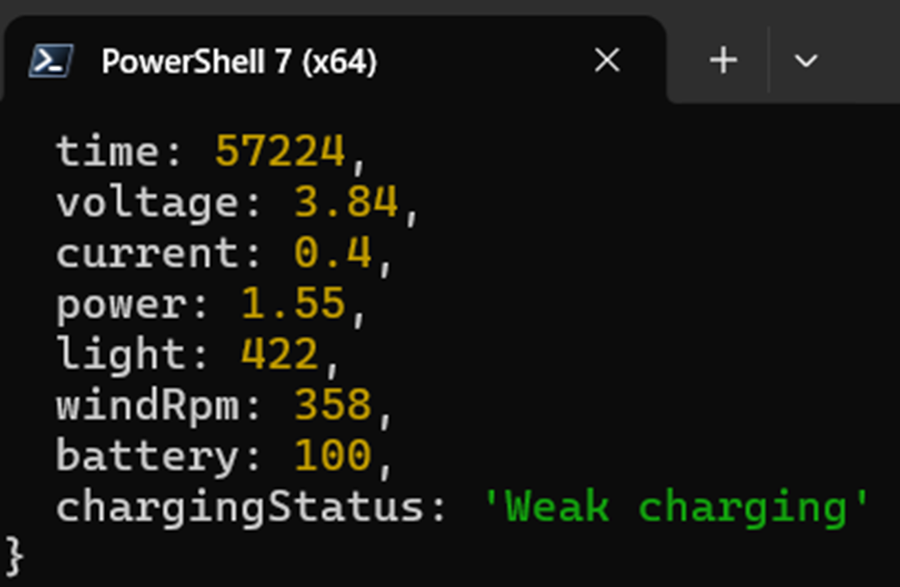
Example data
The data sent from the server looks like this:
    {
      "time": 12,
      "voltage": 3.82,
      "current": 0.35,
      "power": 1.34,
      "light": 720,
      "windRpm": 310,
      "battery": 64,
      "chargingStatus": "Weak charging"
    }
This data is then used by all visualizations.
Problems and fixes
During this assignment, I had several problems.
Problem 1: localhost showed directory listing
At first, localhost:5173 showed my user folder instead of the dashboard. I understood that I started the Python server from the wrong directory.
I fixed it by using the –directory option:
python -m http.server 5173 --directory "C:\Fab 2026_Assignment\Interface and Application Programming_localhost"
Problem 2: npm package name error
When I used a folder name with +, npm created an invalid package name. I solved it by renaming the Express folder to:
Interface and Application Programming_Express_Socket.IO
Problem 3: wrong npm command
I accidentally typed:
npm install express socket.ionotepad server.js
Comparison of visualization methods
| Method | What I used it for | Advantage | Limitation |
|---|---|---|---|
| D3.js + SVG | Voltage history chart | Very good for precise data visualization | More difficult syntax |
| HTML5 Canvas | Animated 2D energy scene | Good for smooth animation | Less structured for charts |
| Three.js / WebGL | 3D catamaran and turbine | Good for spatial visualization | More complex |
| p5.js | Creative visual experiment | Easy for quick visual coding | Less professional for dashboards |
| Express.js | Local web server | Serves files like a real app | Needs Node.js setup |
| Socket.IO | Real-time data communication | Sends live values to browser | Needs server-client structure |
What I learned
Through this assignment, I learned that interface programming is not only about making a nice screen. It includes structure, design, data flow, communication, and visualization.
The browser-only version helped me understand how HTML, CSS, JavaScript, D3.js, Canvas, Three.js, and p5.js work together. The Express + Socket.IO version helped me understand how a server can send live data to the browser.
For my final project, this is very useful because my solar/wind catamaran will need an interface that shows real-time energy information. The next step is to replace simulated server data with real serial data from a microcontroller.