
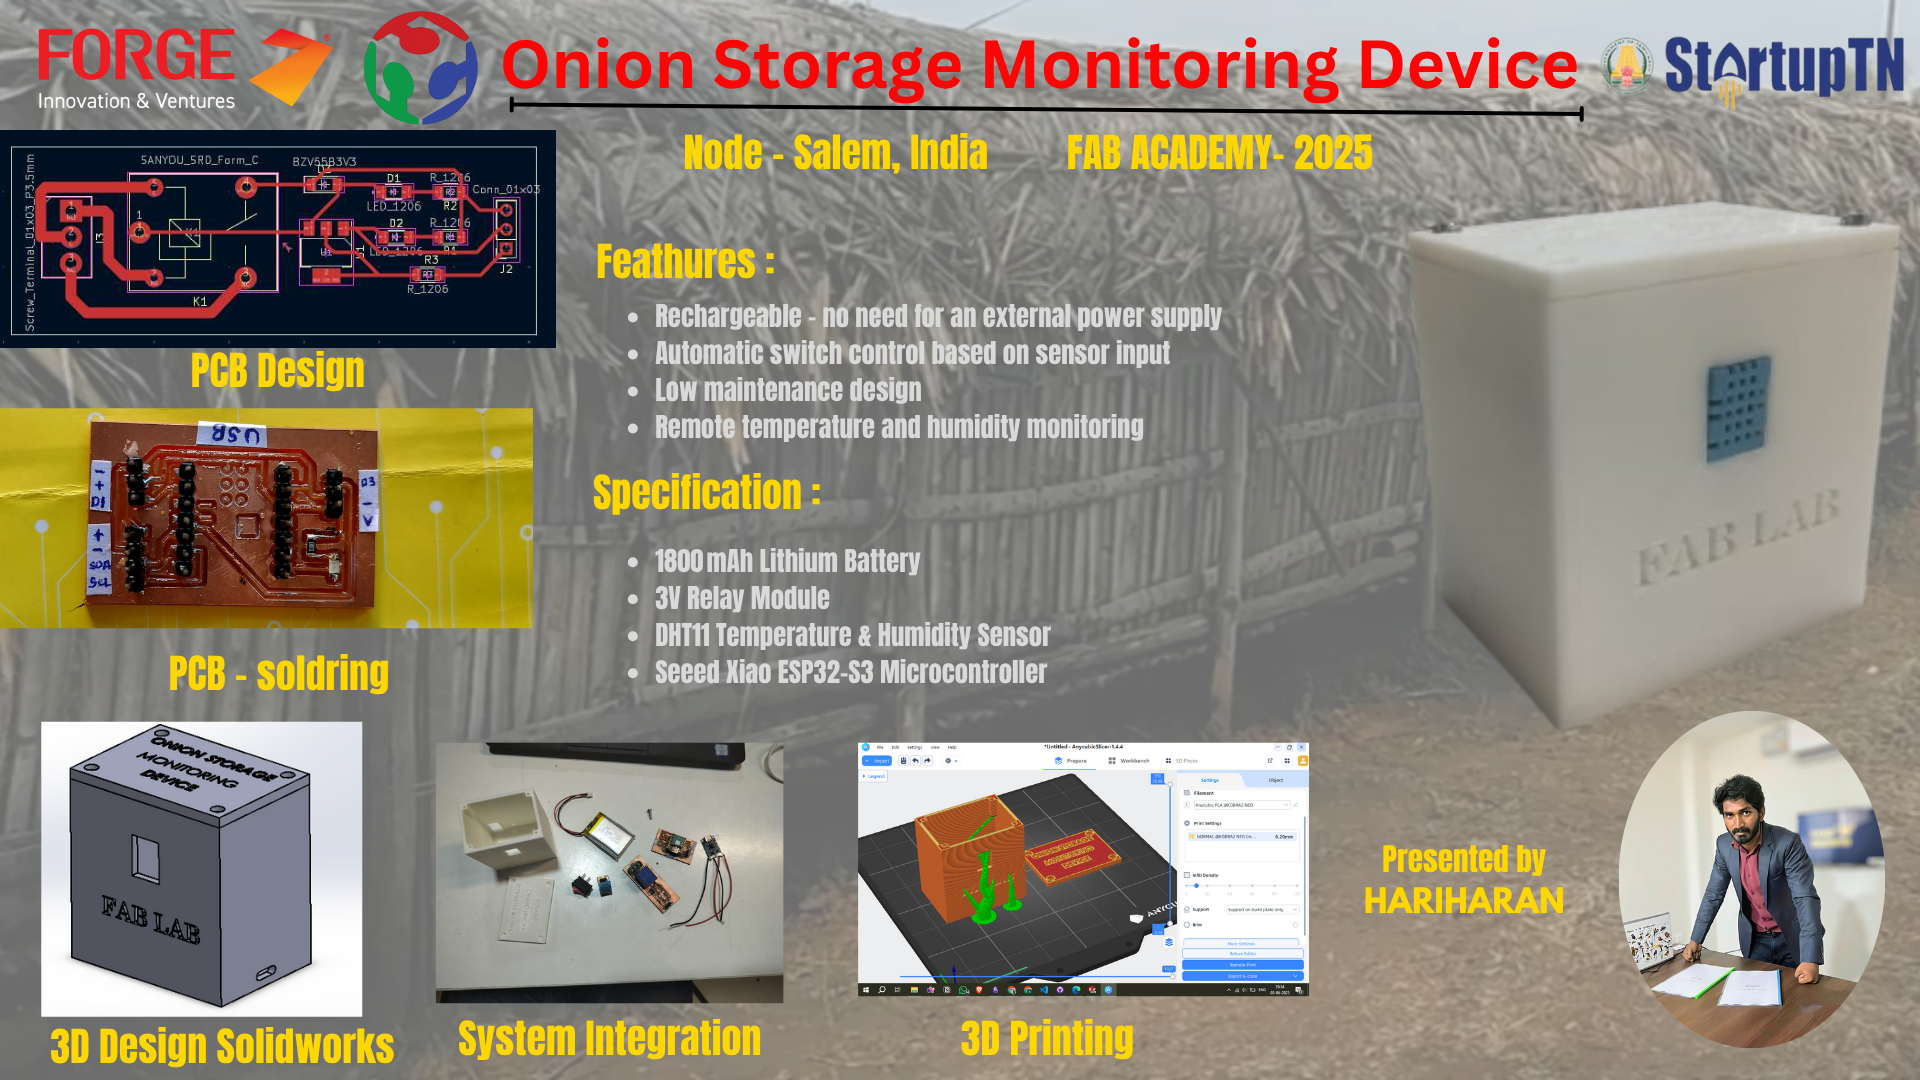
Onion Storage Monitoring Device
Presentation
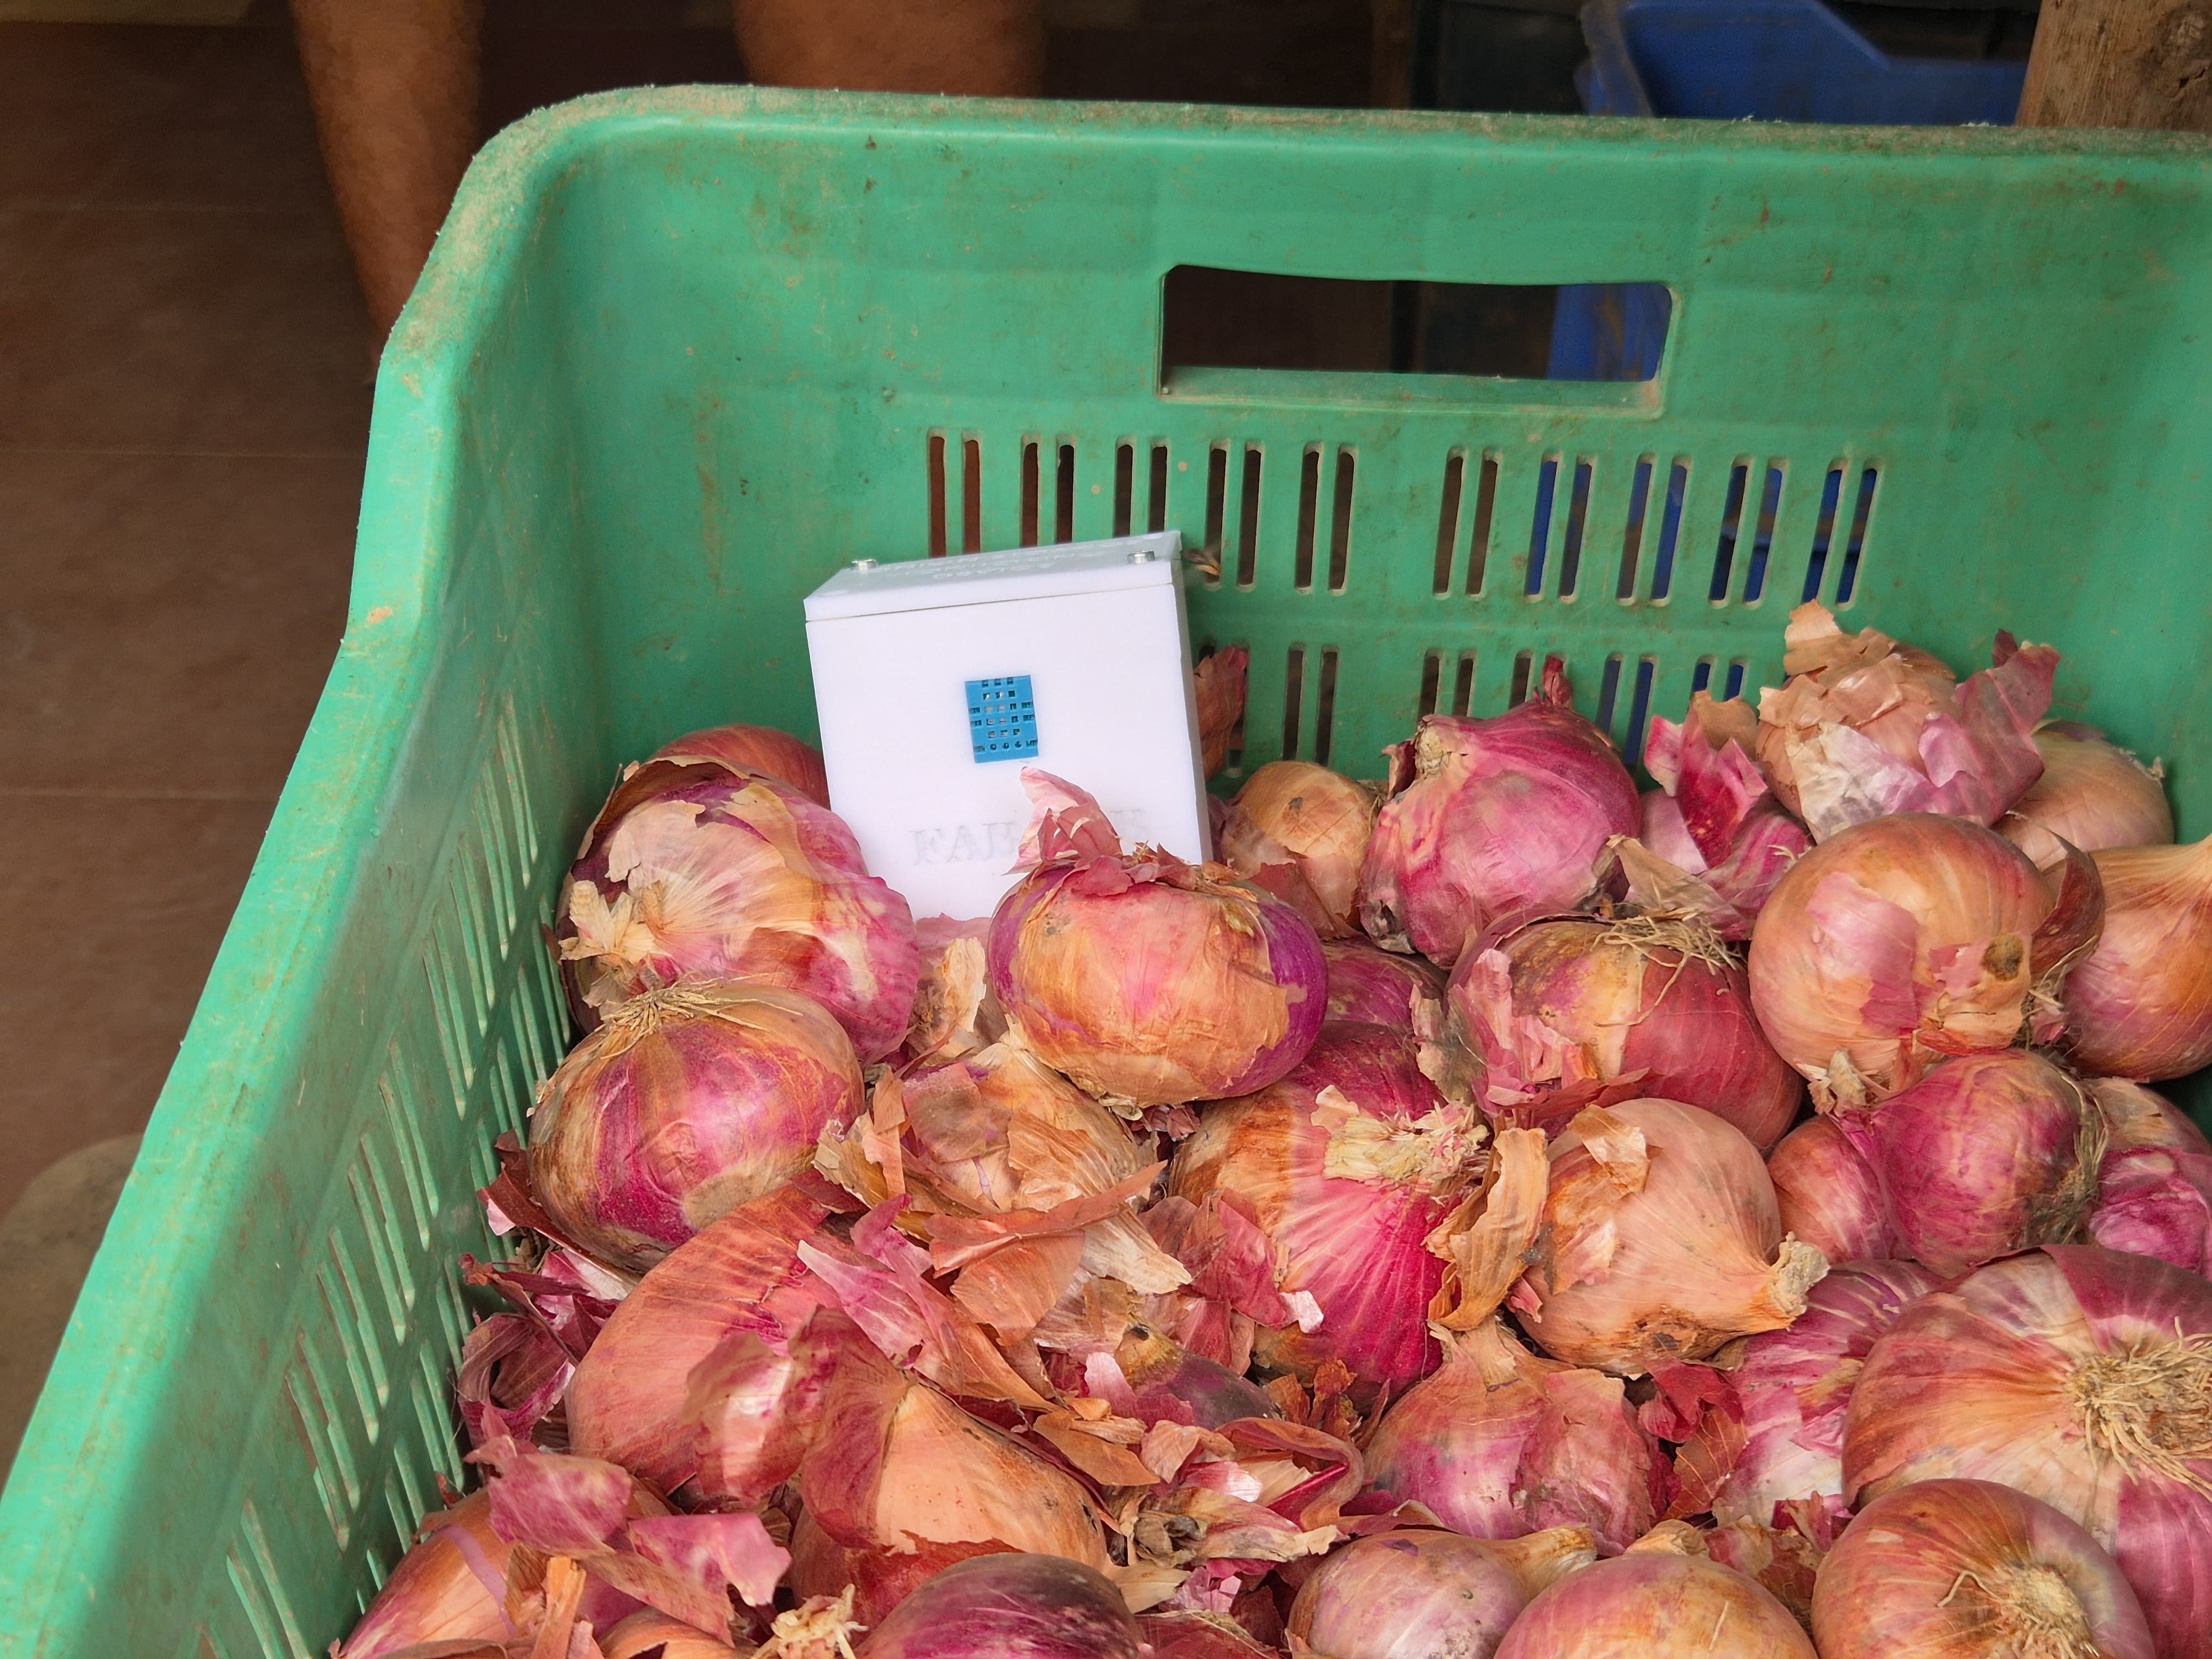
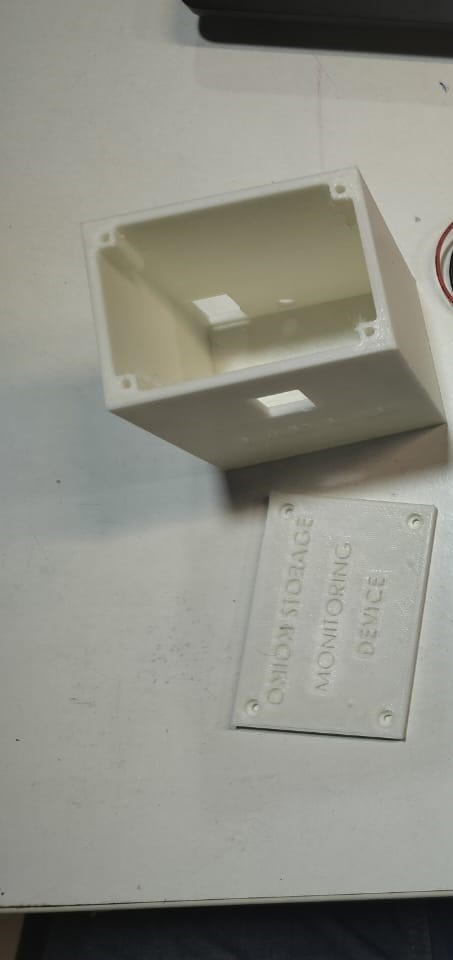
Final Image
1. Problem
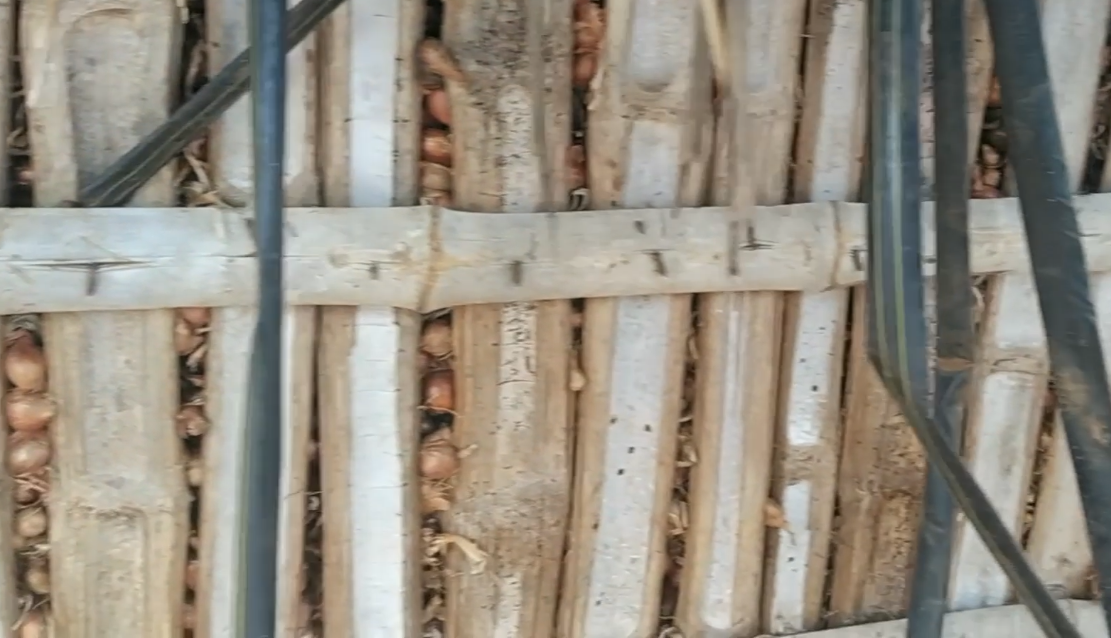
Onions suffer significant losses due to poor storage conditions, leading to a 25-30% market value loss. Farmers face challenges with weight loss, rotting, and sprouting, resulting in an economic loss of ₹11,000 crores annually.
2. Why I Chose This Problem
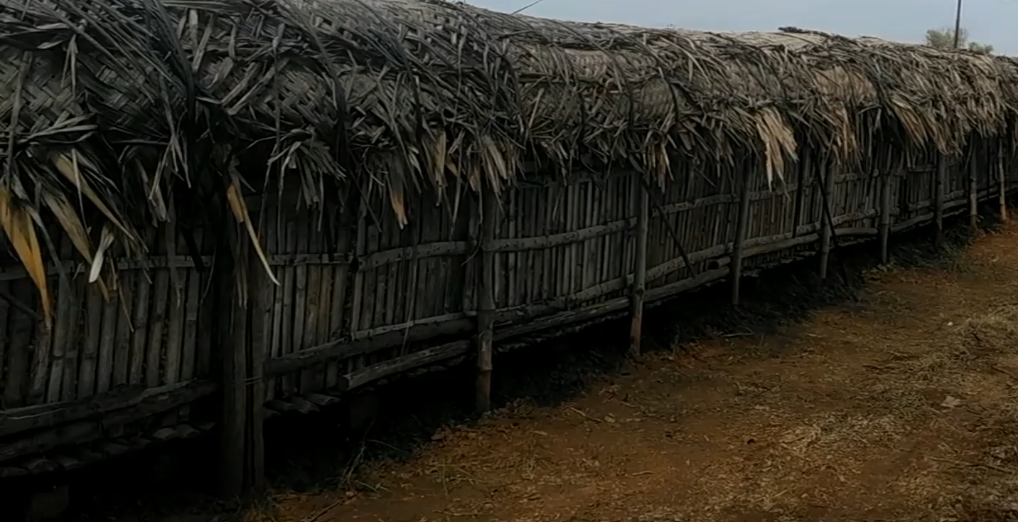
I have always been passionate about sustainability and finding ways to create useful solutions from waste. In my hometown, onion prices fluctuate drastically sometimes they are extremely high, and other times they drop significantly. During a visit to my grandmother’s town, I had a conversation with an onion farmer about why onions spoil so quickly. He explained that storage is the biggest issue if onions are exposed to high heat, they lose weight, and if they get too cold, they rot.
This conversation made me wonder whether a monitoring device existed for this problem. While temperature and humidity monitoring devices have been commercially available for over five decades, I found that there was no dedicated solution specifically for the Indian onion market. Realizing this gap, I decided to create a project that would have a meaningful impact and help farmers minimize their losses.
3. Optimal Condition
Department of Consumer Affairs Ministry of Consumer Affairs, Food and Public Distribution - Documents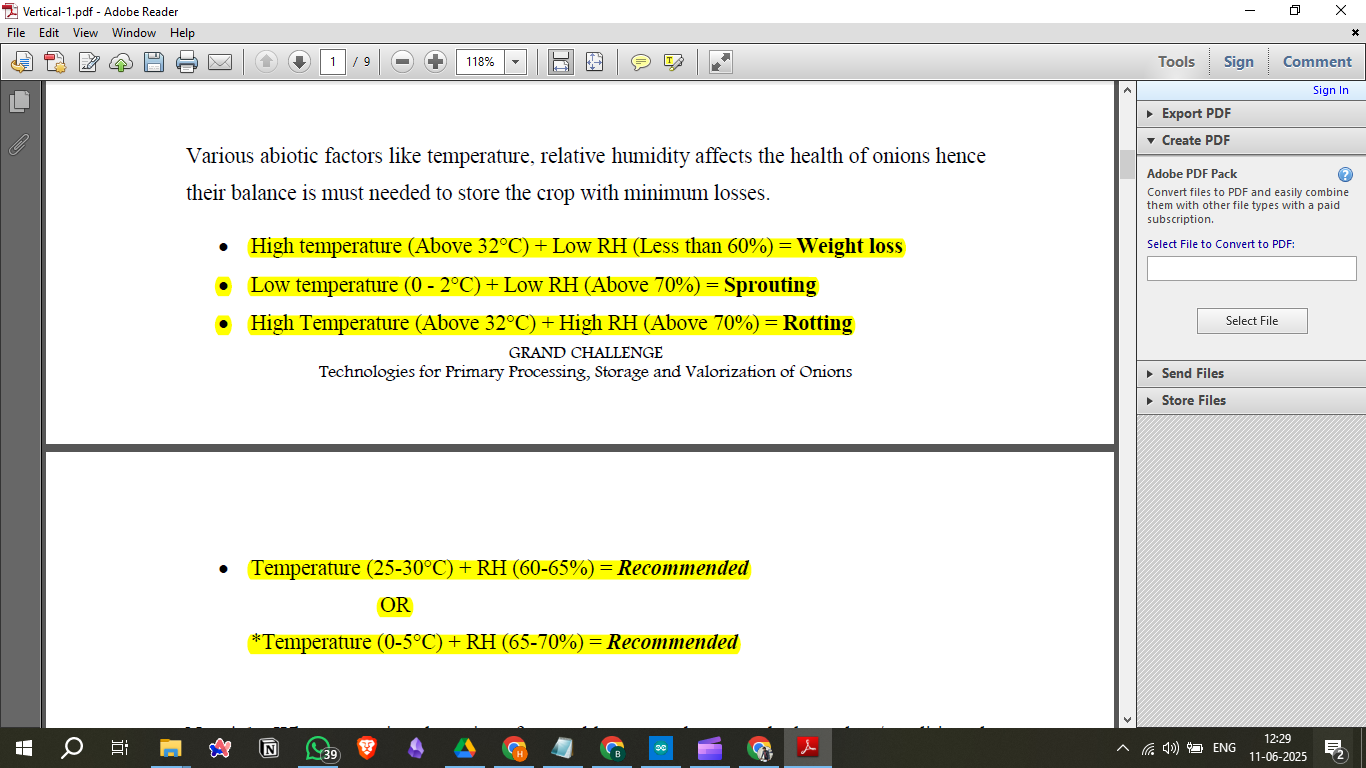
4. Solution
The proposed solution, Onion Octopus, is an IoT-based monitoring device that regulates storage conditions to reduce spoilage. It features real-time monitoring, alerts, and predictive analytics.
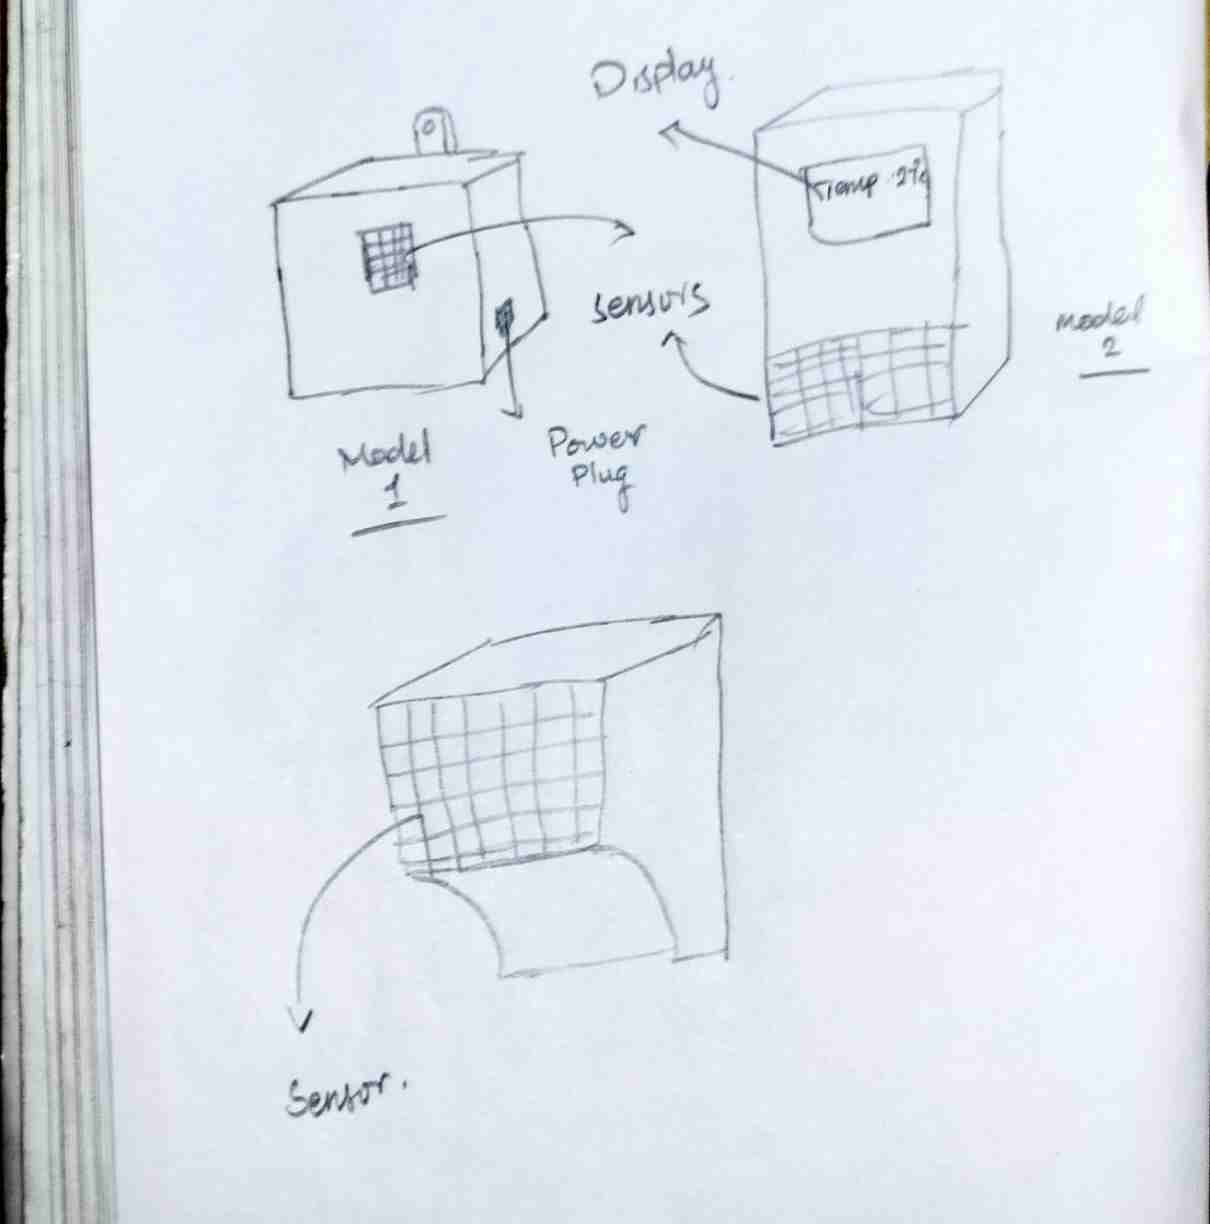
5. Product Sketch
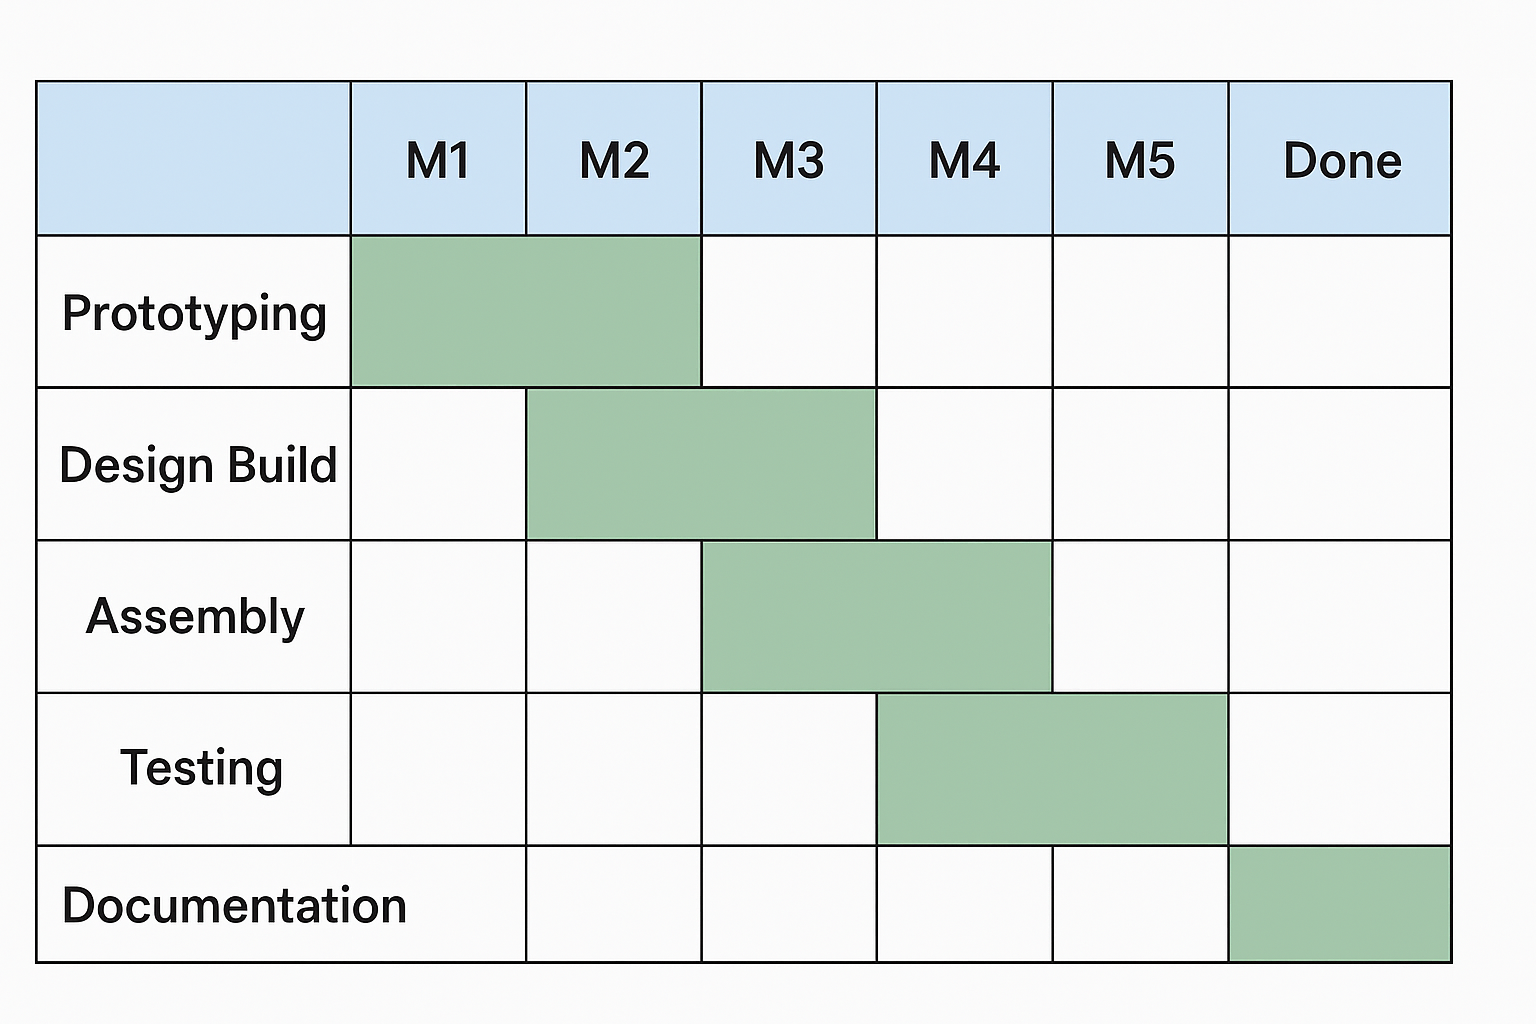
Timeline Chart
6. User Flow Diagram
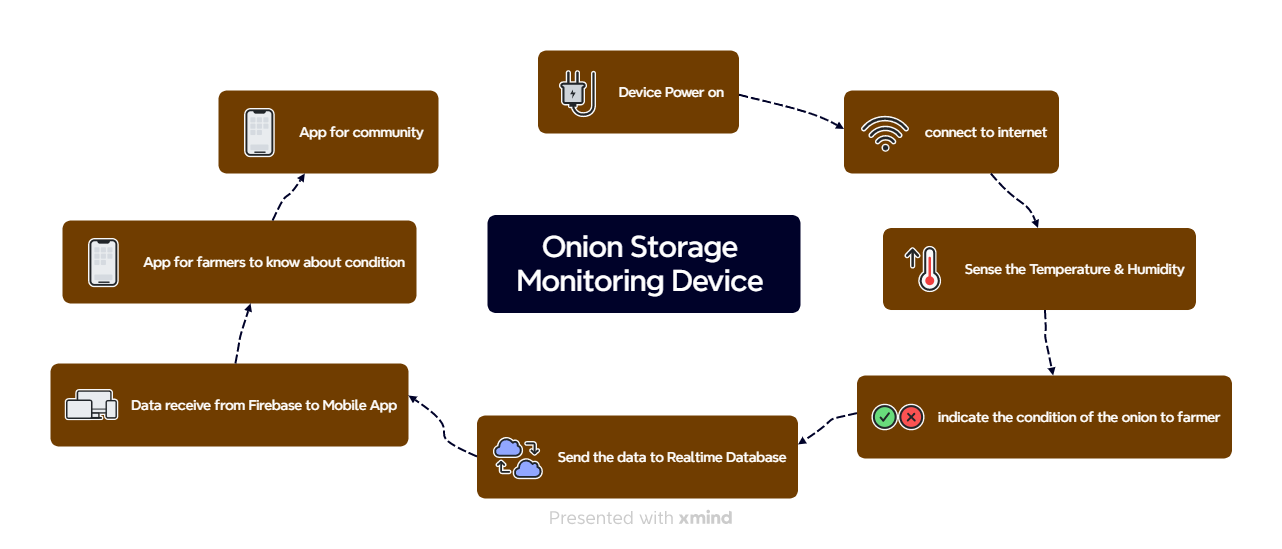
1.Device Power On
The device is switched on using a battery or power adapter.
2.Connect to Internet
It connects to the internet to send and receive data.
3.Sense Temperature & Humidity
The sensor checks the temperature and humidity inside the onion storage.
4.Show Onion Condition
The device checks if the storage condition is good or bad and gives a signal.
5.Send Data to Cloud
The information is sent to an online database (Firebase).
6.Send Data to Mobile App
The app receives this data from the cloud.
7.Farmer App
Farmers can see the current condition of the storage on their mobile app
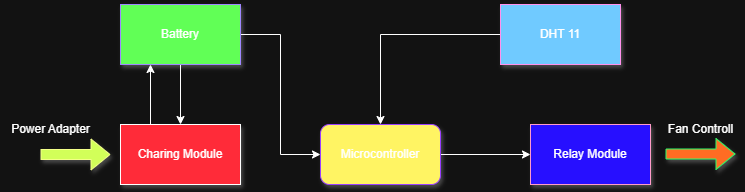
7. Block Diagram
The block diagram shows the working of a smart system that monitors and controls the temperature and humidity in onion storage. The system is powered by a rechargeable battery, which is charged through a charging module using a power adapter. The microcontroller (Xiao ESP32S3) acts as the brain of the system. It receives data from the DHT11 sensor, which continuously measures the temperature and humidity levels inside the storage. If the values go beyond the set limits (e.g., temperature above 30°C or humidity above 65%), the microcontroller activates the relay module. This relay controls a small fan that turns ON automatically to bring the conditions back to normal. Once the environment is stable, the fan turns OFF. The system is designed to work efficiently even in areas with limited power supply, making it suitable for rural farmers.
8. Technical requirements
Hardware Components:
- Microcontroller (ESP8266): To control sensors and handle data transmission.
- Temperature & Humidity Sensor (DHT22): To measure environmental conditions in onion storage.
- Power Supply (5V Lithium Battery): To power the device.
- LED Indicators : To provide visual alerts for temperature/humidity threshold breaches.
Software Components:
- Realtime Database (Google Firebase): To store and process sensor data.
- Mobile Application (Android): To display real-time data and send notifications to farmers.
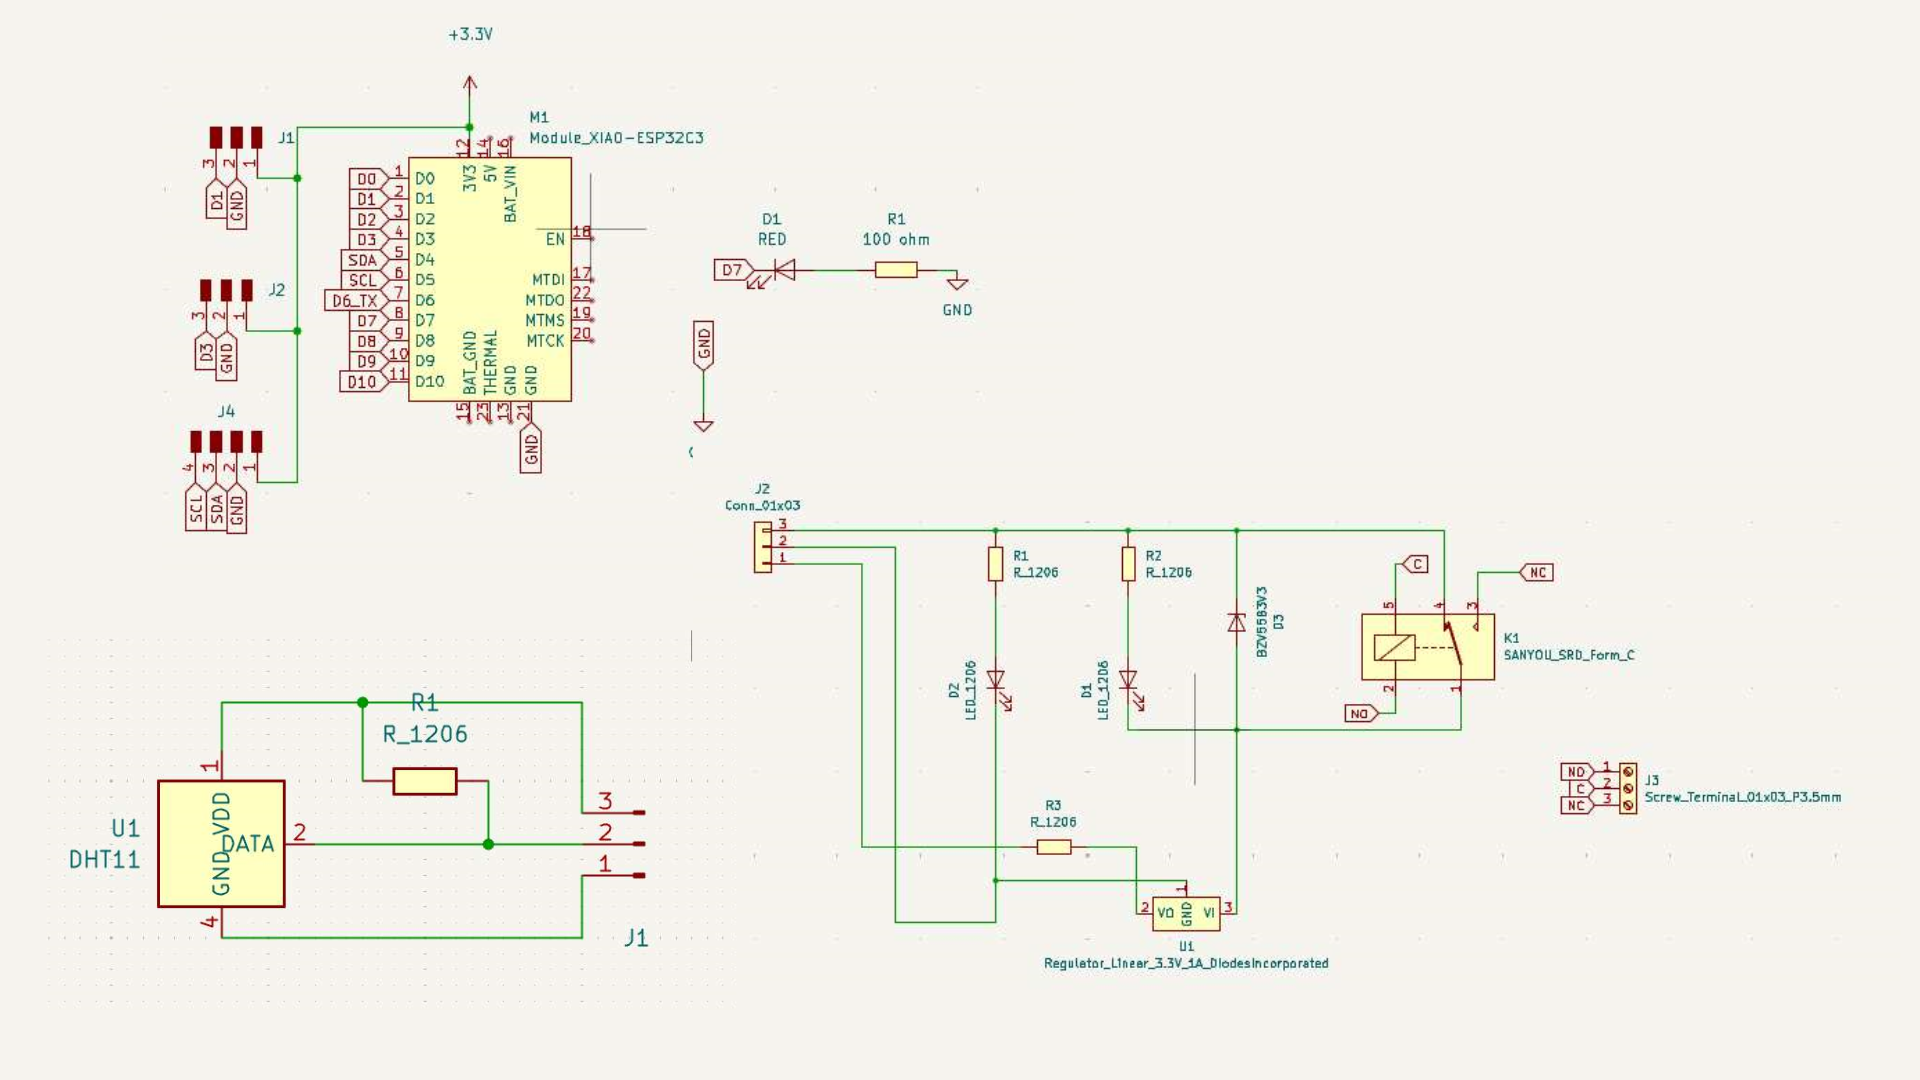
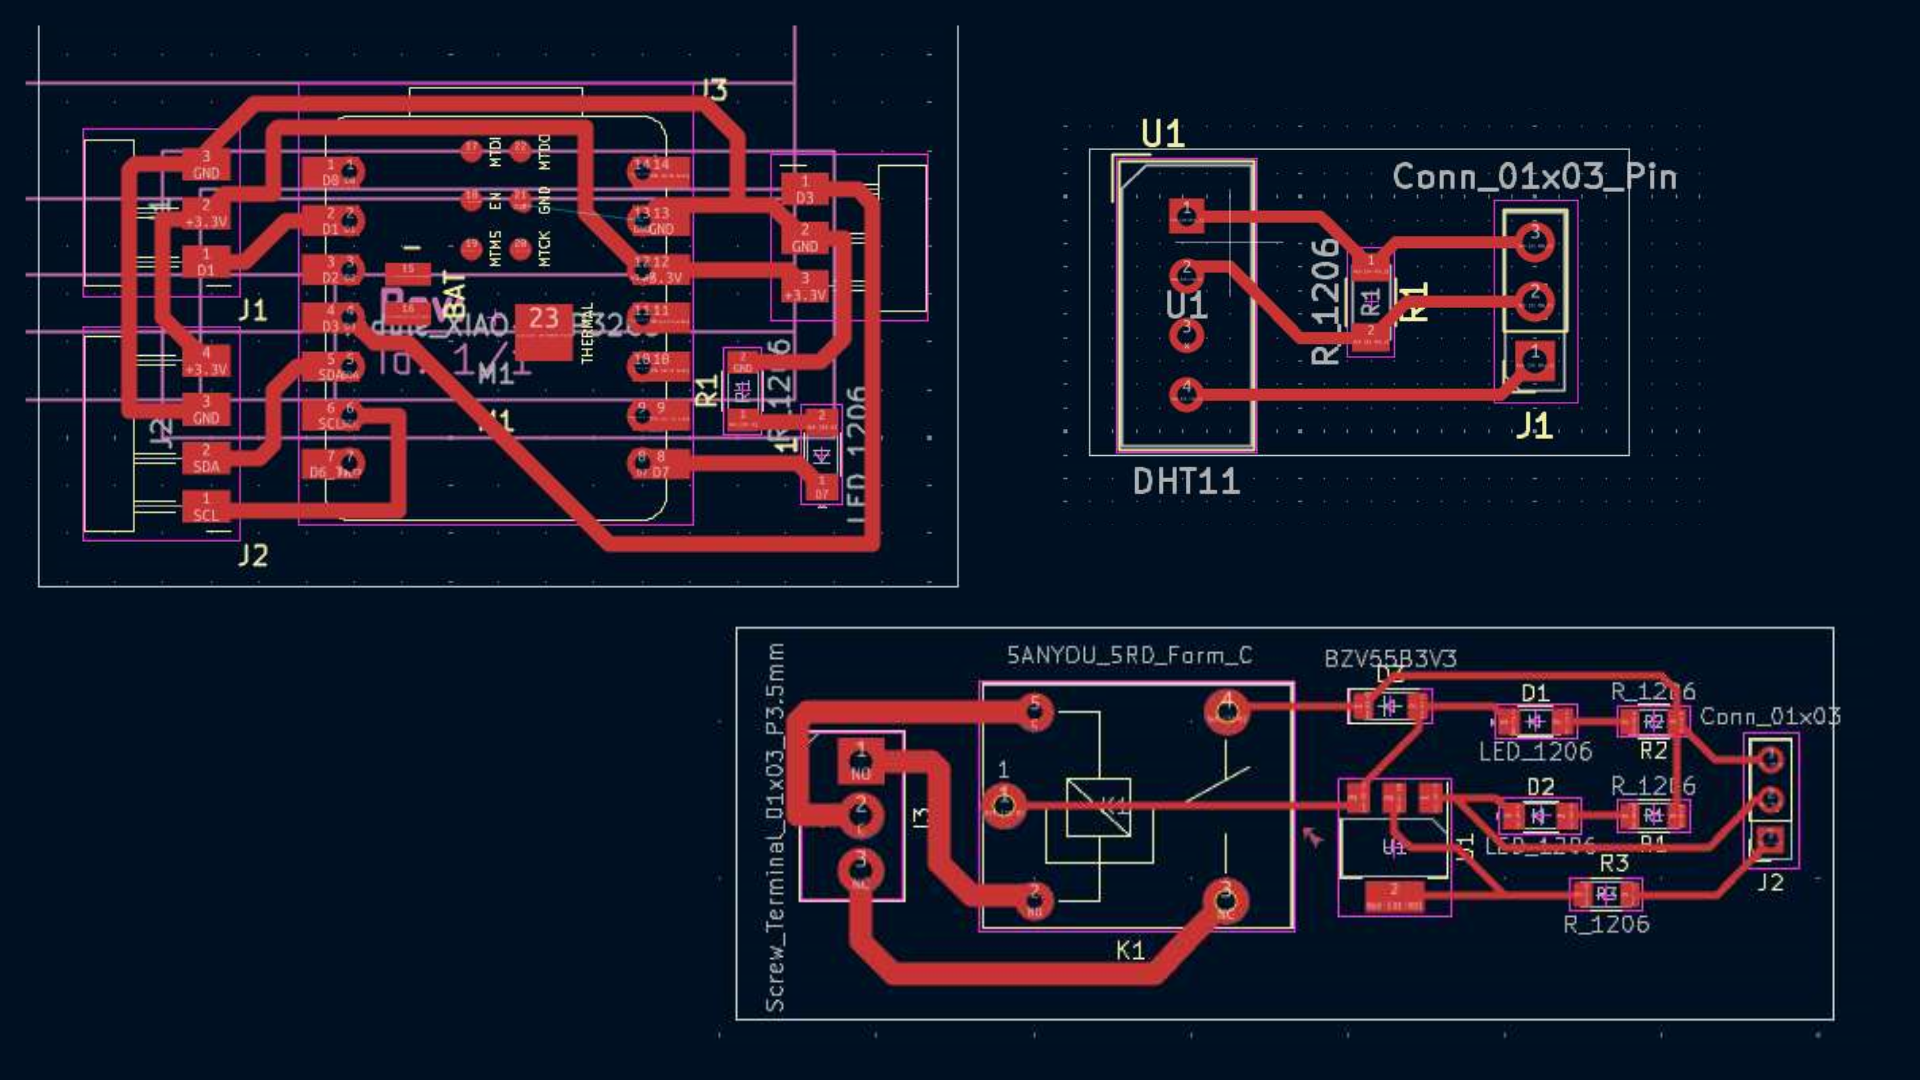
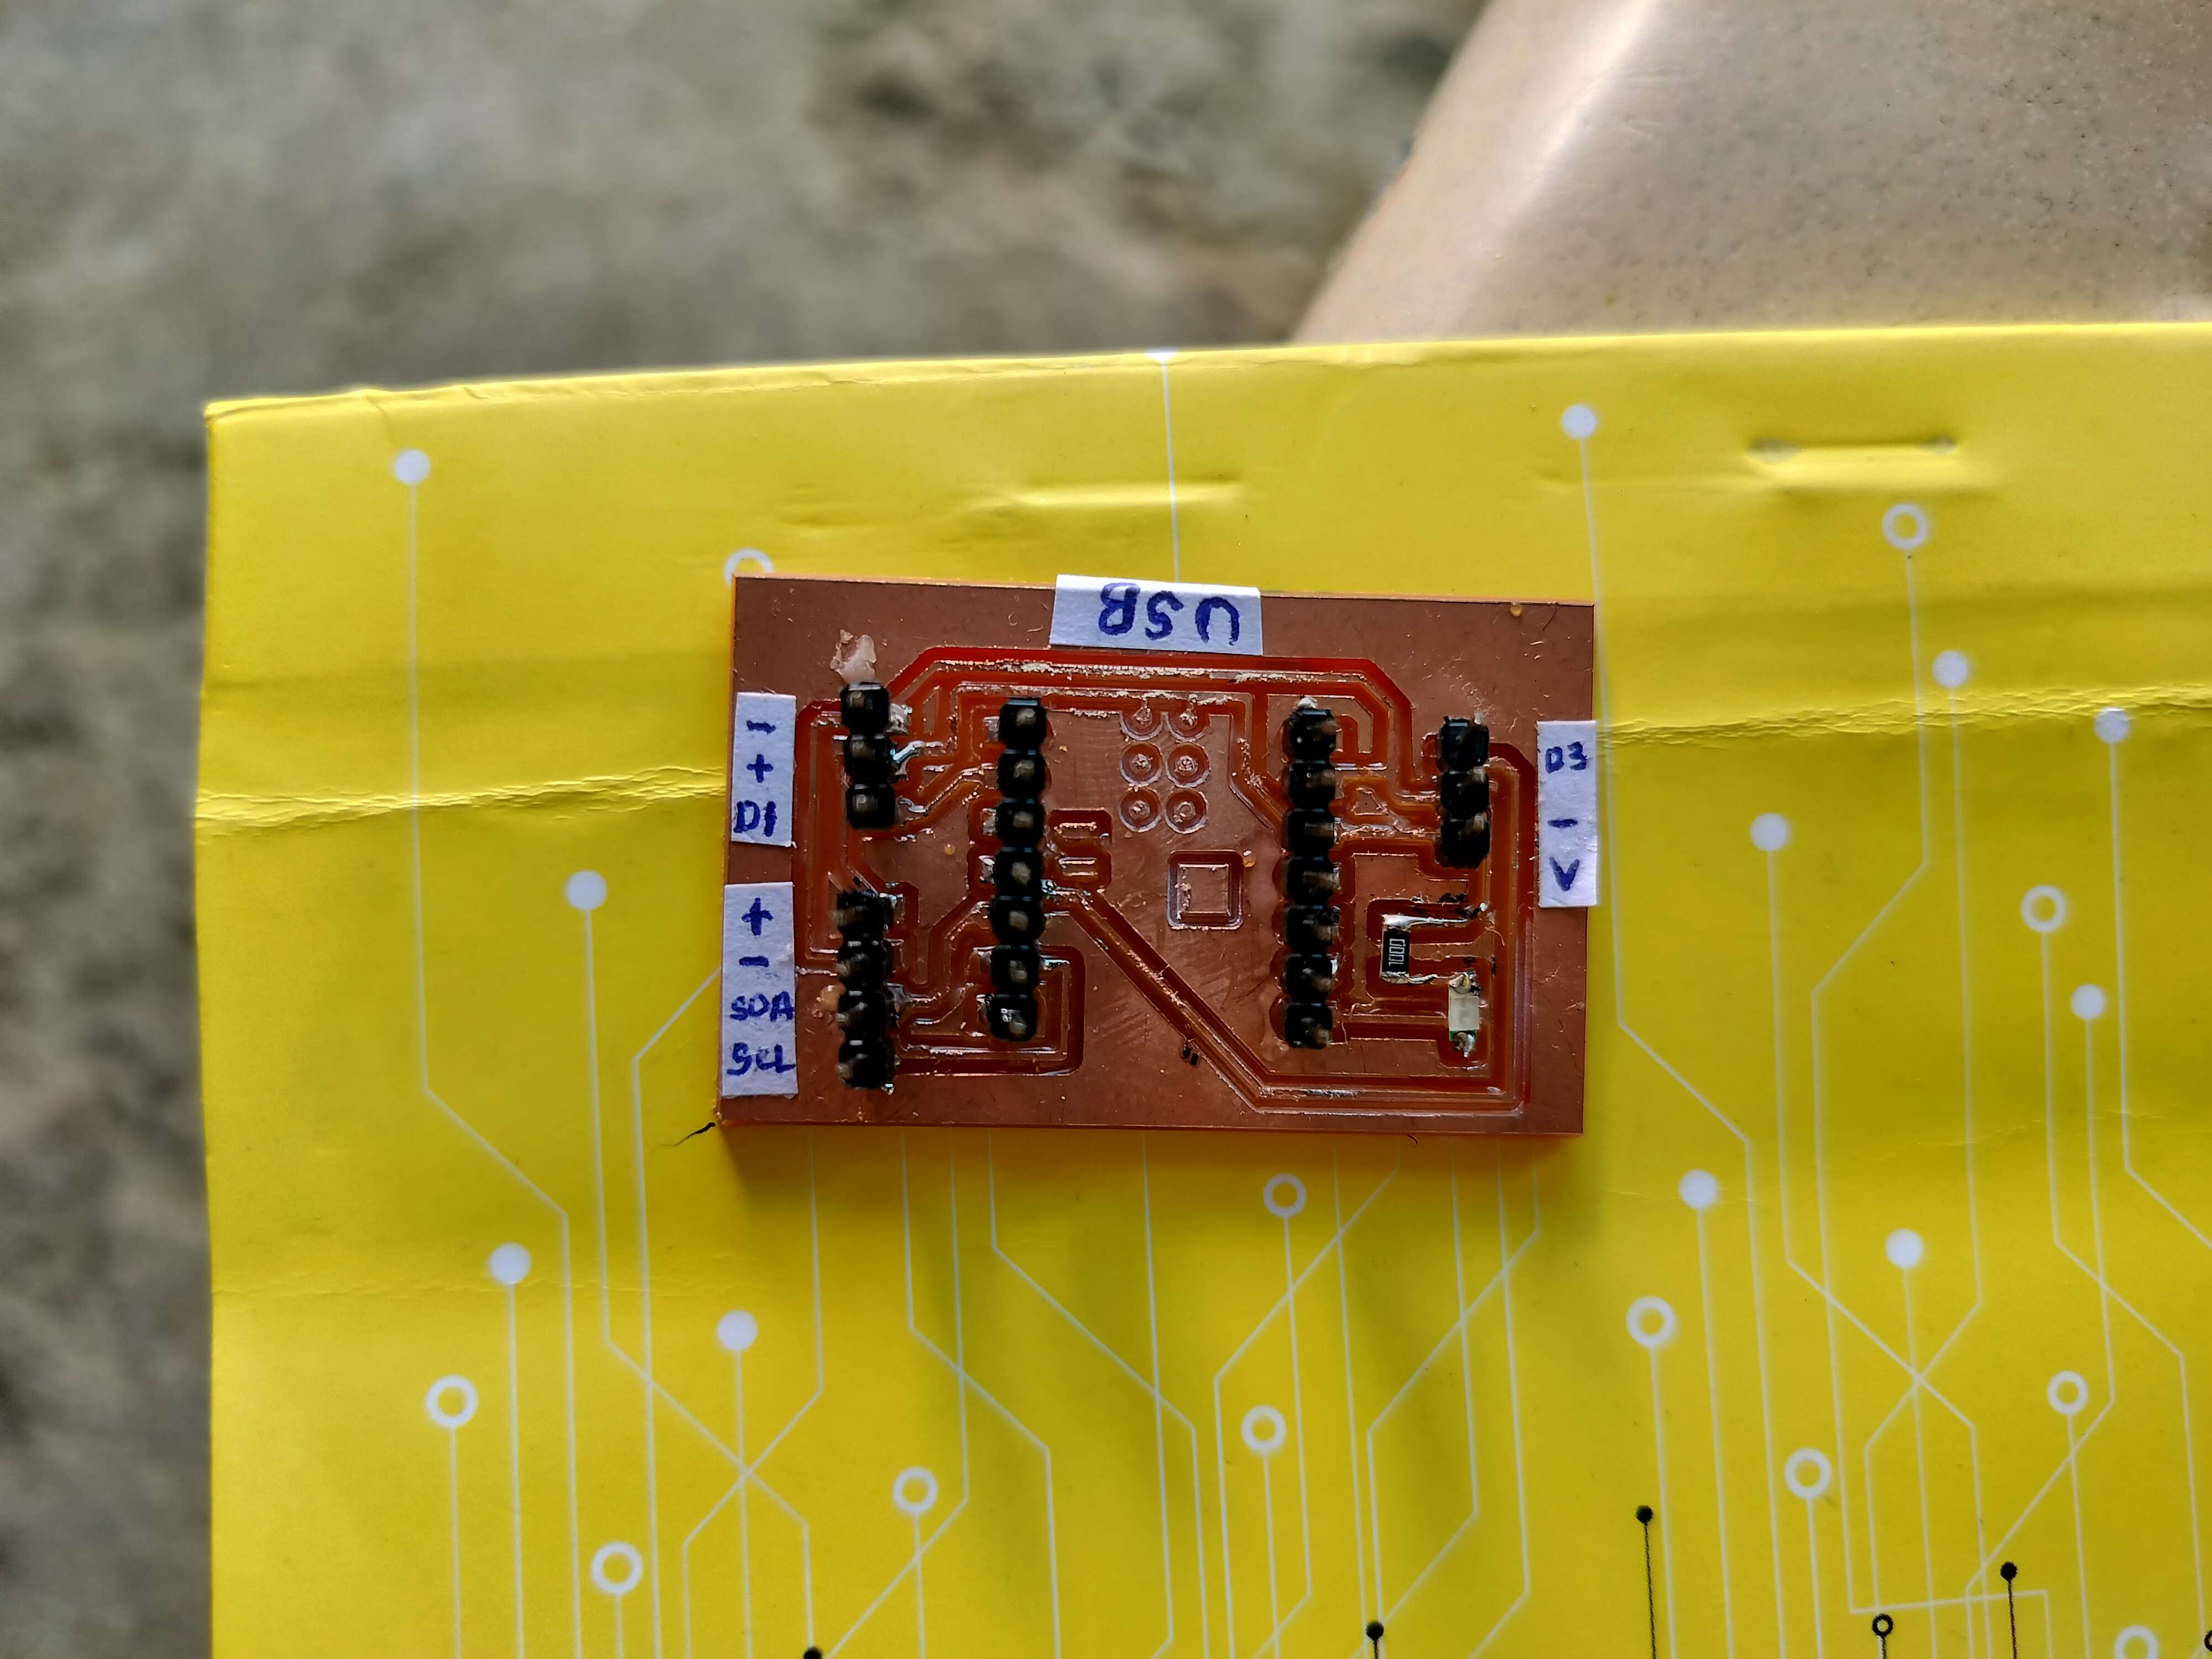
9. Circuit Design
I designed the custom PCB for my project using KiCad. I created the schematic, placed components based on signal flow, and routed the tracks manually to optimize space and minimize interference.
What I Learned
I done this work in the previous week 8, 9, 10 of assignments.
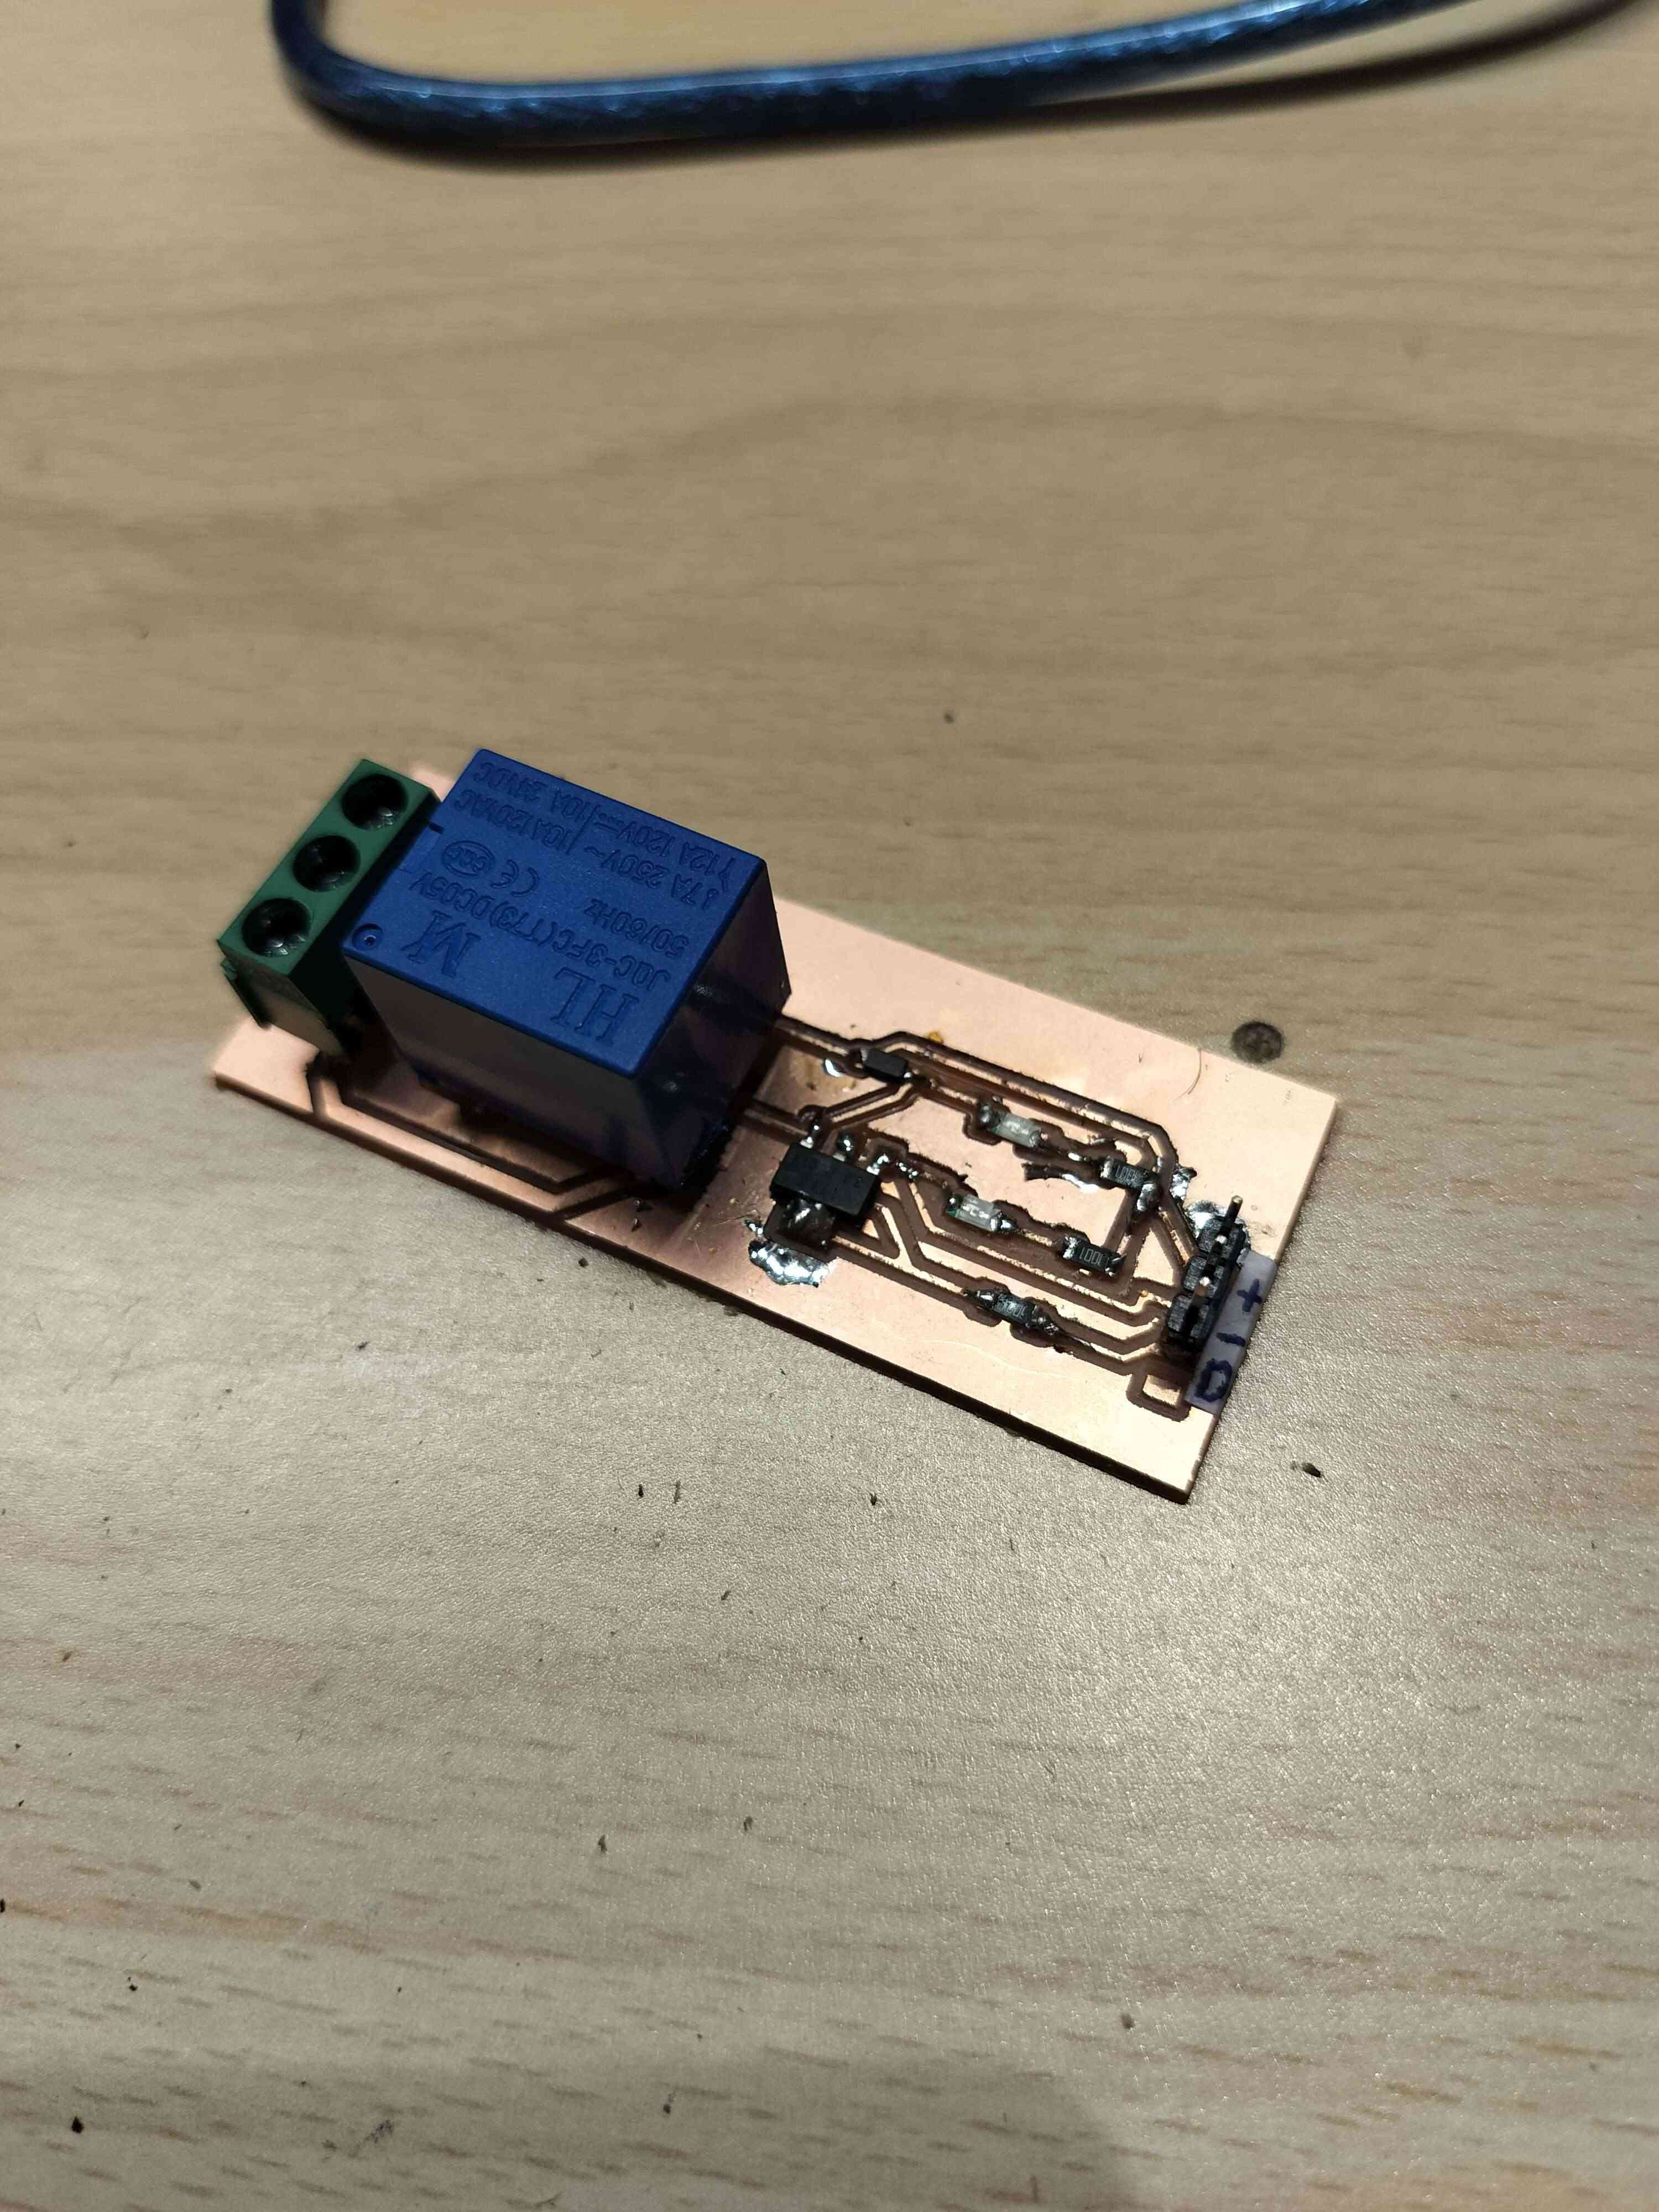
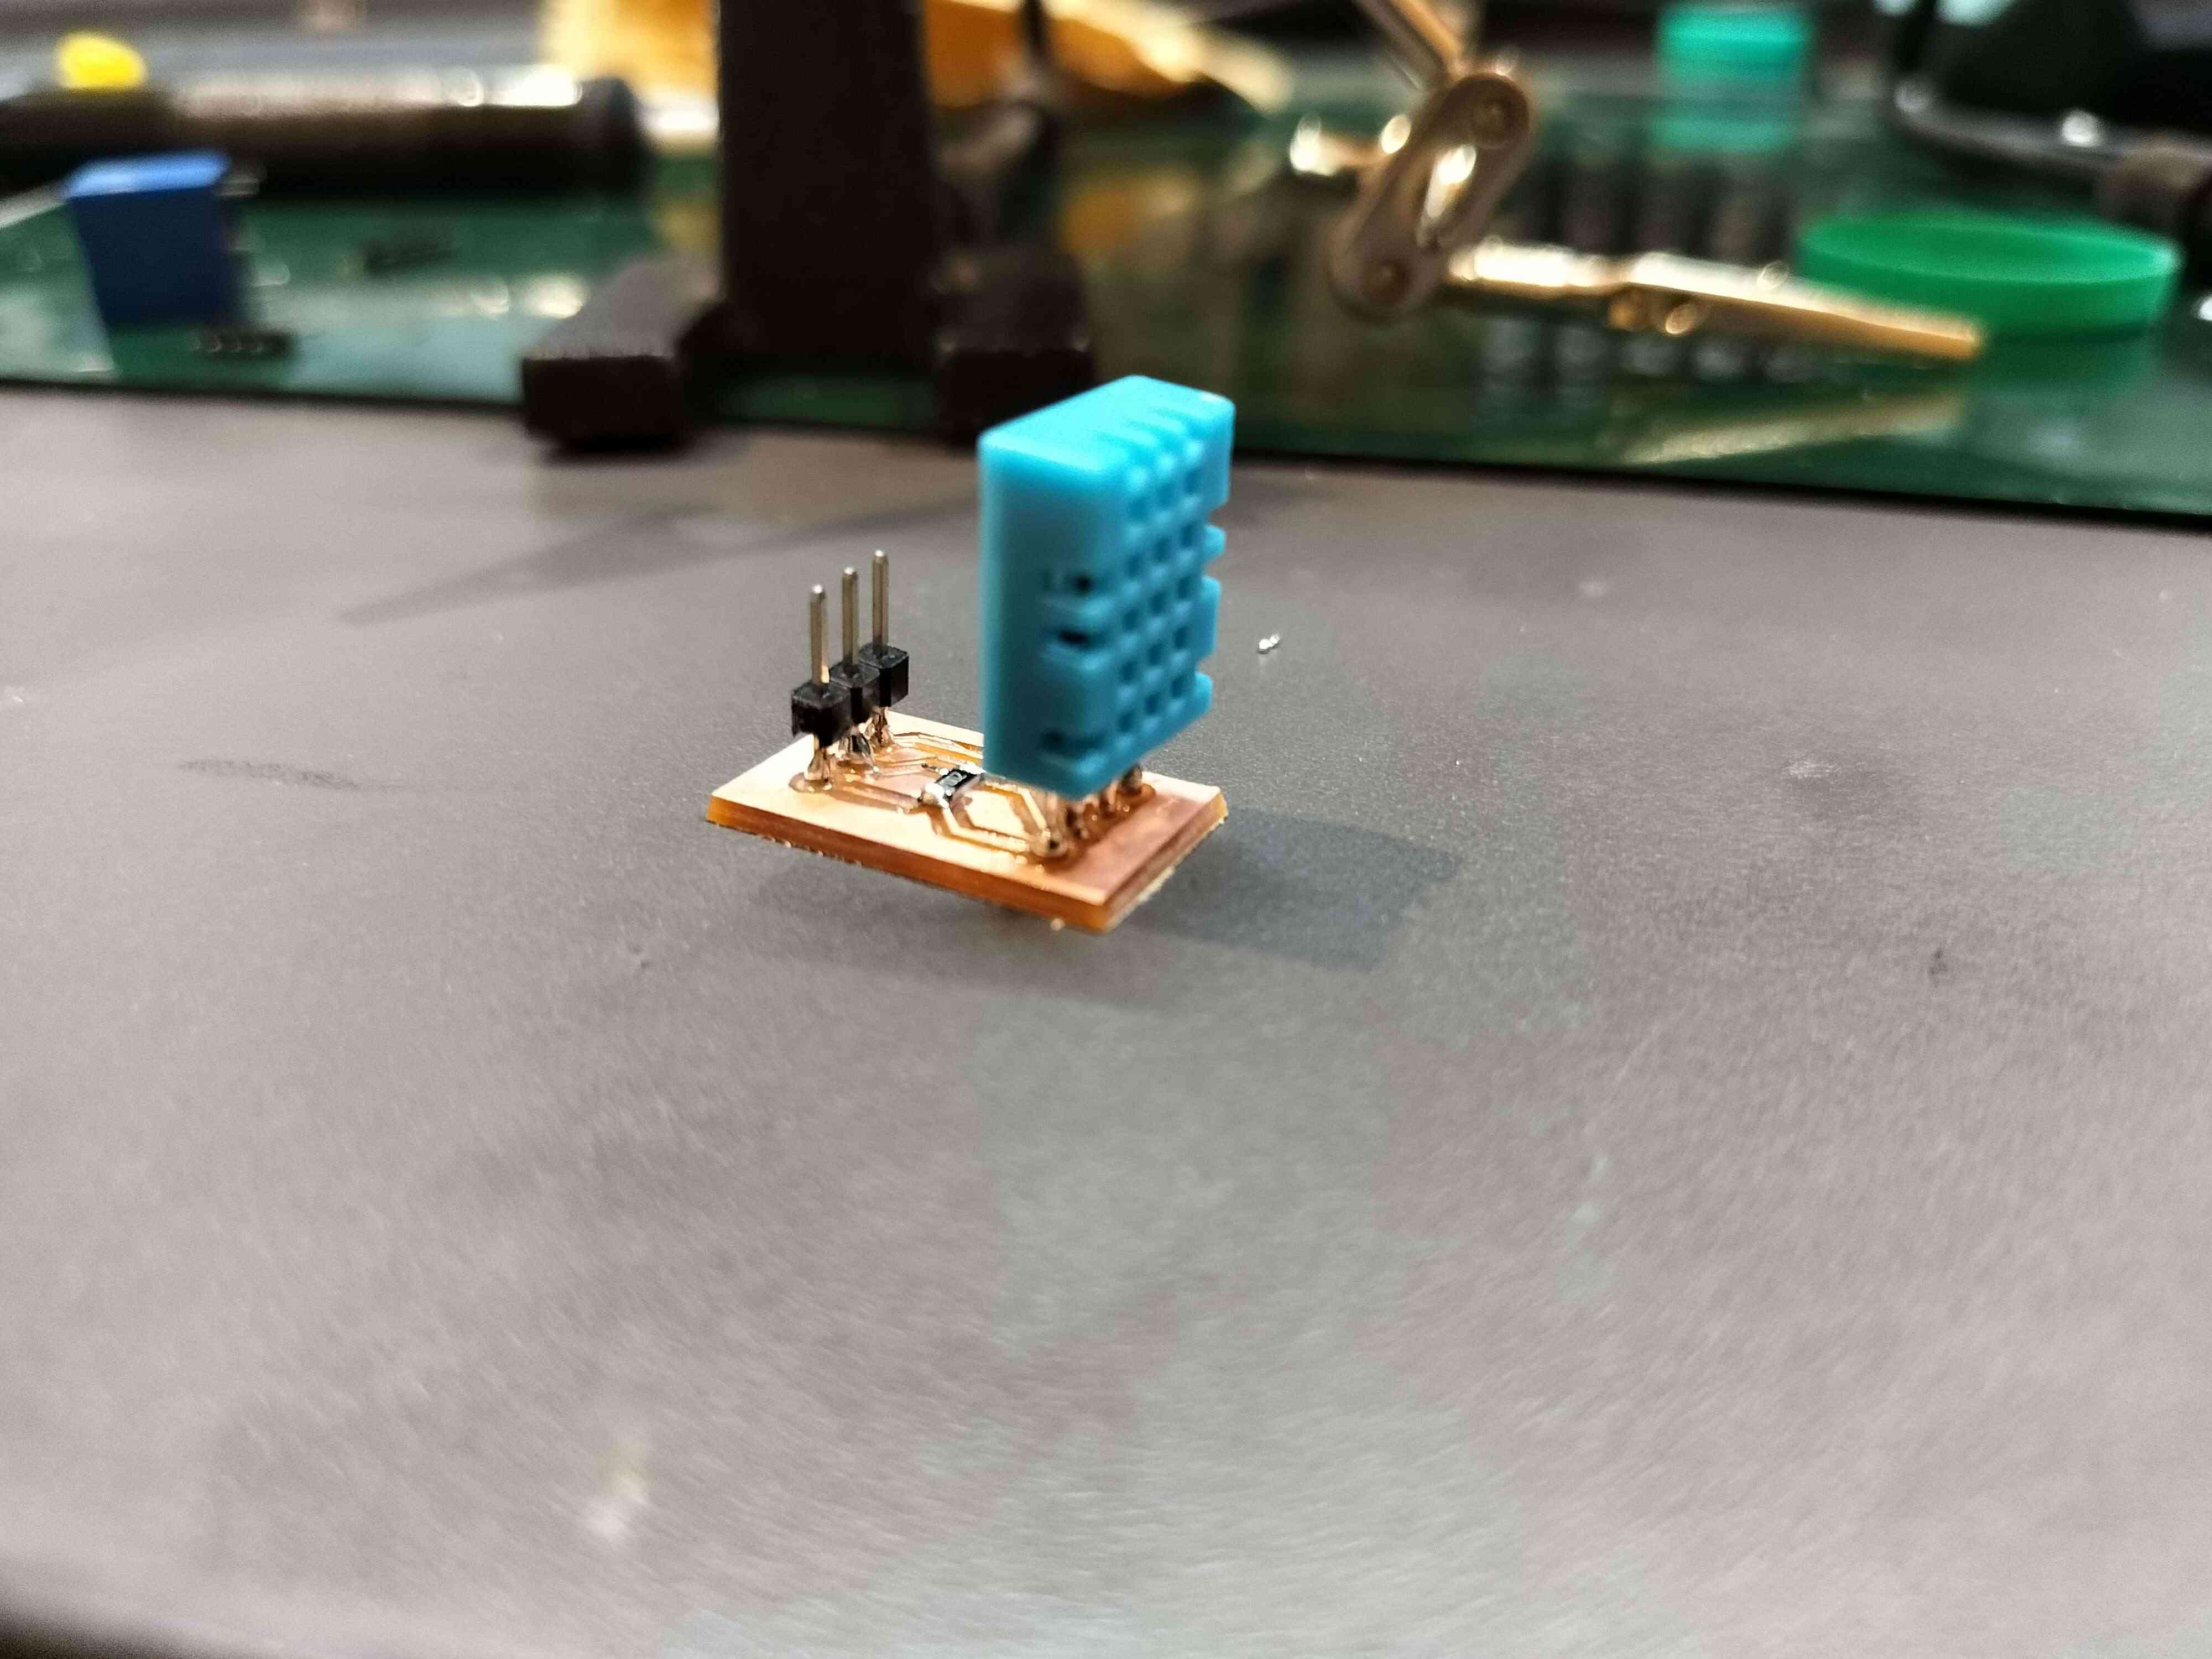
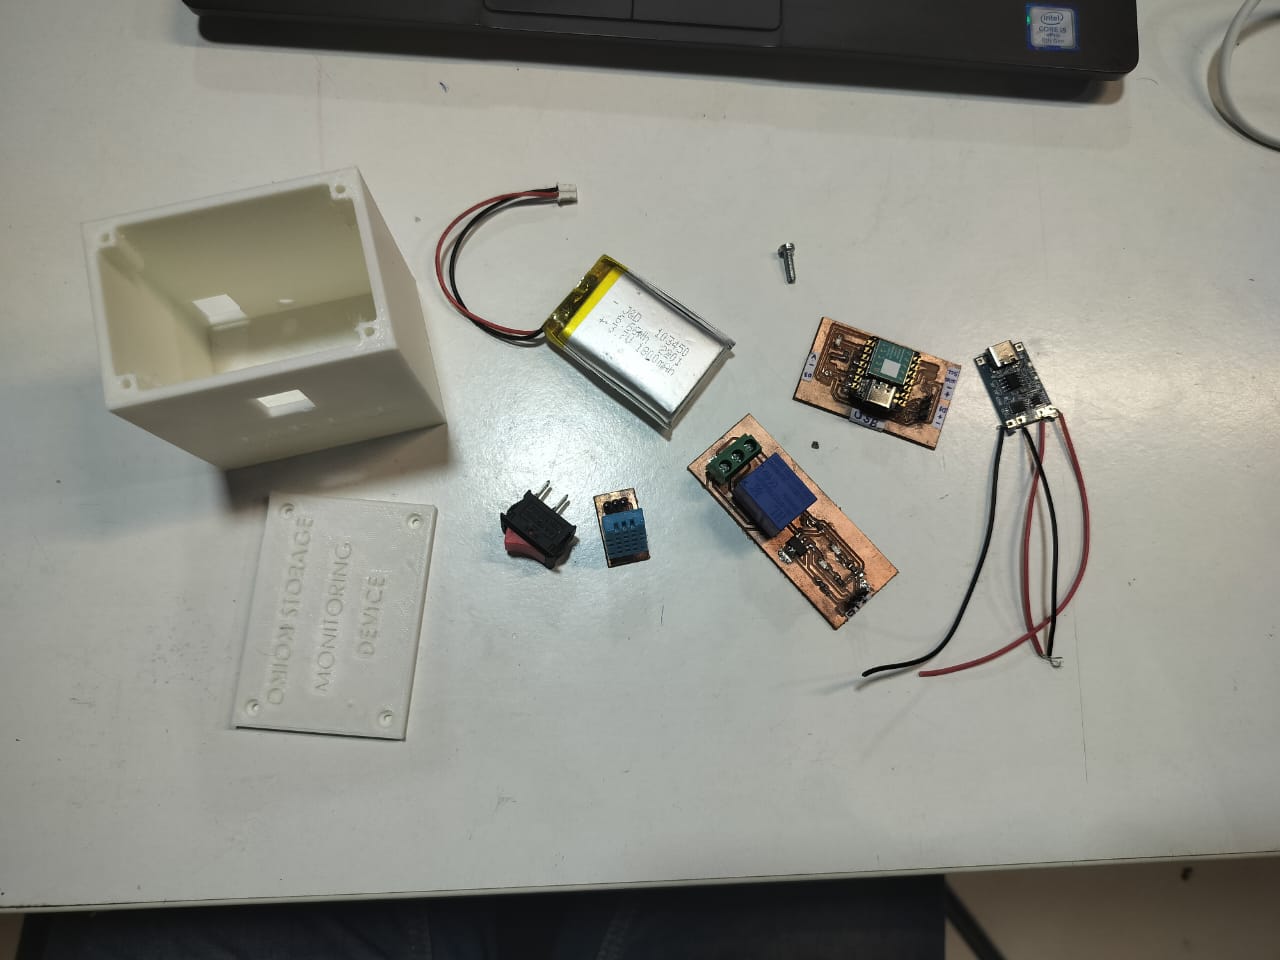
10. Soldering and Assembly
After receiving the fabricated PCB, I carefully soldered the components like microcontroller (XIAO ESP32S3), DHT11 sensor, and power components using a soldering iron and flux.
What I Learned
I done this work in the previous week 10 of assignments.
I done this work in the previous week 9 of assignments.
I done this work in the previous week 8 of assignments.
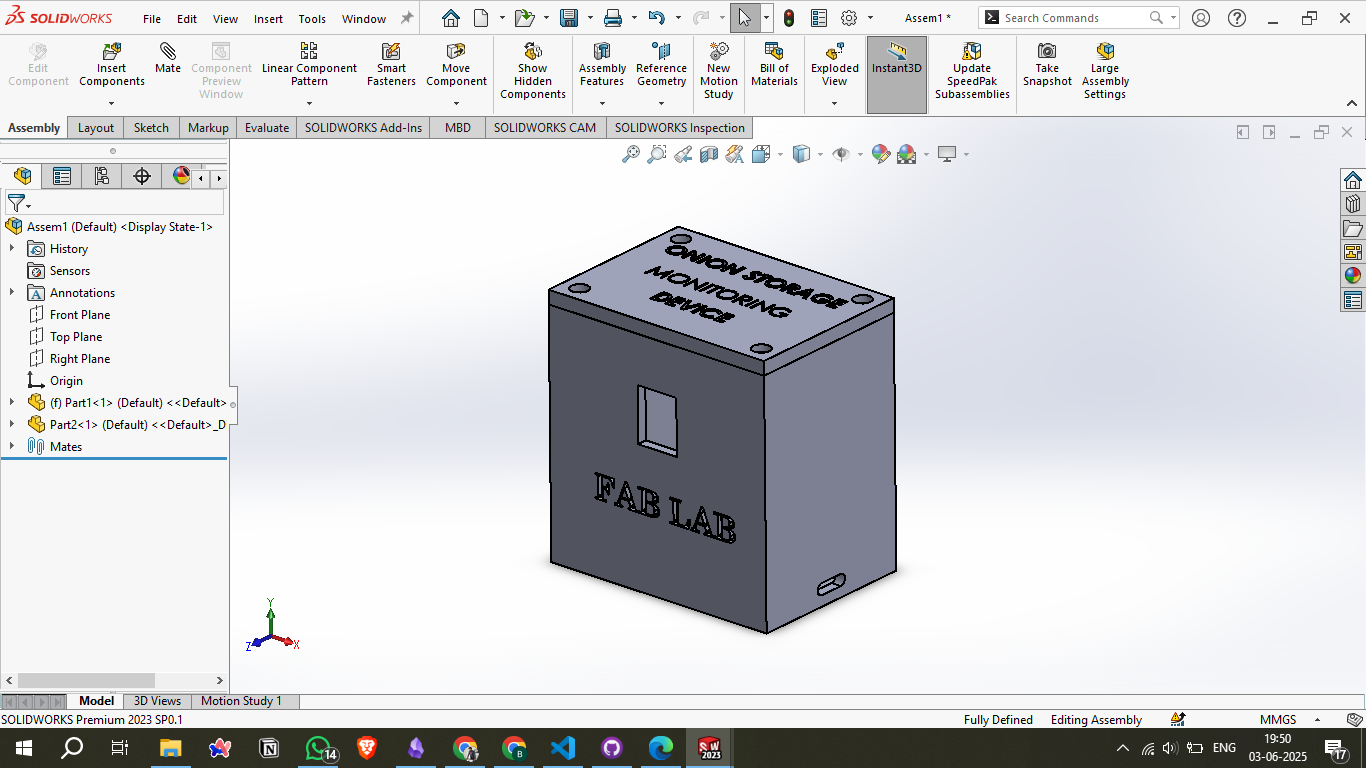
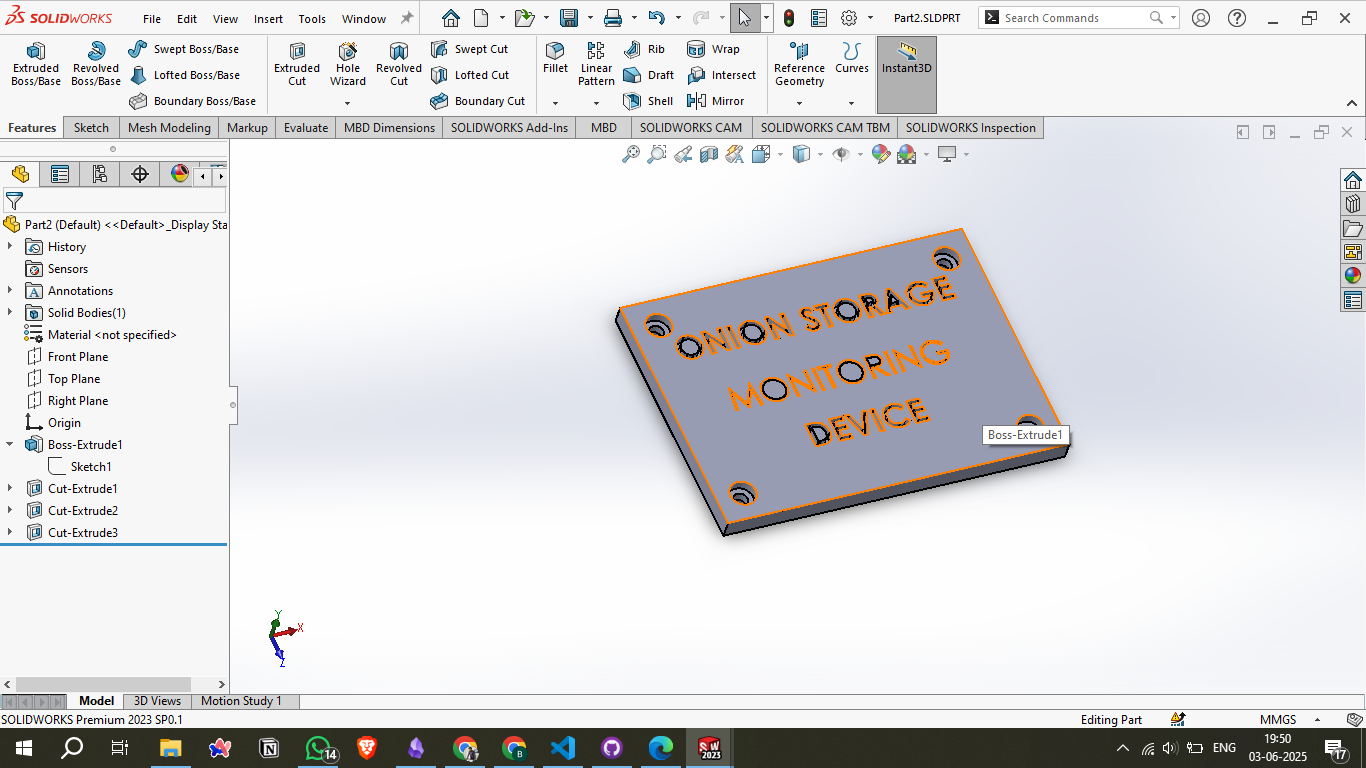
11. CAD Designing
I used Solidworks to design the 3D enclosure for the electronics and mounting parts for the sensor and fan. The design was done with parametric constraints for easy editing.
What I Learned
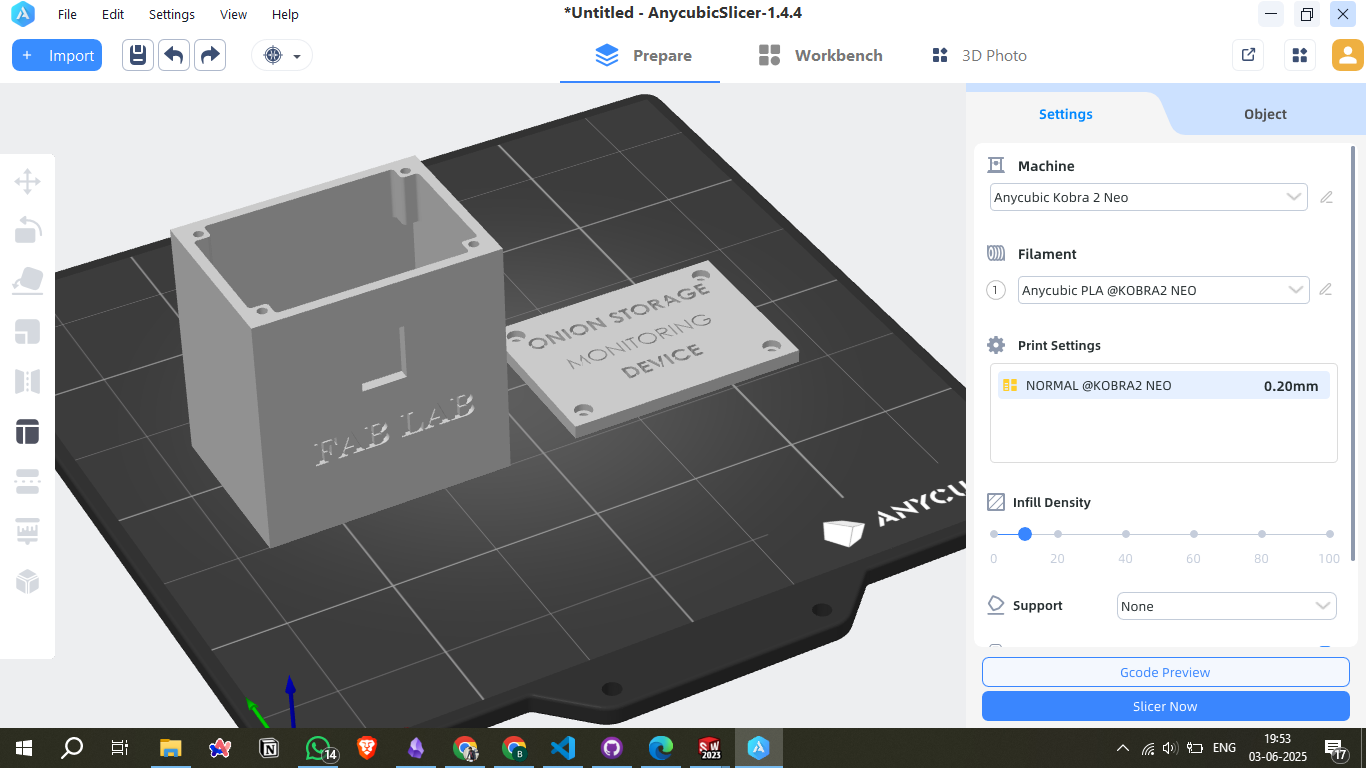
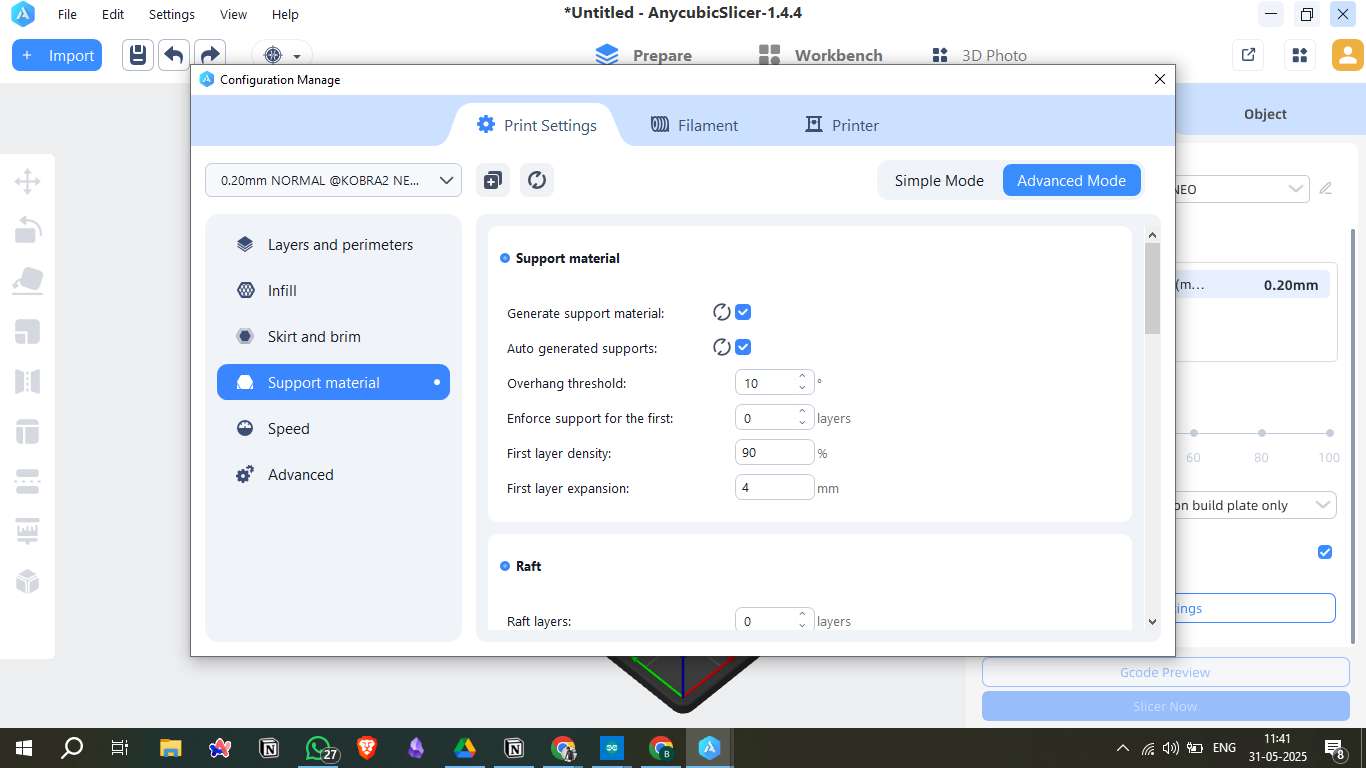
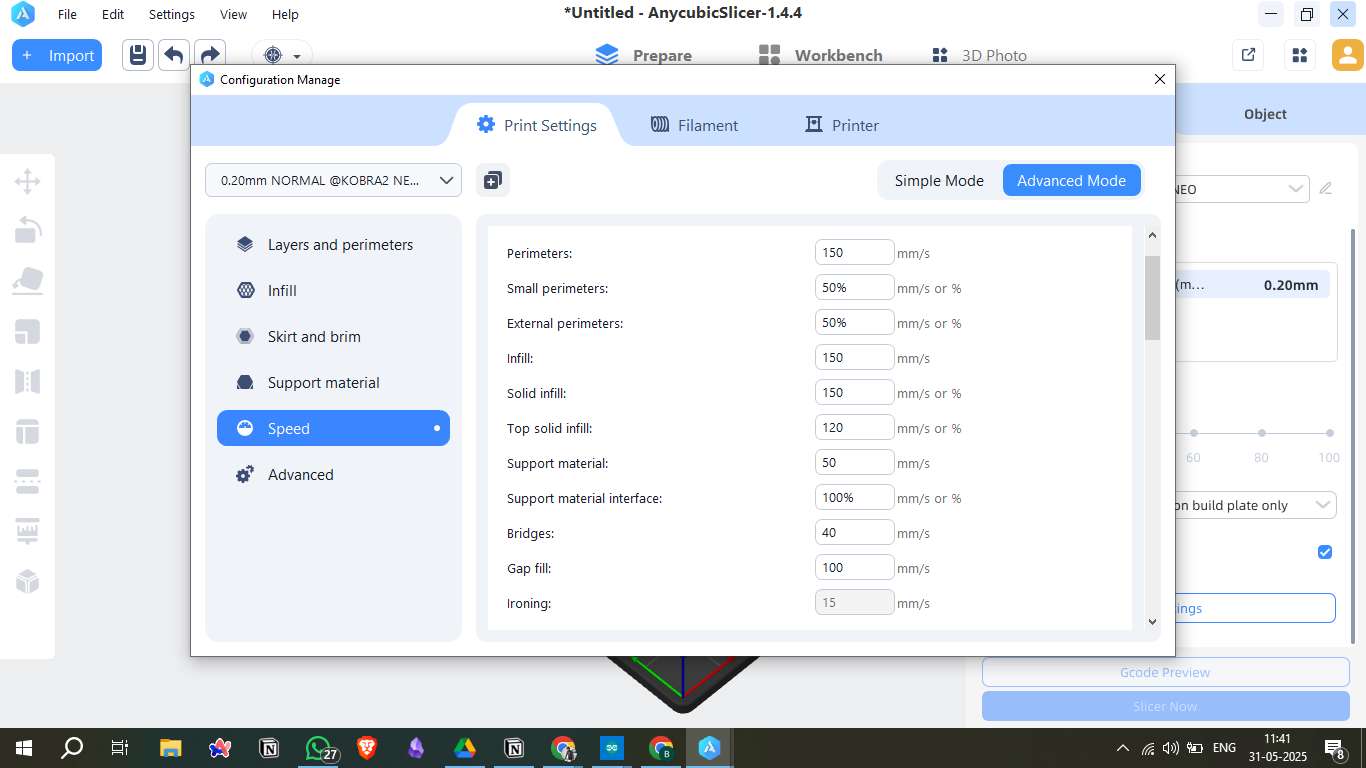
12. 3D Fabrication
I fabricated the 3D-printed enclosure using PLA on an FDM printer. I printed multiple iterations to improve fit and durability.
What I Learned
13. System Integration
I assembled all the components into the 3D-printed enclosure. Connected the sensor, microcontroller, relay, and power system. Performed testing to ensure system worked as expected.
What I Learned
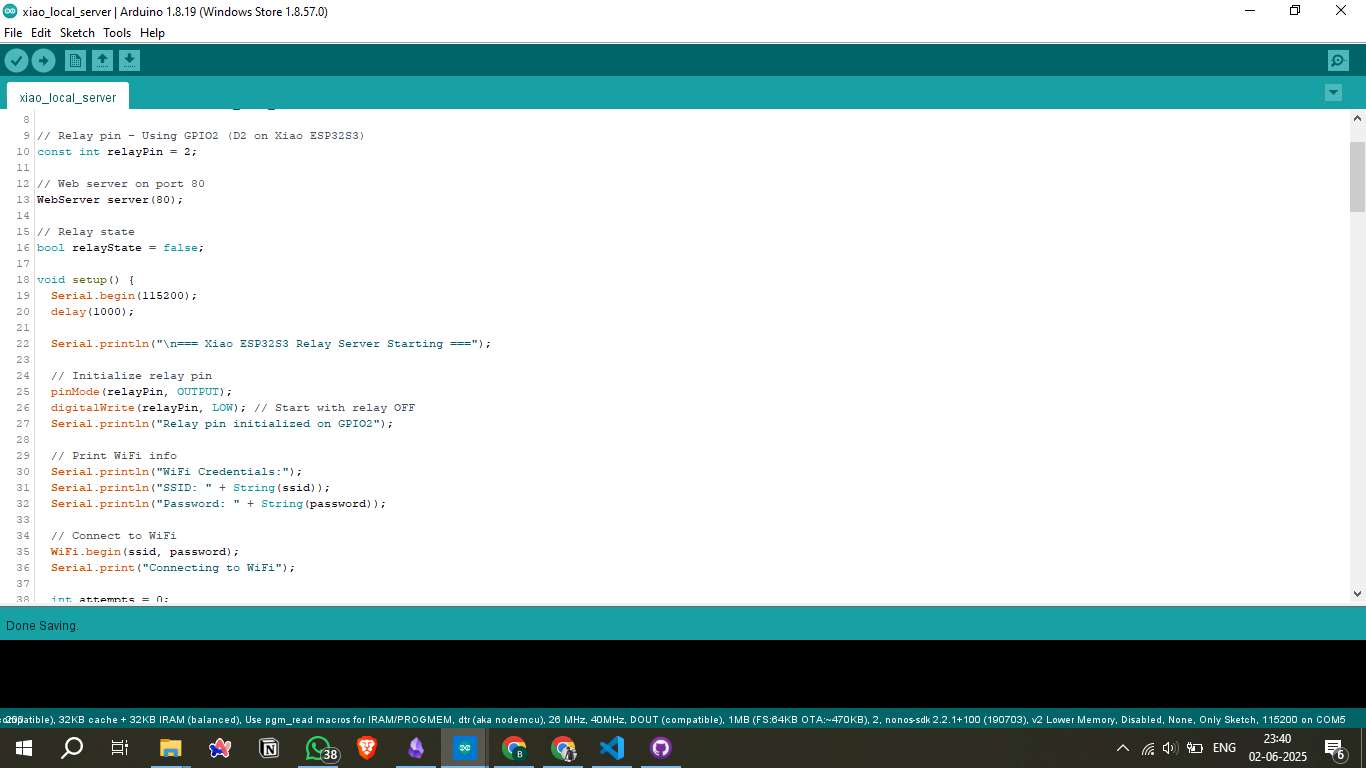
14. Coding
I wrote the embedded code using Arduino IDE. The code reads temperature and humidity from DHT11 and controls the fan using a relay based on set threshold values.
What I Learned
Final Video
Presentation Video
Credits
Subhash Labade
For sharing the initial concept and inspiring the foundation of this project.
Charath
For motivating and guiding the project from its early stages.
Vrushabh
For identifying technical challenges and helping resolve the Integration hardwares.