Output devices

Let's go!

Silvana

I really loved this week of testing sensors, I made another board to test other types of sensors and everything works as I want.


WEEK GROUP Sensor to test Group assignment MANUFACTURING THE PIECE IN THE ROLAND OLEDDISPLAY RECOMMENDATIONS Global Conclusions

Assignments

Our tasks for this week are:

    Individual assignment:
  • Add an output device to a microcontroller board you've designed, and program it to do something
  • Group assignment:
  • Measure the power consumption of an output device

Sensor to test


Temperature and Humidity Sensor DHT11 Module KY-015.


The DHT11 or KY-015 module is a digital signal output temperature and humidity sensor, it has an ultra compact size, it is low power consumption and has great utility when it is required to detect two magnitudes at the same time. support for the "Single bus" protocol. On the hardware side, it is only necessary to connect the power VCC pin to 3 or 5V, the GND pin to ground (0V) and the data pin to a digital pin.

SPECIFICATIONS AND FEATURES

  • Operating voltage: 3.5 V to 5.5 V
  • Humidity Measurement Range: 20% to 90% RH (Humidity Measurement Error: +-5%)
  • Temperature measuring range: 0 ºC to 50 ºC
  • Humidity measurement resolution: 1% RH
  • Temperature measurement error: +-2 °.
  • Signal transmission range: 20 meters
  • Dimensions: 19 mm x 17 mm x 19 mm
  • Temperature measurement resolution: 1 ºC

OLED DISPLAY 0.96" SPI 128*64 SSD1306.


A great little 128*64 pixel OLED display, perfect for displaying spectacular graphics on laptops. OLED displays are noted for their high contrast, minimal power consumption and good image quality. The 0.96" SPI SSD1306 oled display has a resolution of 128*64 pixels, allowing you to control each pixel individually and display both text and graphics. In addition to being OLED type does not need backlight (Backlight) as the LCD, which makes its power consumption is much lower and increases its contrast.

SPECIFICATIONS AND FEATURES

  • Operating Voltage: 3V - 5.5V DC
  • Driver: SSD1306
  • Interface: SPI
  • Humidity measurement resolution: 1% RH
  • Resolution: 128*64 pixels.
  • Monochrome: white pixels (black background)
  • Visible area (display): 23*11.5 mm
  • Working temperature: -30ºC ~ 70ºC
  • Dimensions: 27*27*4.1mm

The DHT11 sensor

The DHT11 uses a capacitive sensor to measure relative humidity and a thermistor to measure temperature. These components work together to provide accurate temperature and humidity measurements.

Imagen

Communication interface: The DHT11 sensor uses a single-wire protocol to communicate its measurements with other devices, such as microcontrollers or development boards. This communication protocol is relatively simple and easy to implement.

Imagen

Due to its low cost and ease of use, the DHT11 is used in a variety of applications, greenhouse climate control systems, indoor humidity monitoring devices.

the DHT11 provides reasonably accurate measurements for many applications, with a typical accuracy of ±2°C for temperature and ±5% for relative humidity

OLED Display

An OLED (Organic Light-Emitting Diode) Display is a type of display that uses organic diodes to produce light. Unlike traditional LCD displays, which require a back light source, OLEDs emit light of their own when an electric current passes through them.

Imagen
Imagen

OLEDs have very fast response times compared to LCD displays, making them ideal for applications where smooth motion playback is required, such as video game displays and televisions.

In theory, OLEDs can consume less power than LCDs, especially when displaying content with dark or black backgrounds, as the off pixels do not consume power. However, power consumption also depends on brightness and the content displayed on the screen.

Light Sensor LDR

A light sensor module, also known as a photodiode or ambient light sensor, is an electronic component that detects the intensity of light present in its environment.

Imagen
Imagen

Sensing principle: Photodiodes or phototransistors use the photoelectric effect to generate current when light strikes them. This phenomenon involves the release of electrons in the semiconductor material when photons of light strike them, thus generating an electric current.

Calibration and compensation: Some light sensors may require calibration and compensation to ensure accurate measurements in a variety of lighting conditions. This may involve adjusting sensor output values to match known light intensity measurements under different conditions.

Group assignment

Experimenting with electronic equipment

March 23
We went to UCSUR (Universidad Cientifica del sur), we all started to see what sensors we have, we saw how they work, each one brought his programming for his sensor and we could do the tests.

Miniware DS213

The Miniware DS213 is a compact portable oscilloscope designed for hobbyists and professionals who require mobility in their projects. With a 3-inch color LCD display, two analog channels, and features such as SD card storage and automatic measurement, it offers a convenient solution for viewing and analyzing signals in the field or in hobby projects. Its portability, combined with basic features and an intuitive user interface, make it an attractive option for low-frequency applications and projects on the move.

The main thing is to understand how to use the oscilloscope and then obtain accurate measurements. Recently, we performed tests on a servo motor using the Miniware DS213 Portable Mini Oscilloscope. During these tests, we focused on key aspects such as frequency, amplitude and voltage, with the aim of understanding its behavior and verifying its correct operation. Using the oscilloscope, we were able to observe in detail the waveform generated by the servomotor, which allowed us to analyze aspects such as stability, response to different commands and consistency in its operation. This information was invaluable to ensure that the servomotor was operating within the expected parameters and to identify any anomalies that might require attention.

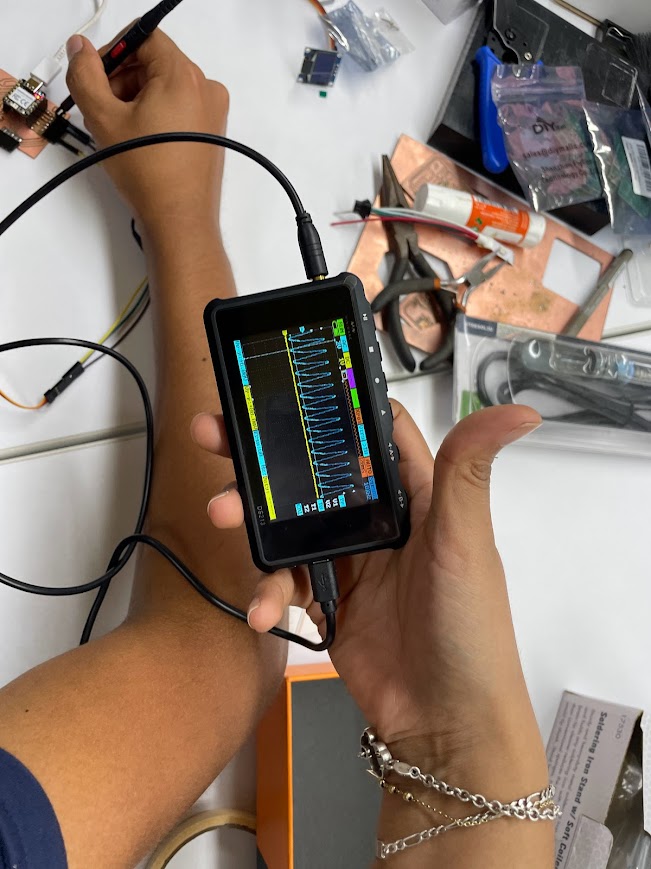
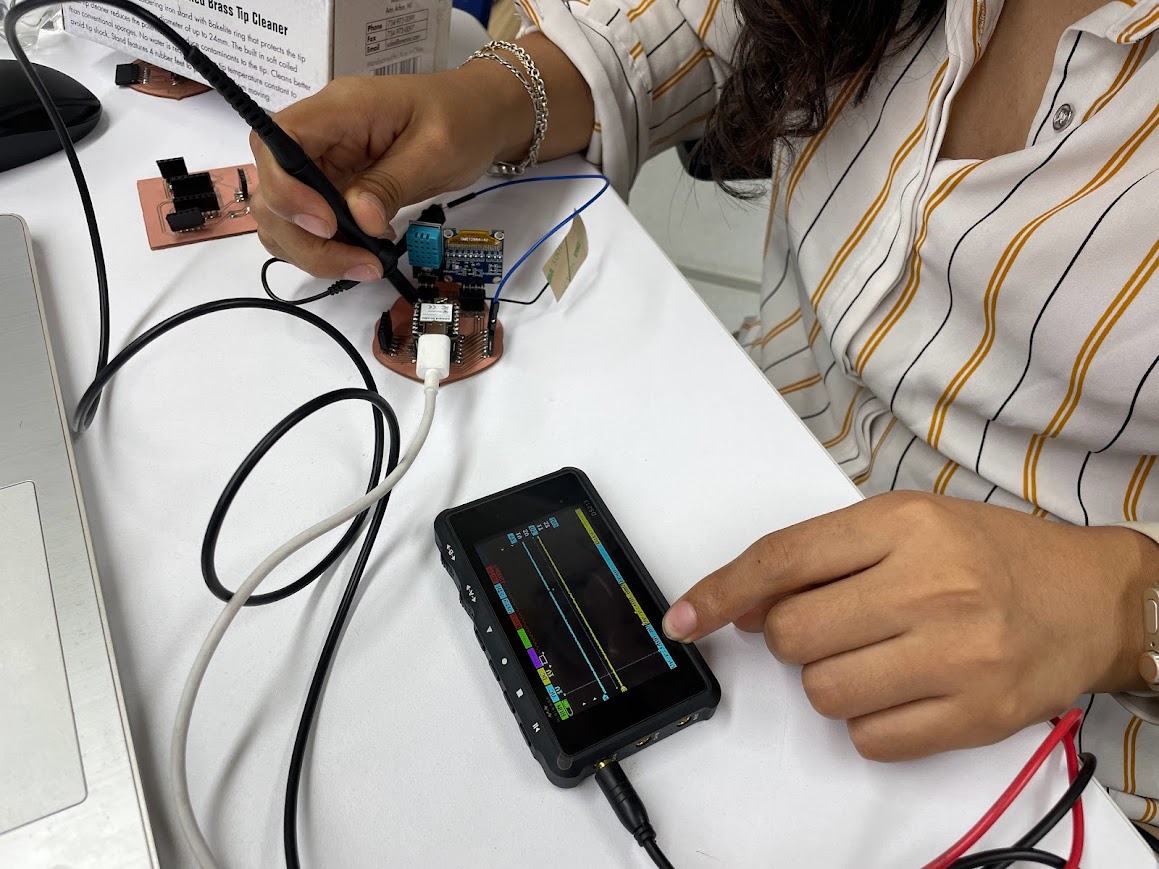
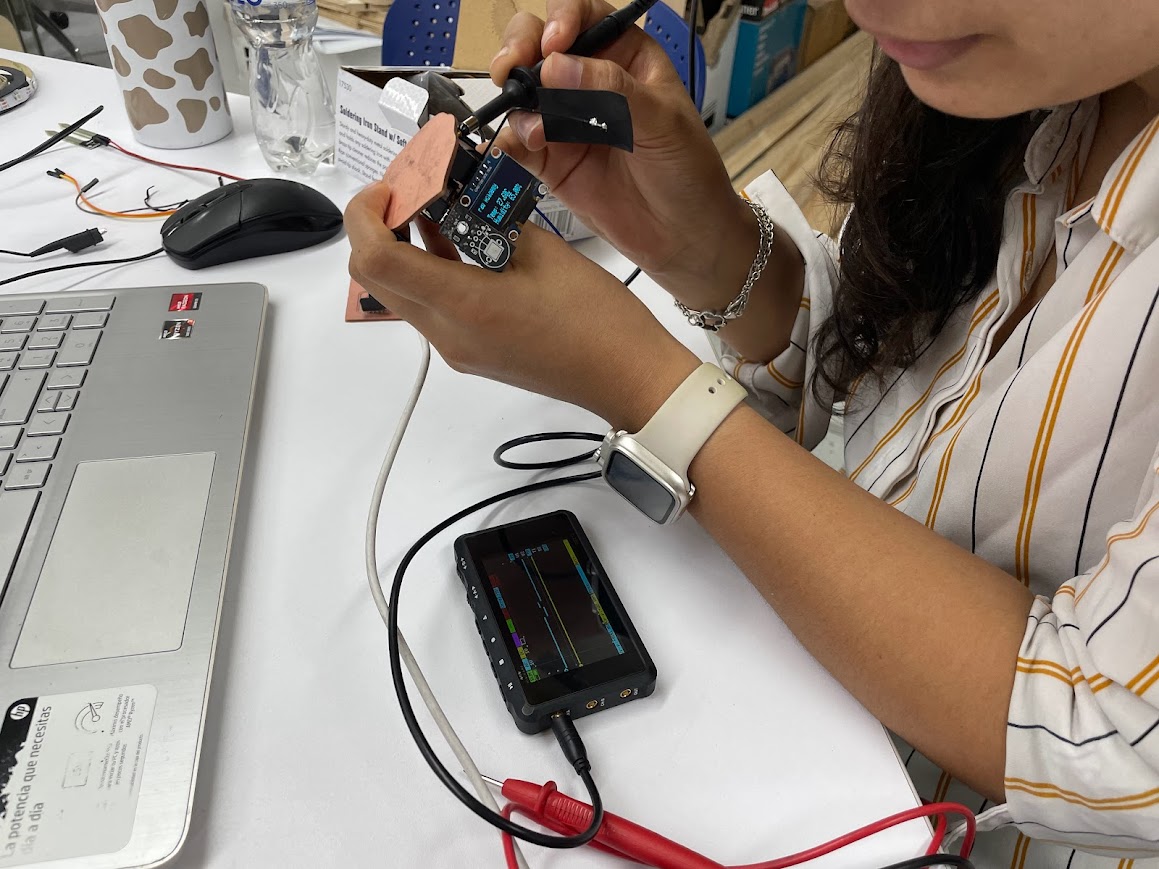
In summary, the use of the oscilloscope allowed us to perform extensive testing and obtain accurate measurements, giving us greater confidence in the quality and performance of the servo motor.

Global Open Time


During the Open Global Time session at the Fab Academy, Adrian taught us how to make measurements with the multimeter. We focused on measuring both voltage and amperage of circuits. Adrian walked us through the steps necessary to set up the multimeter correctly and make accurate measurements. We learned how to properly connect the multimeter probes to the measurement points on the circuit and how to interpret the values displayed on the multimeter screen. This experience was instrumental in understanding how to perform basic electrical measurements and provided us with practical skills that we will be able to apply in our future projects.


Adrian provided us with a detailed overview of his documentation, where he documented his entire process of designing, manufacturing and testing electronic boards. Adrian shared his experiences on how he created his boards from scratch, including schematic design, component selection, track routing and PCB fabrication. He showed us how he used the multimeter to measure continuity of connections, verify proper connection of components, and validate the operation of his circuits. In addition, Adrian walked us through his electrical schematics, explaining the purpose and function of each component in the circuit. This detailed documentation provided us with a complete picture of his work process, from idea conception to practical implementation, and inspired us to adopt similar practices in our own projects.


Multimeter

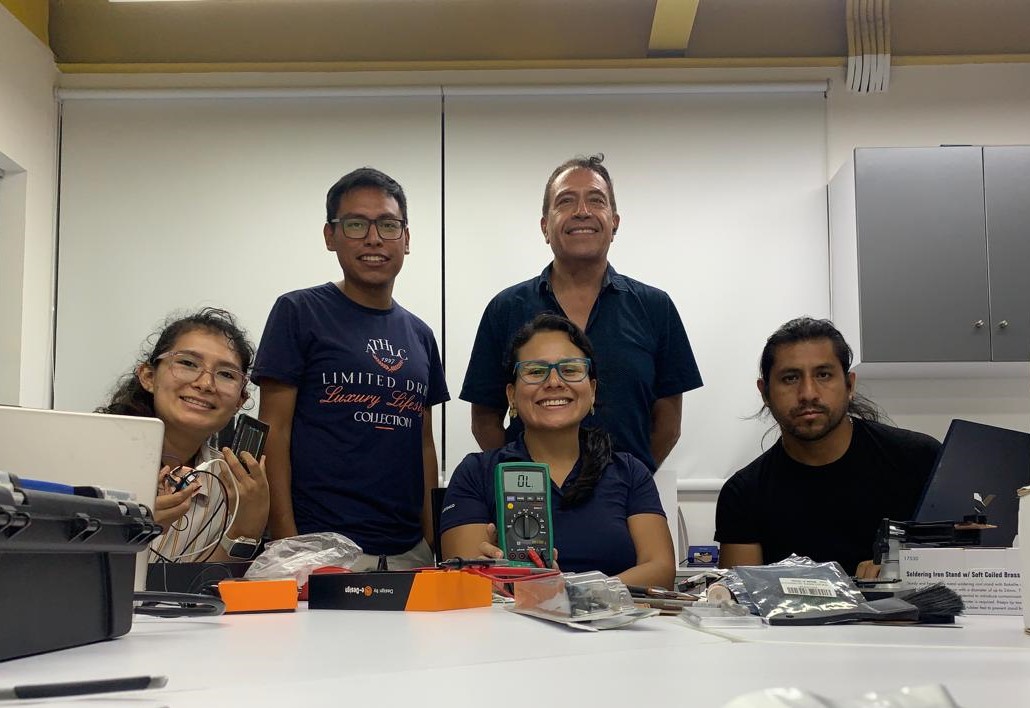
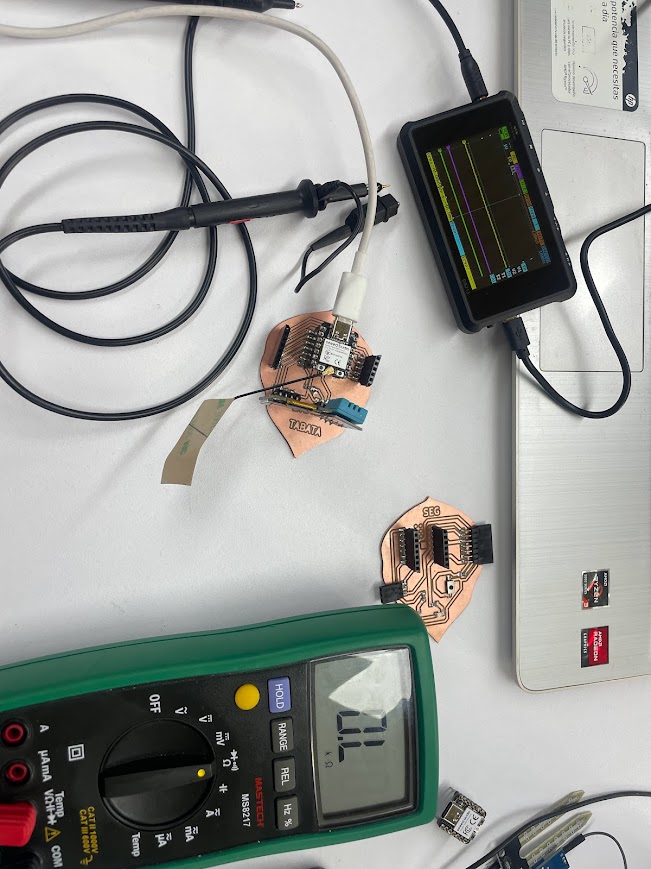
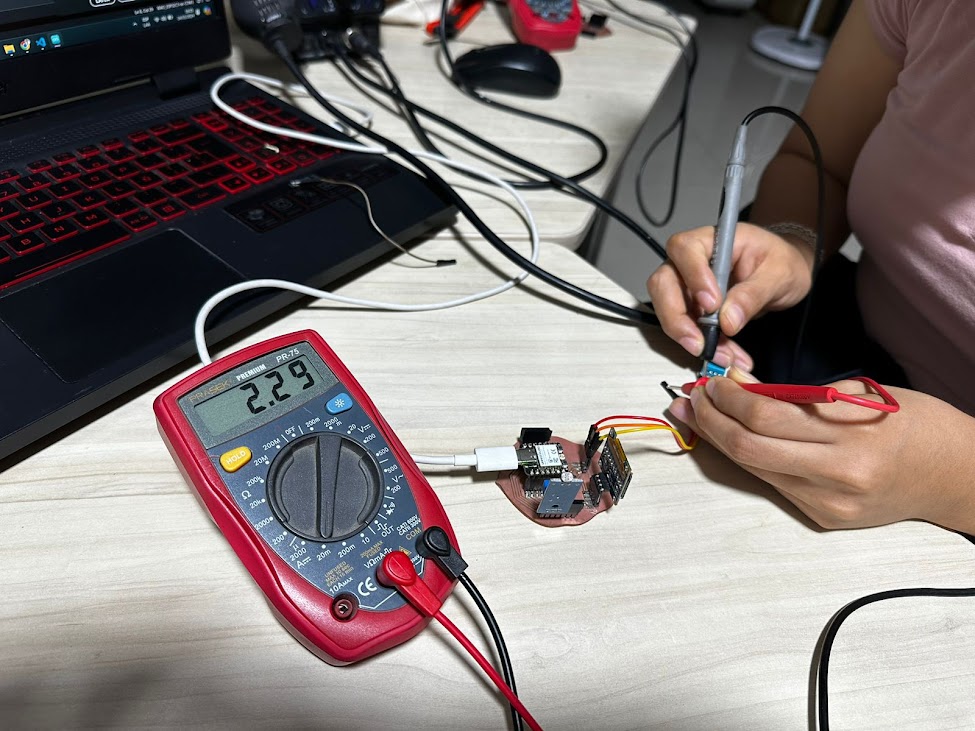
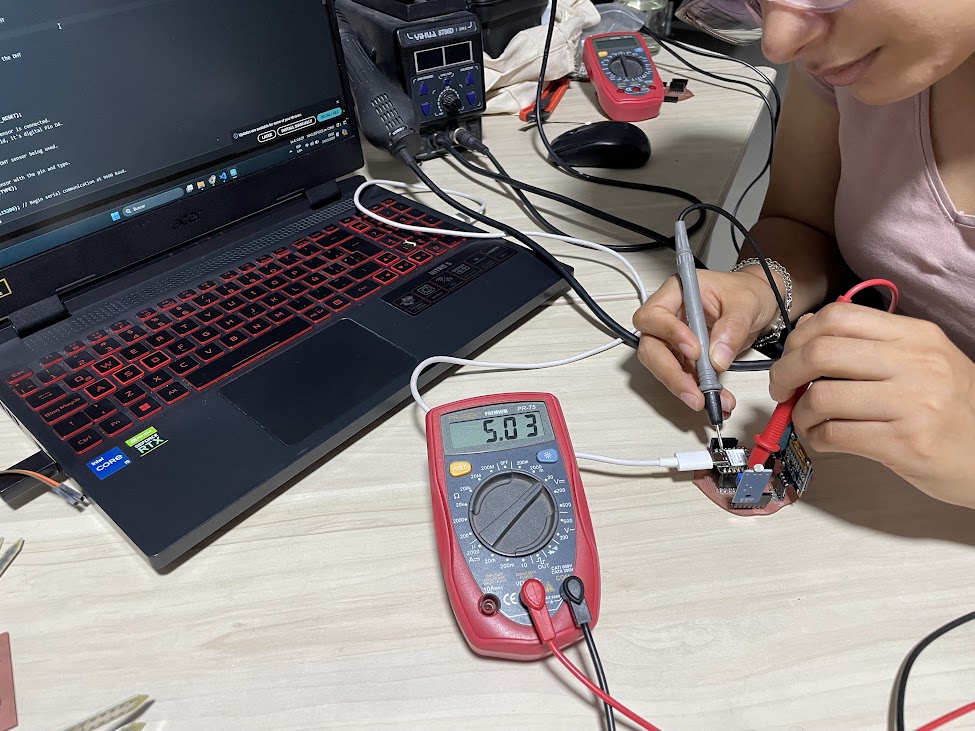
The multimeter is like the electrical detective of our circuit. It helps us make sure everything is working as it should. 
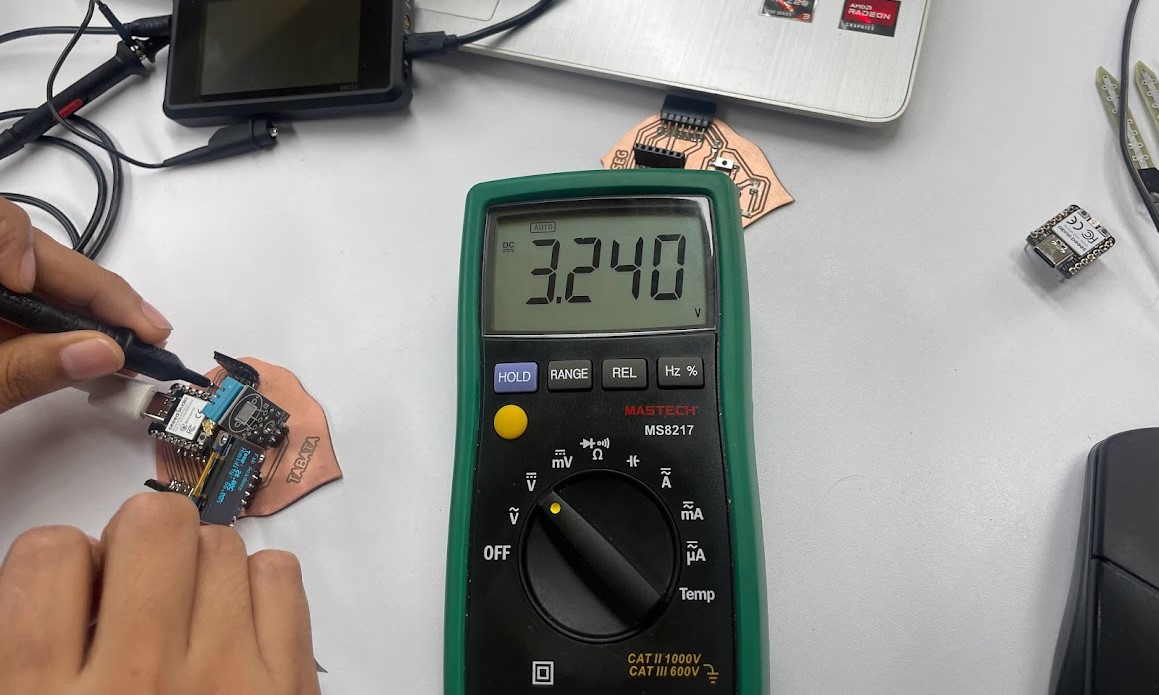
For example, we can use it to check that the power source is supplying the correct voltage for our circuit to work smoothly. It also helps us measure the voltages in different parts of the circuit, such as those going to our temperature and humidity sensors, as well as the OLED screen.

In the image, you can see the multimeter that reads 3.24 V, verifying the voltage that reaches the OLED screen. I am meticulously focused, making sure there are no connection problems between the components and the board. Holding the leads of the multimeter, I am measuring the voltage accurately.

When measuring the supply voltage to the humidity sensor with a multimeter, I noticed that it was being supplied with 3.3V, as intended, and the reading was 3.24V, which appears to be within the expected range

To measure the amperage on the DHT11 sensor, I first set my multimeter to measure direct current (DC) and selected the appropriate range. I connected the multimeter in series with the circuit that powers the sensor, making sure to connect the leads correctly. As I applied power to the circuit, I observed the reading on the multimeter, which gave me the amperage being drawn by the sensor at the time. This measurement is crucial for understanding the power consumption of the sensor and can help in planning power management in my project, as well as diagnosing potential problems in the circuit or sensor.

In my experience measuring the voltage on my LDR sensor, I dove into hands-on practice with the multimeter, a fundamental tool for understanding the behavior of electronic components. Carefully, I selected the appropriate mode on the multimeter and connected the test leads in parallel with the circuit powering the sensor. Excitement grew as I applied power to the circuit and watched the multimeter respond, displaying the voltage generated by the LDR sensor in response to ambient light. It was fascinating to see how this little piece of technology reacted to different levels of light, and how the multimeter provided me with accurate data about its behavior. This practice taught me a lot about the importance of accurate measurements and how they can reveal crucial information about the operation of electronic devices in my future projects

Recently, I have been further investigating the operation of my humidity sensor, and decided to use an oscilloscope to analyze the signal on the track of my board. By looking at the signal in greater detail, I was able to detect any irregularities or fluctuations in the sensor output. This approach allows me to accurately assess how the signal varies in response to changes in the humidity of the environment, which can shed light on possible discrepancies in the sensor readings. This more specific test will help me identify any technical problems and make necessary adjustments to improve the accuracy of the humidity measurements.

The peak-to-peak value (Vpp) of the signal, which is 400 mV, is shown here. This data is crucial for understanding the amplitude of the signal and any variations that may indicate changes in ambient humidity. By carefully analyzing this information, I will be able to adjust my setup and make the necessary corrections to ensure accurate and consistent humidity measurements with my sensor.

Here measuring the voltage delivered by the xiao esp32c3a

Here measuring the oled display signa.

Individual assignment

Redraw the board


Since we already added the FabLAb library, we are going to look for our components, first the xiao, in my case it is XiaoEsp32C3

Descripción de la imagen 1

Now we realize that the symbology does not appear, so we are going to add it in manage fingerprint libraries Descripción de la imagen 2

We click on this + symbol to be able to add a new module and be able to place the library, you have to close it so that it can load the tracks.

Descripción de la imagen 3

We look for the file

Descripción de la imagen 1

View of the three designs that were tested

Descripción de la imagen 2

Placing my pins, it actually needs 7


Descripción de la imagen 3

Footprint editor


Inspect the measurement of the button

It was already looking better

Here updating the schematic

Descripción de la imagen 1

Here we can see the list of the components that will be seen

Descripción de la imagen 2

Schematic design: Use KiCad to design the schematic of your board. Place the necessary components, s uch as the DHT sensor, OLED display, fan, and LDR sensor, and connect them properly to the ESP32-C3. Be sure to check the ESP32-C3 specifications to assign the correct pins.

While designing, I opened the symbol field table to make sure I selected the correct components and checked their specifications.

I updated the board from the schematic so that I could visualize the connection paths. This allowed me to make sure that the components were correctly connected to the ESP32-C3 and that there were no errors in the connections.

After correctly arranging the connection pins on the schematic, I proceeded to carefully review the final design to make sure that all connections were correctly established.

After about 30 minutes of meticulous analysis and adjustments, I realized that some leads were crossing each other, which could have generated unwanted short circuits or interference in the circuit. To remedy the situation so that I could complete the board, I considered several options and opted to use a 0 rated resistor as a temporary bridge to facilitate the connection between two crucial leads.

Open the 3D viewer: Use a 3D viewer compatible with the files generated by KiCad to visualize the 3D representation of your board. KiCad offers an integrated 3D viewer, but there are also other external viewers that you can use.

mods configuration

After designing the board in KiCad, I generated the 3D rendering to see that all the tracks look right and then saved it as an SVG file. I then imported this file into Moods and used the invert colors function to get a version with the inverted appearance. This process allowed me to visualize the board with a different aesthetic, making it easier to identify components and connection paths in the design.


After adjusting the values in the Mill Raster 2D setup, I proceeded to perform the calculation to obtain the updated results. By editing these values, I was able to refine the milling parameters and obtain a more accurate and efficient machining process. This modification in the configuration allowed me to better adapt the milling strategy to the specific needs of my project, thus improving the quality and accuracy of the final result.

After performing various tests and adjustments to the milling process, I discovered that a depth of cut of 0.28 mm is the most suitable for my needs. This setting has emerged as the optimal choice after meticulous experiments and evaluation of the results obtained. With this adjusted depth of cut, I am confident that I will be able to achieve the desired precision and quality in my future milling operations. I am excited to apply this optimized setup in my upcoming projects and see how it improves the performance and quality of my millings.

After adjusting the cutting setup, where the tool diameter was set to 0.79248, the cut depth to 0.6096 and the max depth to 1.8279, I proceeded to calculate the updated parameters. These settings allowed me to more precisely define how the cutting tool would interact with the material, thus optimizing the machining process for more accurate and consistent results.


Manufacturing the piece in the Roland

NEW ELECTRONICS DESIGN


Loading the file that gave me mods on the Roland

Sending my design to Roland

Adding solder paste, I discovered it is easier with this paste.

Here is a small mistake of not turning my blade for cutting.

Program OLEDDISPLAY

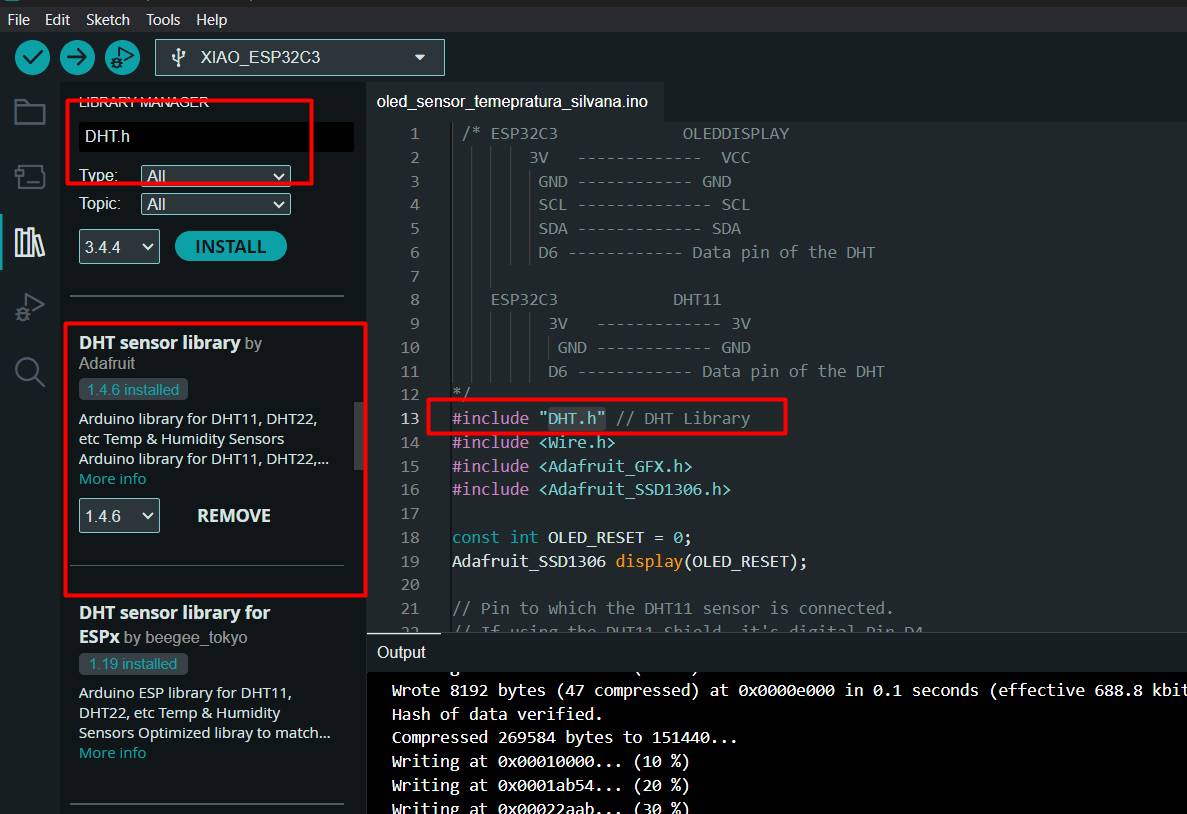
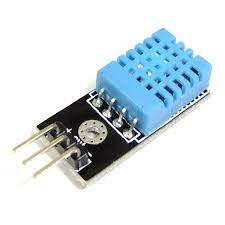
To make sure I got accurate readings from my DHT sensor on the Arduino, I installed the DHT.h library carefully and correctly. First, I opened the Arduino IDE and navigated to the "Sketch" menu, then "Include Library" and finally "Manage Libraries". In the search box, I entered "DHT" and found Adafruit's DHT Sensor Library. After selecting it, I clicked "Install" and waited for the process to complete.

Código para el Arduino 2


 /* ESP32C3             OLEDDISPLAY
        3V   -------------  VCC
         GND ------------ GND
         SCL -------------- SCL
         SDA ------------- SDA
         D6 ------------ Data pin of the DHT

    ESP32C3            DHT11
          3V   ------------- 3V
           GND ------------ GND
          D6 ------------ Data pin of the DHT
*/
#include "DHT.h" // DHT Library
#include < Wire.h>
#include < Adafruit_GFX.h>
#includ < Aedafruit_SSD1306.h>

const int OLED_RESET = 0;
Adafruit_SSD1306 display(OLED_RESET);

// Pin to which the DHT11 sensor is connected.
// If using the DHT11 Shield, it's digital Pin D4.
const int DHTPIN = D6;

// Specify the type of DHT sensor being used.
#define DHTTYPE DHT11

// Initialize the sensor with the pin and type.
DHT dht(DHTPIN, DHTTYPE);

void setup() {
  Serial.begin(115200); // Begin serial communication at 9600 Baud.
  Wire.begin();
  
  display.begin(SSD1306_SWITCHCAPVCC, 0x3C);
  display.display();
  delay(2000);
  display.clearDisplay(); 
  dht.begin(); // Start DHT communication.
}

void loop() {
  // The DHT11 sensor provides a new reading every 2 seconds,
  // so there's no need to constantly loop in the program.
  delay(2000);

  // Read humidity value.
  double humidity = dht.readHumidity();
  // Read temperature in Celsius.
  double temperatureC = dht.readTemperature();
  // Read temperature in Fahrenheit.
  // The boolean parameter controls whether
  // the temperature is displayed in Fahrenheit or Celsius.
  double temperatureF = dht.readTemperature(true);

  // Check if the values were read successfully.
  if (isnan(humidity) || isnan(temperatureC) || isnan(temperatureF)) {
    Serial.println("Error reading data.");
    return;
  }

  display.clearDisplay();
  display.setTextSize(1);
  display.setTextColor(WHITE);

  display.setCursor(5, 0);
  display.println("Fab Academy");

  display.setCursor(5, 15);
  String tempValue = String(temperatureC);
  display.println("Temp: " + tempValue + "C");

  display.setCursor(5, 23);
  String humValue = String(humidity);
  display.println("Humidity: " + humValue + "%");

  display.display();
  delay(500);
}


Program 1

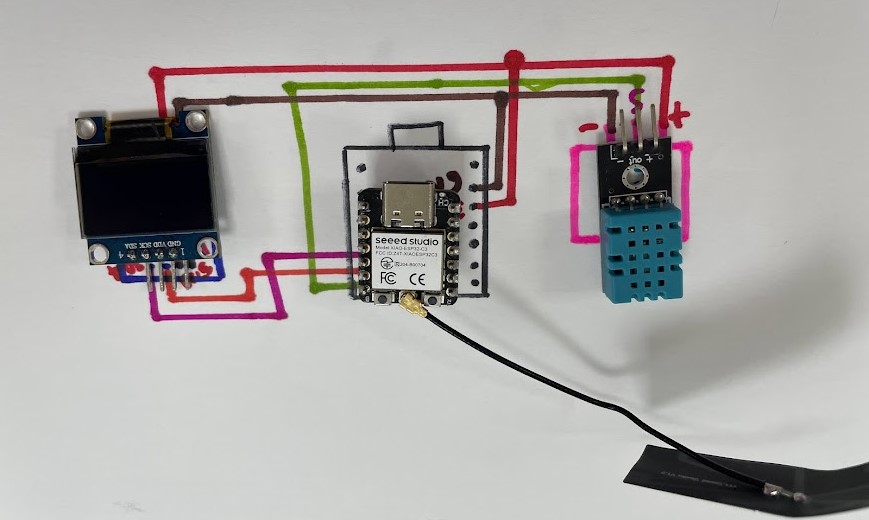
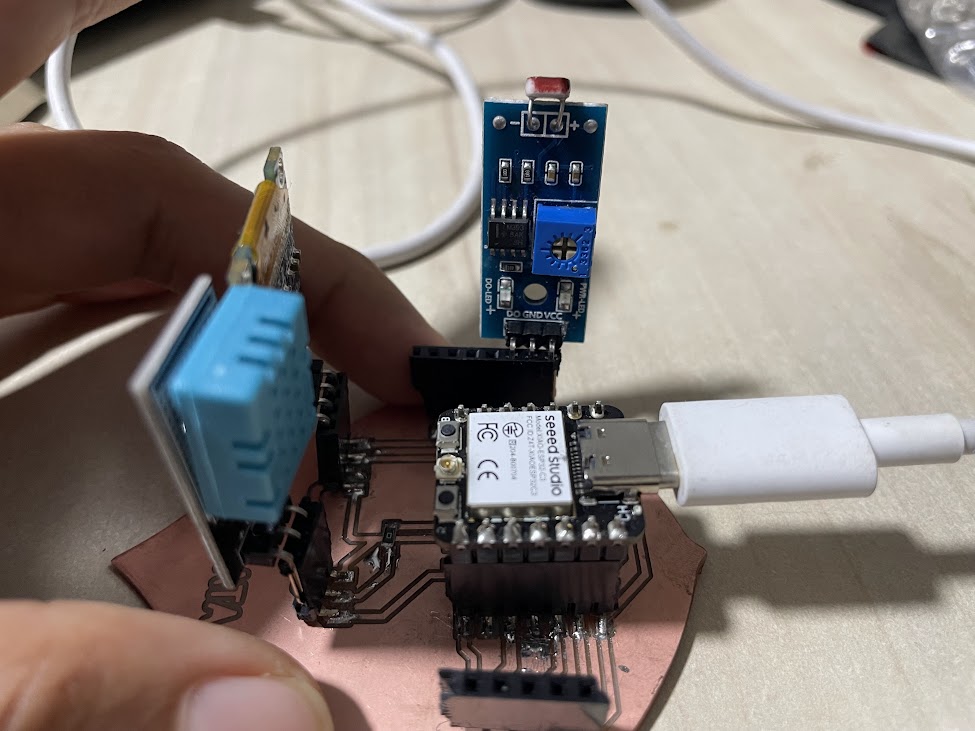
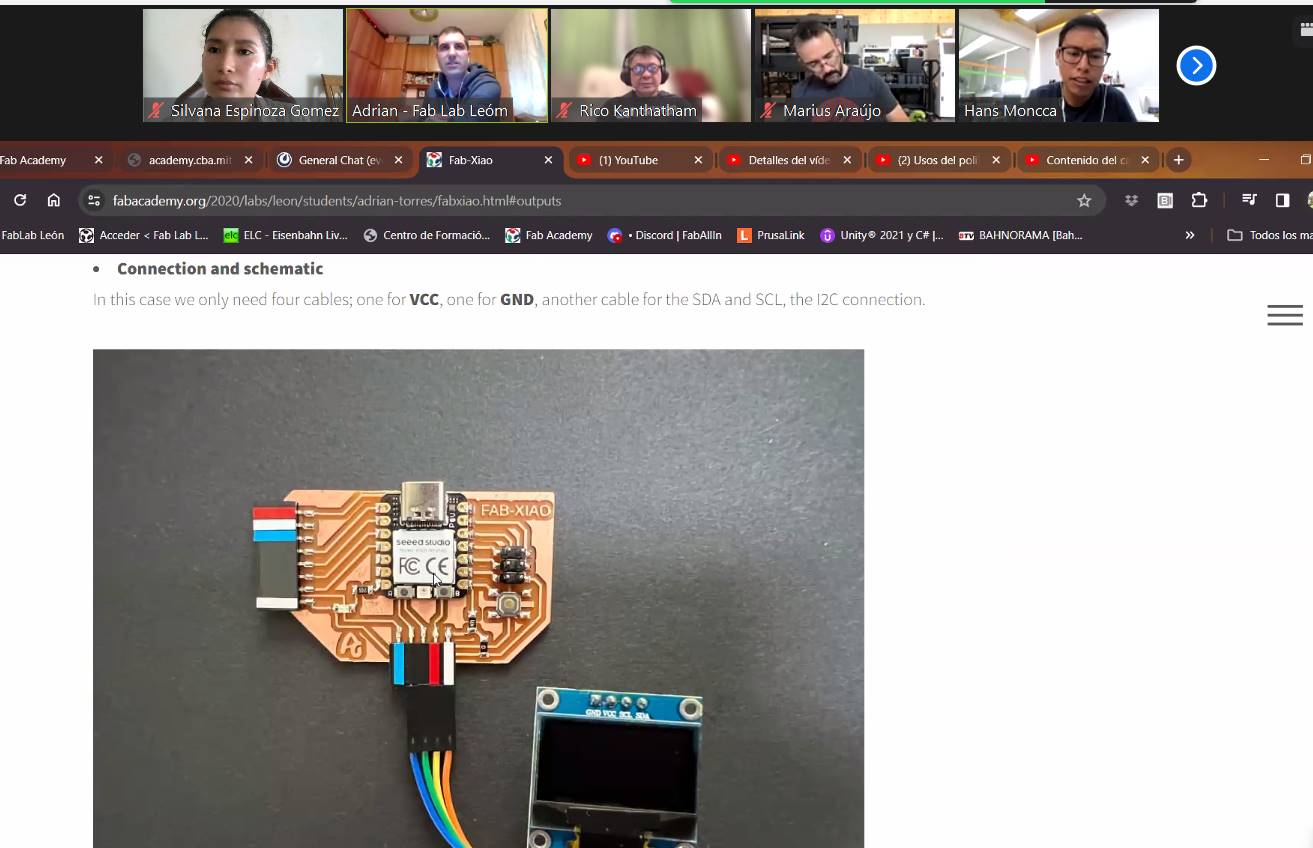
• Connection configuration: In the comments section, we describe how the components, including the ESP32C3, OLED display and DHT11 sensor, are to be physically connected. The pins used for each connection are specified.
•Inclusion of libraries: the libraries needed for the code to work are included, such as the DHT.h library for the DHT11 sensor and the libraries needed to control the SSD1306 OLED display.
• Initialization: In the setup() function, the serial and I2C communications are initialized, as well as the OLED display and the DHT11 sensor. The display is also cleared to prepare it for data display. • Main loop: In the loop(), the temperature and humidity are read from the DHT11 sensor every 2 seconds. If the values are read correctly, they are displayed on the OLED screen. If there is an error reading the data, an error message is printed on the serial port.


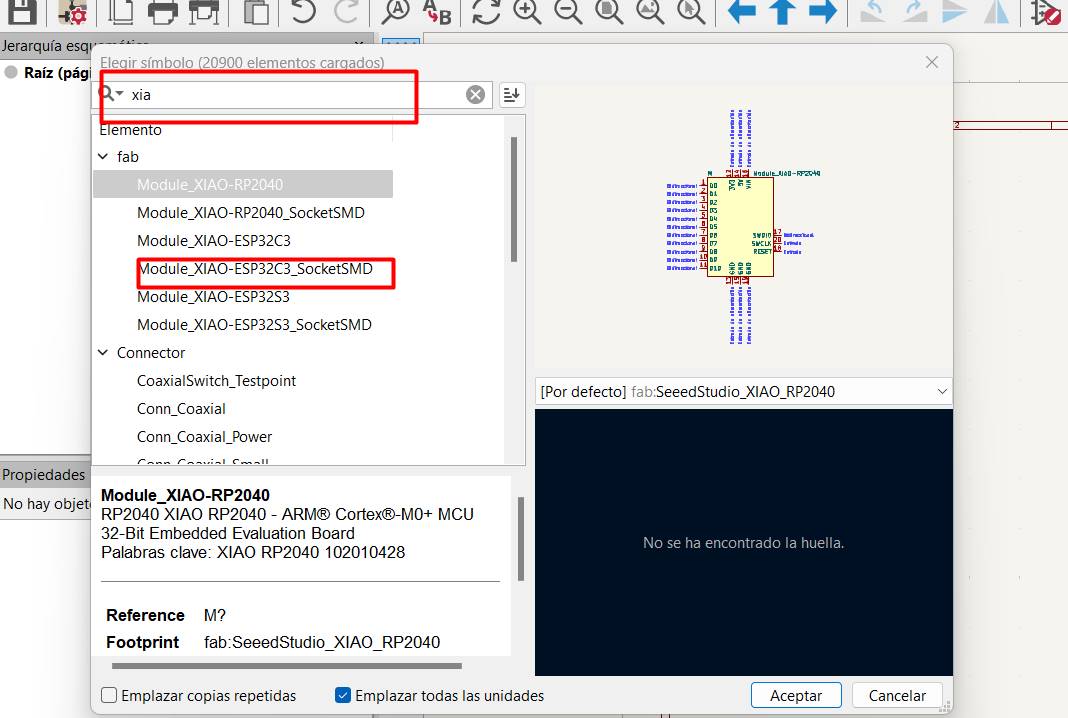
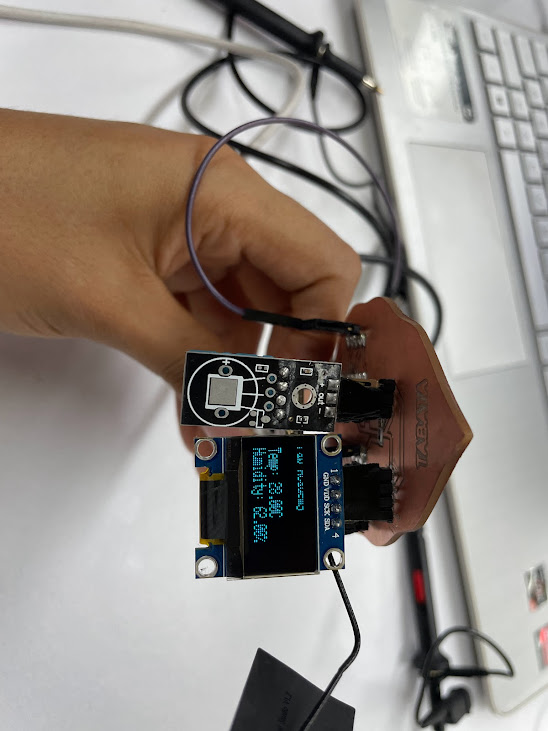
My project, I am using the Xiao ESP32-C3 board to monitor the humidity and temperature of the environment. After extensive testing, I confirmed that both the board and the program work accurately and can display the values correctly on the serial monitor. Now, I am looking to expand the functionality of the project by adding more capabilities. For example, I would like to be able to control a fan based on humidity and temperature readings. To accomplish this, I have incorporated a new code segment that will activate the fan when the temperature exceeds 25°C and the humidity is greater than 60%. This approach will allow me to not only monitor the environment, but also take proactive measures to maintain optimal conditions, such as a cool temperature and adequate humidity levels. I am excited to continue developing this project with the Xiao ESP32-C3 board and explore more possibilities in the future.

 Everything works perfectly :3 


Recommendations

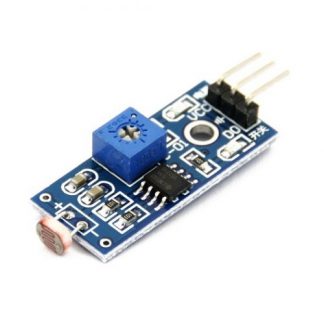
  • Understand what is "OUTPUT": "output" refers to the output of data, signals or energy from one component, device or system to another component, device or system. The output can take various forms depending on the context and purpose of the system in question.
  • "output" refers to the information or data that is displayed on the OLED screen as a result of some process or action in my case the temperature information.It could include text, graphics, images or any other visual information that is represented on the screen previously programmed.
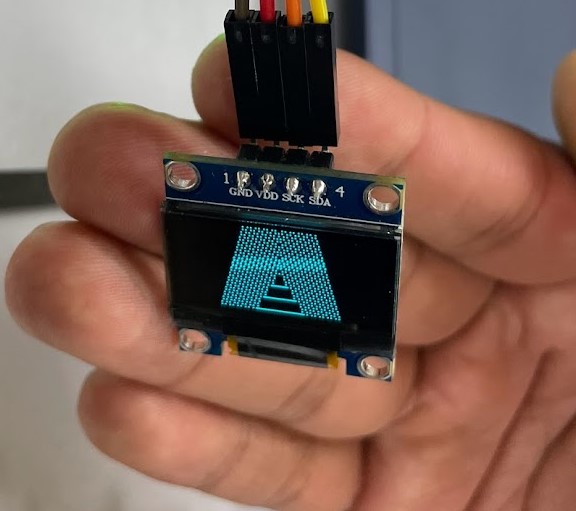
  • It is important to know the specific pins of the OLED display you are using and how they are connected to your Xiao or other microcontroller. This will allow you to properly connect the wires and communicate with the OLED display correctly.
  • Most OLED displays operate with a specific power supply voltage. In your case, you mention that your OLED tolerates a 3.3V supply. It's important to adhere to this specification to avoid damaging the display. If you power the OLED with the wrong voltage, it may not function correctly or even be permanently damaged.
  • These are the pins of the I2C bus communication, which are used for communication between the microcontroller (in this case, Arduino) and the OLED display. It's crucial to correctly identify these pins and connect them properly to the Arduino. If you swap the SCK and SDA pins, communication won't work, and you won't be able to display information on the OLED display properly.
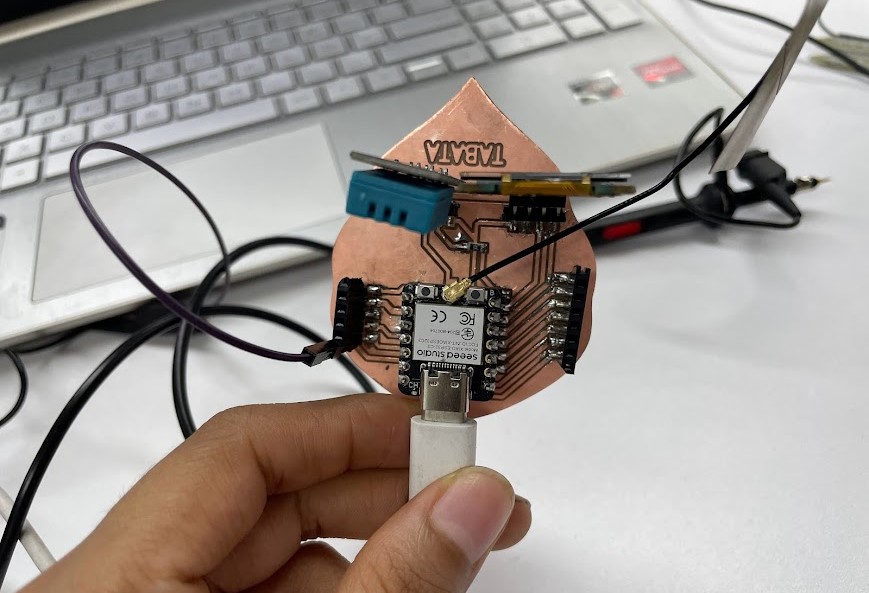
Result


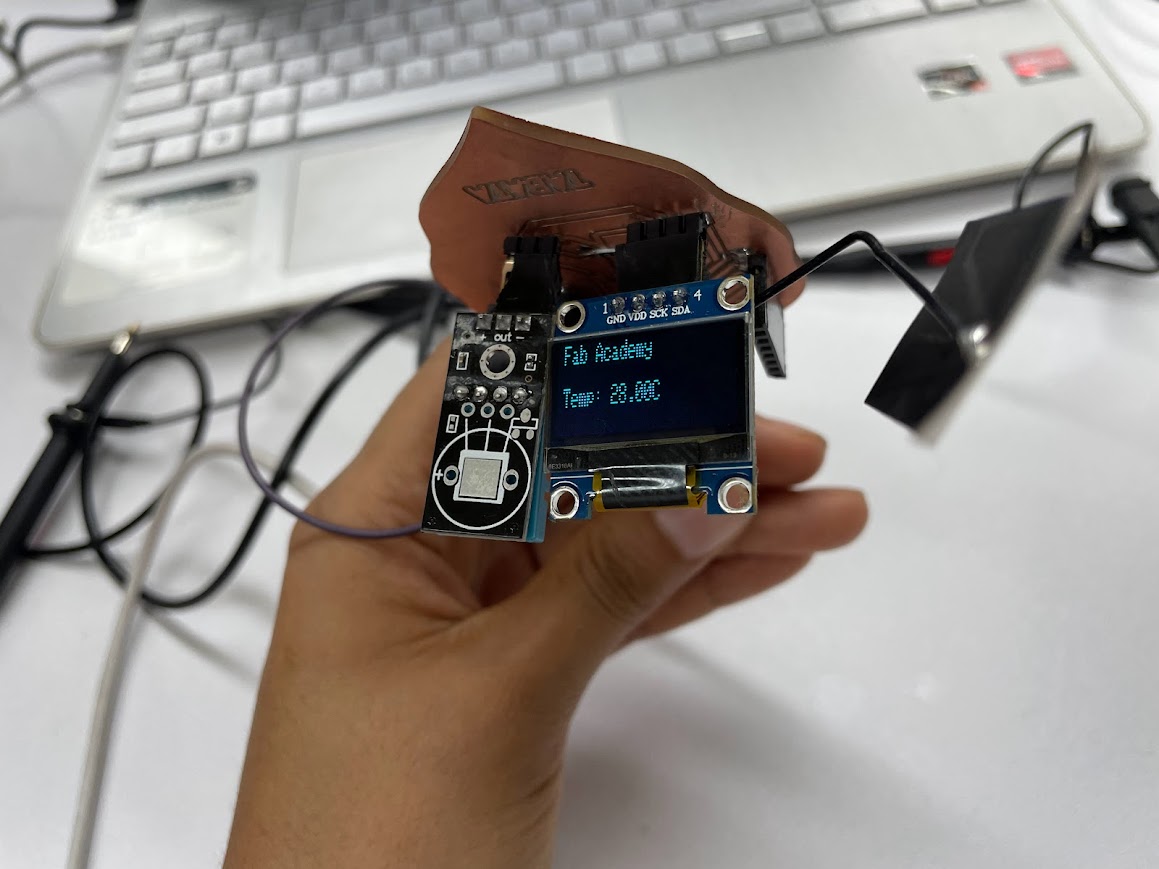
I love the result of my board, and even more to see that all the tracks and pine s are working correctly.


Program Buzzer

Código


// Definir el pin donde está conectado el buzzer
#define BUZZER_PIN 2

// Definiciones de las notas musicales
#define NOTE_C4  262
#define NOTE_D4  294
#define NOTE_E4  330
#define NOTE_F4  349
#define NOTE_G4  392
#define NOTE_A4  440
#define NOTE_B4  494
#define NOTE_C5  523
#define NOTE_REST 0
void setup() {
  // Configurar el pin del buzzer como salida
  pinMode(BUZZER_PIN, OUTPUT);
}

void loop() {
  // Hacer sonar el buzzer con un tono de 1000Hz durante 1000ms (1 segundo)
   int melody[] = {
    NOTE_G4, NOTE_A4, NOTE_B4, NOTE_C5, NOTE_B4, NOTE_A4, NOTE_G4,
    NOTE_G4, NOTE_A4, NOTE_B4, NOTE_C5, NOTE_B4, NOTE_A4, NOTE_G4,
    NOTE_F4, NOTE_G4, NOTE_A4, NOTE_G4, NOTE_F4, NOTE_E4, NOTE_F4, NOTE_G4,
    NOTE_A4, NOTE_B4, NOTE_A4, NOTE_G4, NOTE_F4, NOTE_E4, NOTE_D4, NOTE_E4,
    NOTE_F4, NOTE_G4, NOTE_A4, NOTE_B4, NOTE_C5, NOTE_D4, NOTE_E4, NOTE_REST
  };
   // Duraciones de las notas (en milisegundos)
  int noteDurations[] = {
    4, 4, 8, 8, 8, 8, 4,
    4, 4, 8, 8, 8, 8, 4,
    4, 4, 8, 8, 8, 8, 8, 8,
    4, 4, 4, 4, 4, 4, 4, 4,
    4, 4, 4, 4, 4, 4, 4, 4
  };

  // Toca el himno
  for (int i = 0; i < sizeof(melody) / sizeof(melody[0]); i++) {
    int duration = 1000 / noteDurations[i];
    tone(BUZZER_PIN, melody[i], duration);
    delay(duration * 1.1); // Agrega un pequeño tiempo entre notas para evitar que se escuchen juntas
  }
  noTone(BUZZER_PIN); // Detiene el sonido al finalizar el himno
  delay(2000); // Espera antes de volver a reproducir el himno
  tone(BUZZER_PIN, 1000);
  delay(1000); // Esperar 1 segundo
  
  // Detener el tono (silencio) durante 1000ms (1 segundo)
  noTone(BUZZER_PIN);
  delay(1000); // Esperar 1 segundo antes de repetir el ciclo
}


Program 1


  1. Definition of the pin to which the buzzer is connected
  2. Definitions of musical notes
  3. Configures the buzzer pin as an output
  4. Array containing the notes of the national anthem of Peru

A buzzer on Arduino is an output because it emits sound in response to electrical signals provided by the board. When you send a signal through a pin configured as an output to the buzzer, it produces mechanical vibrations that generate sound. In essence, the buzzer converts electrical signals into audible sound, which is why it is considered an output in the Arduino context.

final result

Conclusions

Use the 3D rendering to verify the layout of the components on your board. This will help you make sure that the components are placed correctly and that there are no space conflicts or interferences between them.

The multimeter is used to measure the continuity of the circuits, which helps to ensure that there are no short circuits or faulty connections on the board.

The 0 ohm resistor on my board plays a crucial role in the configuration of electrical connections. Although its nominal value is 0 ohms, its function is to act as a bridge or junction between two points in the circuit. This allows changes to be made to the signal or power path, providing flexibility in board design and configuration without the need to physically change components.

The multimeter helped us to measure voltages and currents at different points of the circuit, verify if the voltages and currents are within the expected values and help in the debugging process in case of errors or problems.

Efficient routing of tracks and vias minimizes electromagnetic interference and improves circuit performance

Apply heat evenly to the component and board to avoid warping and damage.

Instalar la biblioteca correctamente también garantiza que esté actualizada y optimizada, lo que puede mejorar la estabilidad y la compatibilidad con mi proyecto.

It is crucial to install the library correctly because it provides predefined functions and methods that simplify communication with the DHT sensor. This includes reading temperature and humidity data accurately and efficiently. In addition, the library handles the complexity of communicating with the sensor, allowing me to focus on the logic of my program without worrying about low-level details.

Link