16. Interface and application programming
This week I worked on building a UI that interacted with a PCB of my production.
Board
The board I used was once again my prototyping board based on ATmega328. I also used this for my Networking and Communications. Aaaand here’s some links for you where you can see where and when I used this board before and how I produced it: this link,this other one and this one, too.
Softwares
All the coding for the board was done on Arduino IDE, while the UI was built on Processing.
The installation and setup was pretty straight forward, and, being Arduino IDE derived from this software, it was also pretty straight forward to bgin coding.
Example
Just to start approaching Processing I loaded the interface example featured on the Arduino exercise book. This sketch would load the Arduino logo, and change the colours by potentiometre input.
Sketches
My intent was to use the board as a controller or what happened on screen. The sketch for the board is very simle:
- it reads and encodes a potentiometer value and
- sends this value to processing via serial communication
- it sets two states for the board relating to a push button,
- if the button is pressed the board does not communicate the potentiometre value and goes into a “safe” state.
A prior iteration of this sketch did not include the push button, and another had the button inverted so it would communicate when pushed.
The Processing sketch was a little more complicated, it would generate a sine function, to which a sound sine wave is linked. The sketch receives the potentiometre value and make it the input value for the sine amplitude and the sine wave pitch.
In further iterations, the background colour would also change with the changing of the pot value, other iterations included trying some of the sound effects or adding other oscillometres (saw\square\triangle waves). I also tried to have different ranges of hertz for the pitch input, or to have the different oscilloscopes run at different frequencies.
One of the first iterations, not yet featuring sounds.
Issues
In the beginning, I was having problems in having Processing interprete the serial communication messages, this was caused by an excessive amount of data sent and received, which would not allow Processing enough time to render and draw the sound and images.
I sorted this issue by adding a delay() between sent messages: I started with a 100 millis delay, which would render both a choppy visual and a grainy sounds, as the frequency and amplitude of the wave would bounce in between 0 and the pot value very quickly. In order to sort this out I tried to reduce the delay() to a point in which the “flickering” would not be percievable, but Processing would still manage to render quickly enough.
Hero Shot
Here is a video of my last iteration of the code.
There is a control LED on the board that tells me, if the button is pressed, that the machine is in a safe state, where the oscillator is paused, receiving an input of 0.
If the button is released a sine wave and a sine graph are generated, the stroke colour and background colour change with the amplitude\pitch of such wave\graph.
The pitchinput (potentiometre value) is multiplied or divided depending of what order of magnitude I needed. For the video I massively enlarged the pitch value so that it would be audible in the video. At first I had set the input 0+20 kilo hertz (edge of audibility).
Further developments
I started testing a different software for embedded UX\UI. I decided to try out Python as I did download it earlier in the year, but never used it.
Setup
First thing first, I had to check that Python was installed, which it was. I checked I had Pyserial, which I had as well.
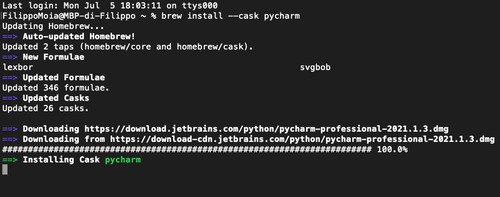
Checked for updates and installed Pycharm a IDE for Python developers.
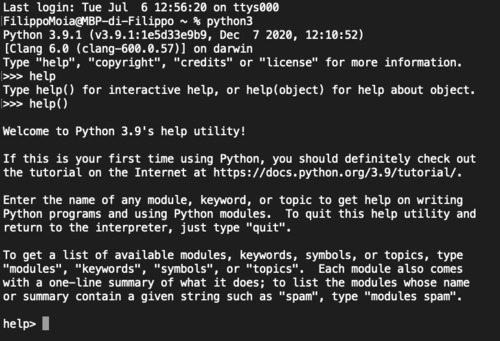
Python can be opened in terminal by just typing ‘python3’ (only ‘python’ in prior versions).
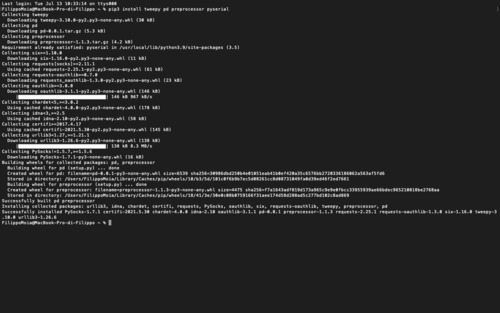
I also installed this extension called Tweepy, the serial communication extension and other dependencies, by opening python3 via terminal and typing ‘pip3 install tweepy pd preprocessor pyserial’.
Sketch
I started looking at a python sketch that Antonio (my tutor) was showing me. This sketch crawls into Twitter to scrape for specific words.
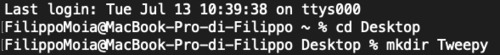
First step was to create a desktop folder destinated to this sketch.
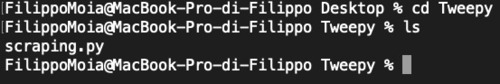
Then I copied the scraping.py script in this folder.
Inside scraping.py, I could change the scraping parameters. For instance I changed my serial port to ‘/dev/cu.usbserial-FTZ56N8T’, the FTDI port I have been using, and I changed my target words to the name of a journalist I really like called ‘Federico Nejrotti’, so to find articles and tweets that mentioned him on Twitter.
In order to get the script to work, I applied to Twitter’s developers consolle.
I then added the keys.
The sketch works by creating a .csv file that stores the data showing the amount of times the searched word appeared on twitter in the last few days.
My board would blink once every time it receives a new value.
Unfortunately for Federico Nejrotti, nobody tweeted about him recently. Nonetheless I would surely know if somebody did, using this sketch.
I also did a search for “it’s coming home”, because of the huge amount of data, the sketch failed, but here’s a link to the .csv file showing the first results.
Files
Processing:
Python: