12. Interface and Application Programming
For this week, the individual assignment was to write an application that interfaces a user with an input &/or output device that I made. The group assignment was to compare as many tool options as possible.
Individual assignment
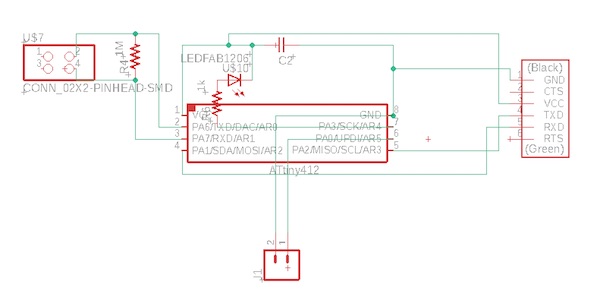
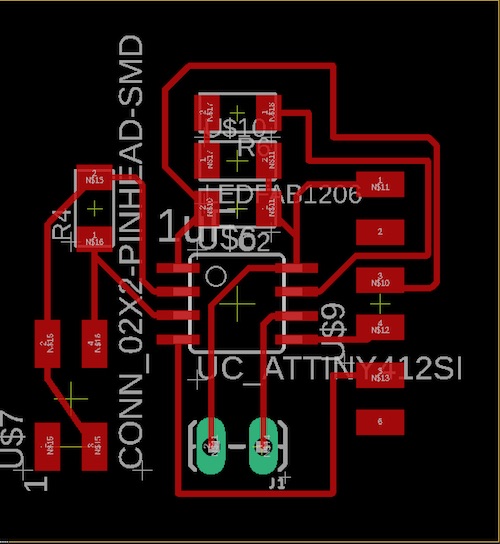
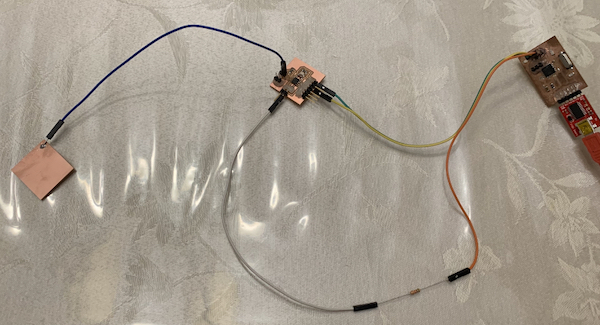
I decided to interface with my capacitive sensor input device, since my output device wasn’t fully functioning at the time. I used the same input device as the one I made in week 9, but I hadn’t used Processing or made an interface for the week (I just used the Arduino Serial Monitor).
I wanted to be able to print out a graph that showed how close I was to the sensor, similar to what Niel had made back in the input week example for the loading sensor video. I decided to use Processing, since I’m familiar with Arduino. I watched this video to get started:
Welcome to Processing 3 from Processing Foundation on Vimeo.
I learned that Processing is a language for coding in the context of visual arts. After downloading Processing, I got started. I found this tutorial for visualizing serial monitor readings with Processing.
It eventually made sense to me that Processing was reading the information from the serial monitor itself. I started off re-testing the code from week 9. After cleaning up the code a bit, I found that it worked more efficiently than before. I then referenced the Processing code provided by the tutorial to write my own Processing code.
For writing the code, I relied on the video tutorial to give me an idea of how Processing worked. Luckily, Processing allows the use of Java, so it was familiar. I learned that when you instantiate the serial monitor, the index of the array of ports you use can be seen from the one on Arduino. Making rectangles also became more clear to me, and I learned how to use certain methods like rectMode() and rect(). After I went through writing the code, I tested it and it worked!
This was the final code I used, with comments to show what each step does:
import processing.serial.*; //imcludes the serial object library

Serial port;  // creates local serial object from Serial library
int maxPinInput = 1023; // maximum value read from sensor
float myVal; // float storing converted ascii serial data
String myString; // variable to collect serial data

void setup() {
  size(200, 400); //size of the sketch
  String portName = Serial.list()[0]; // COM3 was listed as the first port on Arduino (index 0)
  port = new Serial(this, portName, 115200); //instantiating the serial monitor (baud rate must match)
}

void draw() {
  while (port.available() > 0) { //if there is data coming in from the serial monity
    myString = port.readStringUntil(10); //strips data of serial port
    if (myString != null) {
      background(255); // makes background white
      myVal = float(myString); // takes data from serial and turns it into a number
      myVal = myVal/maxPinInput *height; // adjusts the number so it fits on the sketch
      rectMode(CENTER); // fixing the rectangle in the center of the sketch
      // makes a rectangle. parameters 1 and 2: the x and y coordinates of the center (usually top left, but we did the rectMode method.
      // third parameter is the width, fourth is the height.
      rect(width/2, height - (myVal/2), width/2, myVal);
      fill(255,0,0); // makes the rectangle red
    }
  }
}
I tried to make the changes in the bar height a little more obvious, but after trying a multitude of things I couldn’t figure out how. I tried taking the square root of myVal to try to get more drastic differences in numbers, but that didn’t work either. I ended up leaving the code as is.
I also found it interesting how when I held the sensor, I could see the fluctuations in the graph. These fluctuations are the delays in the code of when the charge pin is charged, and when it waits for the reading.
Outputting Pictures
After I made the interface, I wanted to play around more so that it didn’t just show a reading. Dr. Taylor had recommended that I could output a picture of a place, as it is closely related to my final project. I found this Processing referencing tutorial, and I started off with the code they provided.
PImage img;

void setup() {
  // Images must be in the "data" directory to load correctly
  img = loadImage("laDefense.jpg");
}

void draw() {
  image(img, 0, 0);
}
I copied over the code I had used for the rectangle graph interface, but changed the sketch prints. This is the code I started with:
import processing.serial.*; //imcludes the serial object library

PImage img;
Serial port;  // creates local serial object from Serial library
int maxPinInput = 1023; // maximum value read from sensor
float myVal; // float storing converted ascii serial data
String myString; // variable to collect serial data

void setup() {
  size(300, 300); //size of the sketch
  String portName = Serial.list()[0]; // COM3 was listed as the first port on Arduino (index 0)
  port = new Serial(this, portName, 115200); //instantiating the serial monitor (baud rate must match)
  img = loadImage("FabLabLogo.jpg"); // Images must be in the "data" directory to load correctly
}

void draw() {
  while (port.available() > 0) { //if there is data coming in from the serial monity
    myString = port.readStringUntil(10); //strips data of serial port
    if (myString != null) {
      background(255); // makes background white
      myVal = float(myString); // takes data from serial and turns it into a number
      //print(myVal);
      if (myVal < 1010)
        image(img, 0, 0); //if number is less than x, print the picture
    }
  }
}
I first tried to print the number so that I had a good idea of what to make my threshold. I found that the myVal had the same values as what was printed on the Arduino serial monitor, so I made the threshold 1010 (the value usually reached 990 if I touched the sensor). I then downloaded this picture of the FabLab logo, and drag and dropped it into the Processing sketch. This adds the image to the “data” directory so that it can load correctly. It worked!
Outputting Changing Designs
I then wanted to play around and mess with other shapes and designs. Dr. Fagan had given me an idea about using expanding circles and I wanted to try it out. I searched up the methods for circles on Processing here and edited the code a little. I learned that the first two parameters of the circle() method sets the coordinate point of the circle’s center, and that the third is the circle’s diameter. I played around with some of the numbers, and it worked!
Then I wanted to add some color for fun, and at first I placed the blue fill color at the end of the body of the if statement, and the circle color change lagged.
I moved the fill() method towards the top of the body, and I found that it worked pretty well!
Here was the final code for the circle interface!
PImage img;

import processing.serial.*; //imcludes the serial object library

Serial port;  // creates local serial object from Serial library
int maxPinInput = 1023; // maximum value read from sensor
float myVal; // float storing converted ascii serial data
String myString; // variable to collect serial data
float circleDiameter;

void setup() {
  size(300, 300); //size of the sketch
  String portName = Serial.list()[0]; // COM3 was listed as the first port on Arduino (index 0)
  port = new Serial(this, portName, 115200); //instantiating the serial monitor (baud rate must match)
  img = loadImage("FabLabLogo.jpg"); // Images must be in the "data" directory to load correctly
}

void draw() {
  while (port.available() > 0) { //if there is data coming in from the serial monity
    myString = port.readStringUntil(10); //strips data of serial port
    if (myString != null) {
      background(255); // makes background white
      myVal = float(myString); // takes data from serial and turns it into the number read on the Arduino Serial Monitor
      circleDiameter = myVal/maxPinInput *(height/2);
      circle(width/2, height/2, circleDiameter);
      fill(0);
      if(myVal < 1010){ // if number is less than x, print the picture
        circleDiameter = myVal/maxPinInput*height;
        circle(width/2, height/2, circleDiameter);
        fill(0, 130, 200); // a pretty light blue!
      }
    }
  }
}
Here are the files (Arduino code and Processing code) from this week: Week 12 files
I loved using Processing. There wasn’t too big of a language learning gap other than some methods. It was super fun to be able to show any image I wanted to, and I might use it for my final project (more discussion needed)!
Group Assignment
The group assignment can be found here.