Kazutoshi Tsuda
15. interface and application programming (May 7, 2014)
Write an application that interface with an input &/or
output device
I chose to use the Processing, a development environment and
online community, for drawing the data from the input device.
And I used the pressure sensor which I have used in the previous assignment as the input device.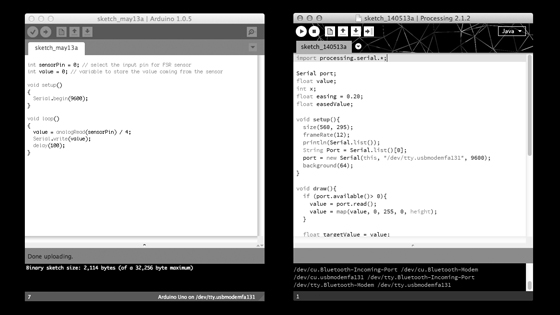
Screen capture of Arduino IDE 1.0.5 (left) and Processing IDE 2.1.2 (right).
Sketch code
int sensorPin = 0;
int value = 0;
void setup(){
Serial.begin(9600);
}
void loop(){
value = analogRead(sensorPin) / 4;
Serial.write(value);
delay(100);
}
Processing sketch code
import processing.serial.*; //import the serial communication library
Serial port; //create object from serial class
float value;
int x;
float easing = 0.20; //see examples. > easing.
float easedValue;
void setup(){ //setup function that only runs once
size(560, 295); //set window size
frameRate(12);
println(Serial.list()); //list all the available ports
String Port = Serial.list()[0];
//port = new Serial(this, port, 9600);
//specify the port number like this.
port = new Serial(this, "/dev/tty.usbmodemfa131", 9600);
background(64); //set background color
}
void draw(){
if (port.available()> 0){
value = port.read();
value = map(value, 0, 255, 0, height); //see reference. > map()
}
float targetValue = value;
easedValue += (targetValue - easedValue) * easing;
stroke(0);
line(x, 0, x, height);
stroke(255);
line(x+1, 0, x+1, height);
line(x, 147, x, value);
line(x, 295, x, easedValue + 147);
x++;
if (x > width) {
x=0;
}
}
I wrote code refer to the related book [1] and ran the code. The black vertical lines appear when a force or pressure is applied to the sensor. The length of the line increases in response to the application of the force.
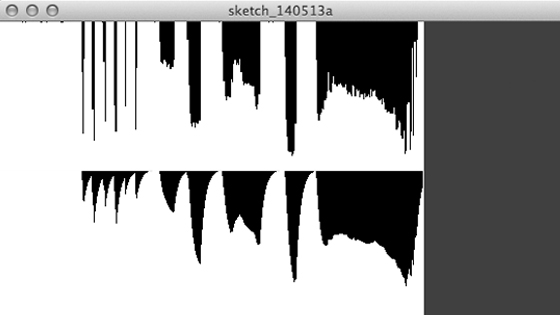
Screen capture of example: raw data (top) and eased data (bottom).
Then I rewrote the code for visualization of the data partially as you will see below.
//stroke(0);
stroke(random(0,255), random(0,255), random(0,255)); //see reference. > random()
//stroke(255);
stroke(0);
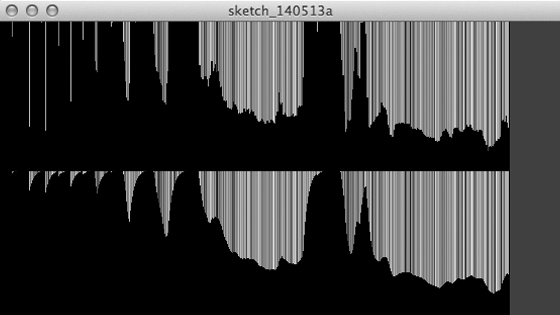
Screen capture of example: raw data (top) and eased data (bottom). It is actually color.
[1] Casey Reas and Ben Fry (2010) Getting Started with Processing. O'Reilly Media. 208 pages. http://www.processing.org/books/
