FINAL PROJECT
In this section, I will describe the step-by-step process of the creation and design of my final project. Welcome to this journey that will surprise you.
FINAL PROJECT SUMMARY
Take a look of my Final project!
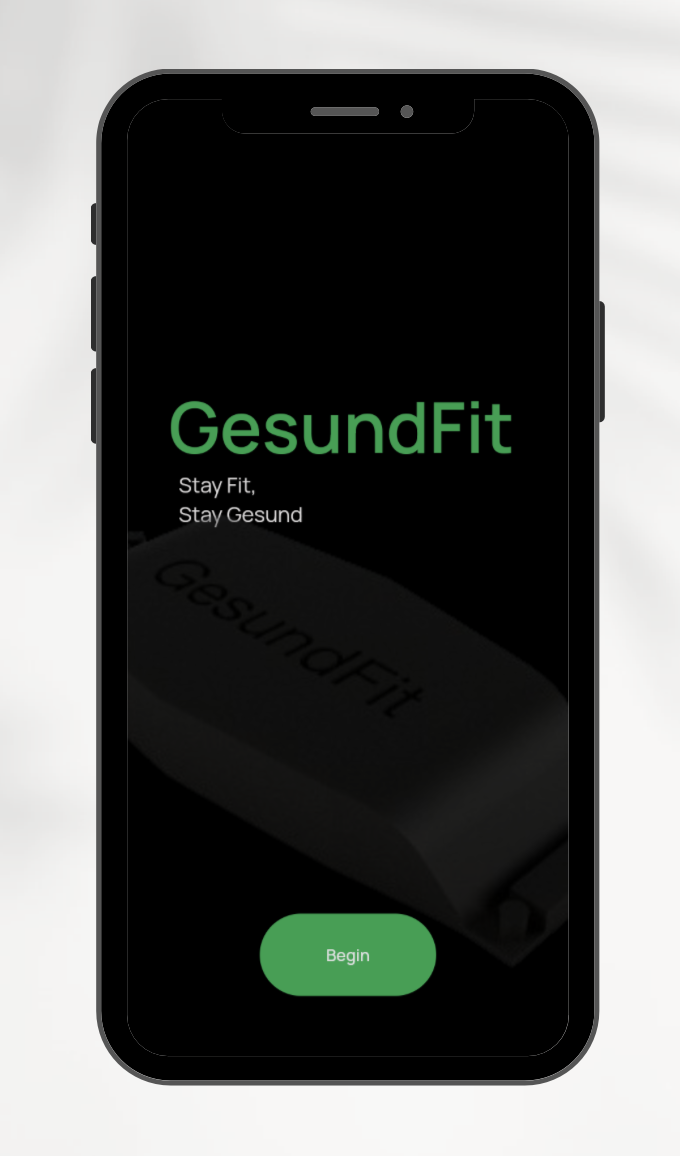
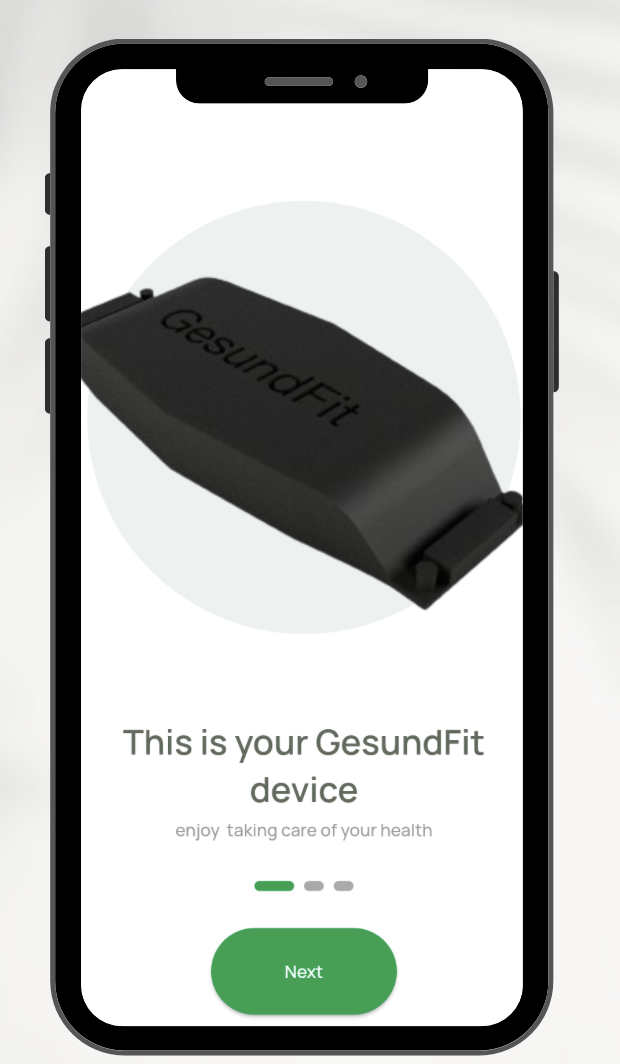
GesundFit
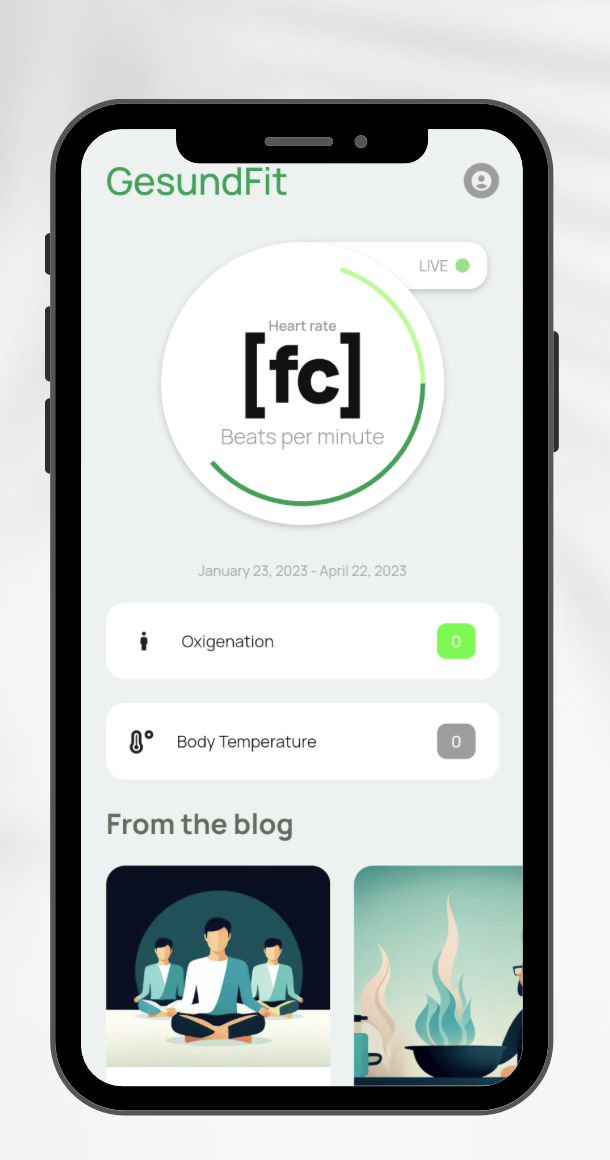
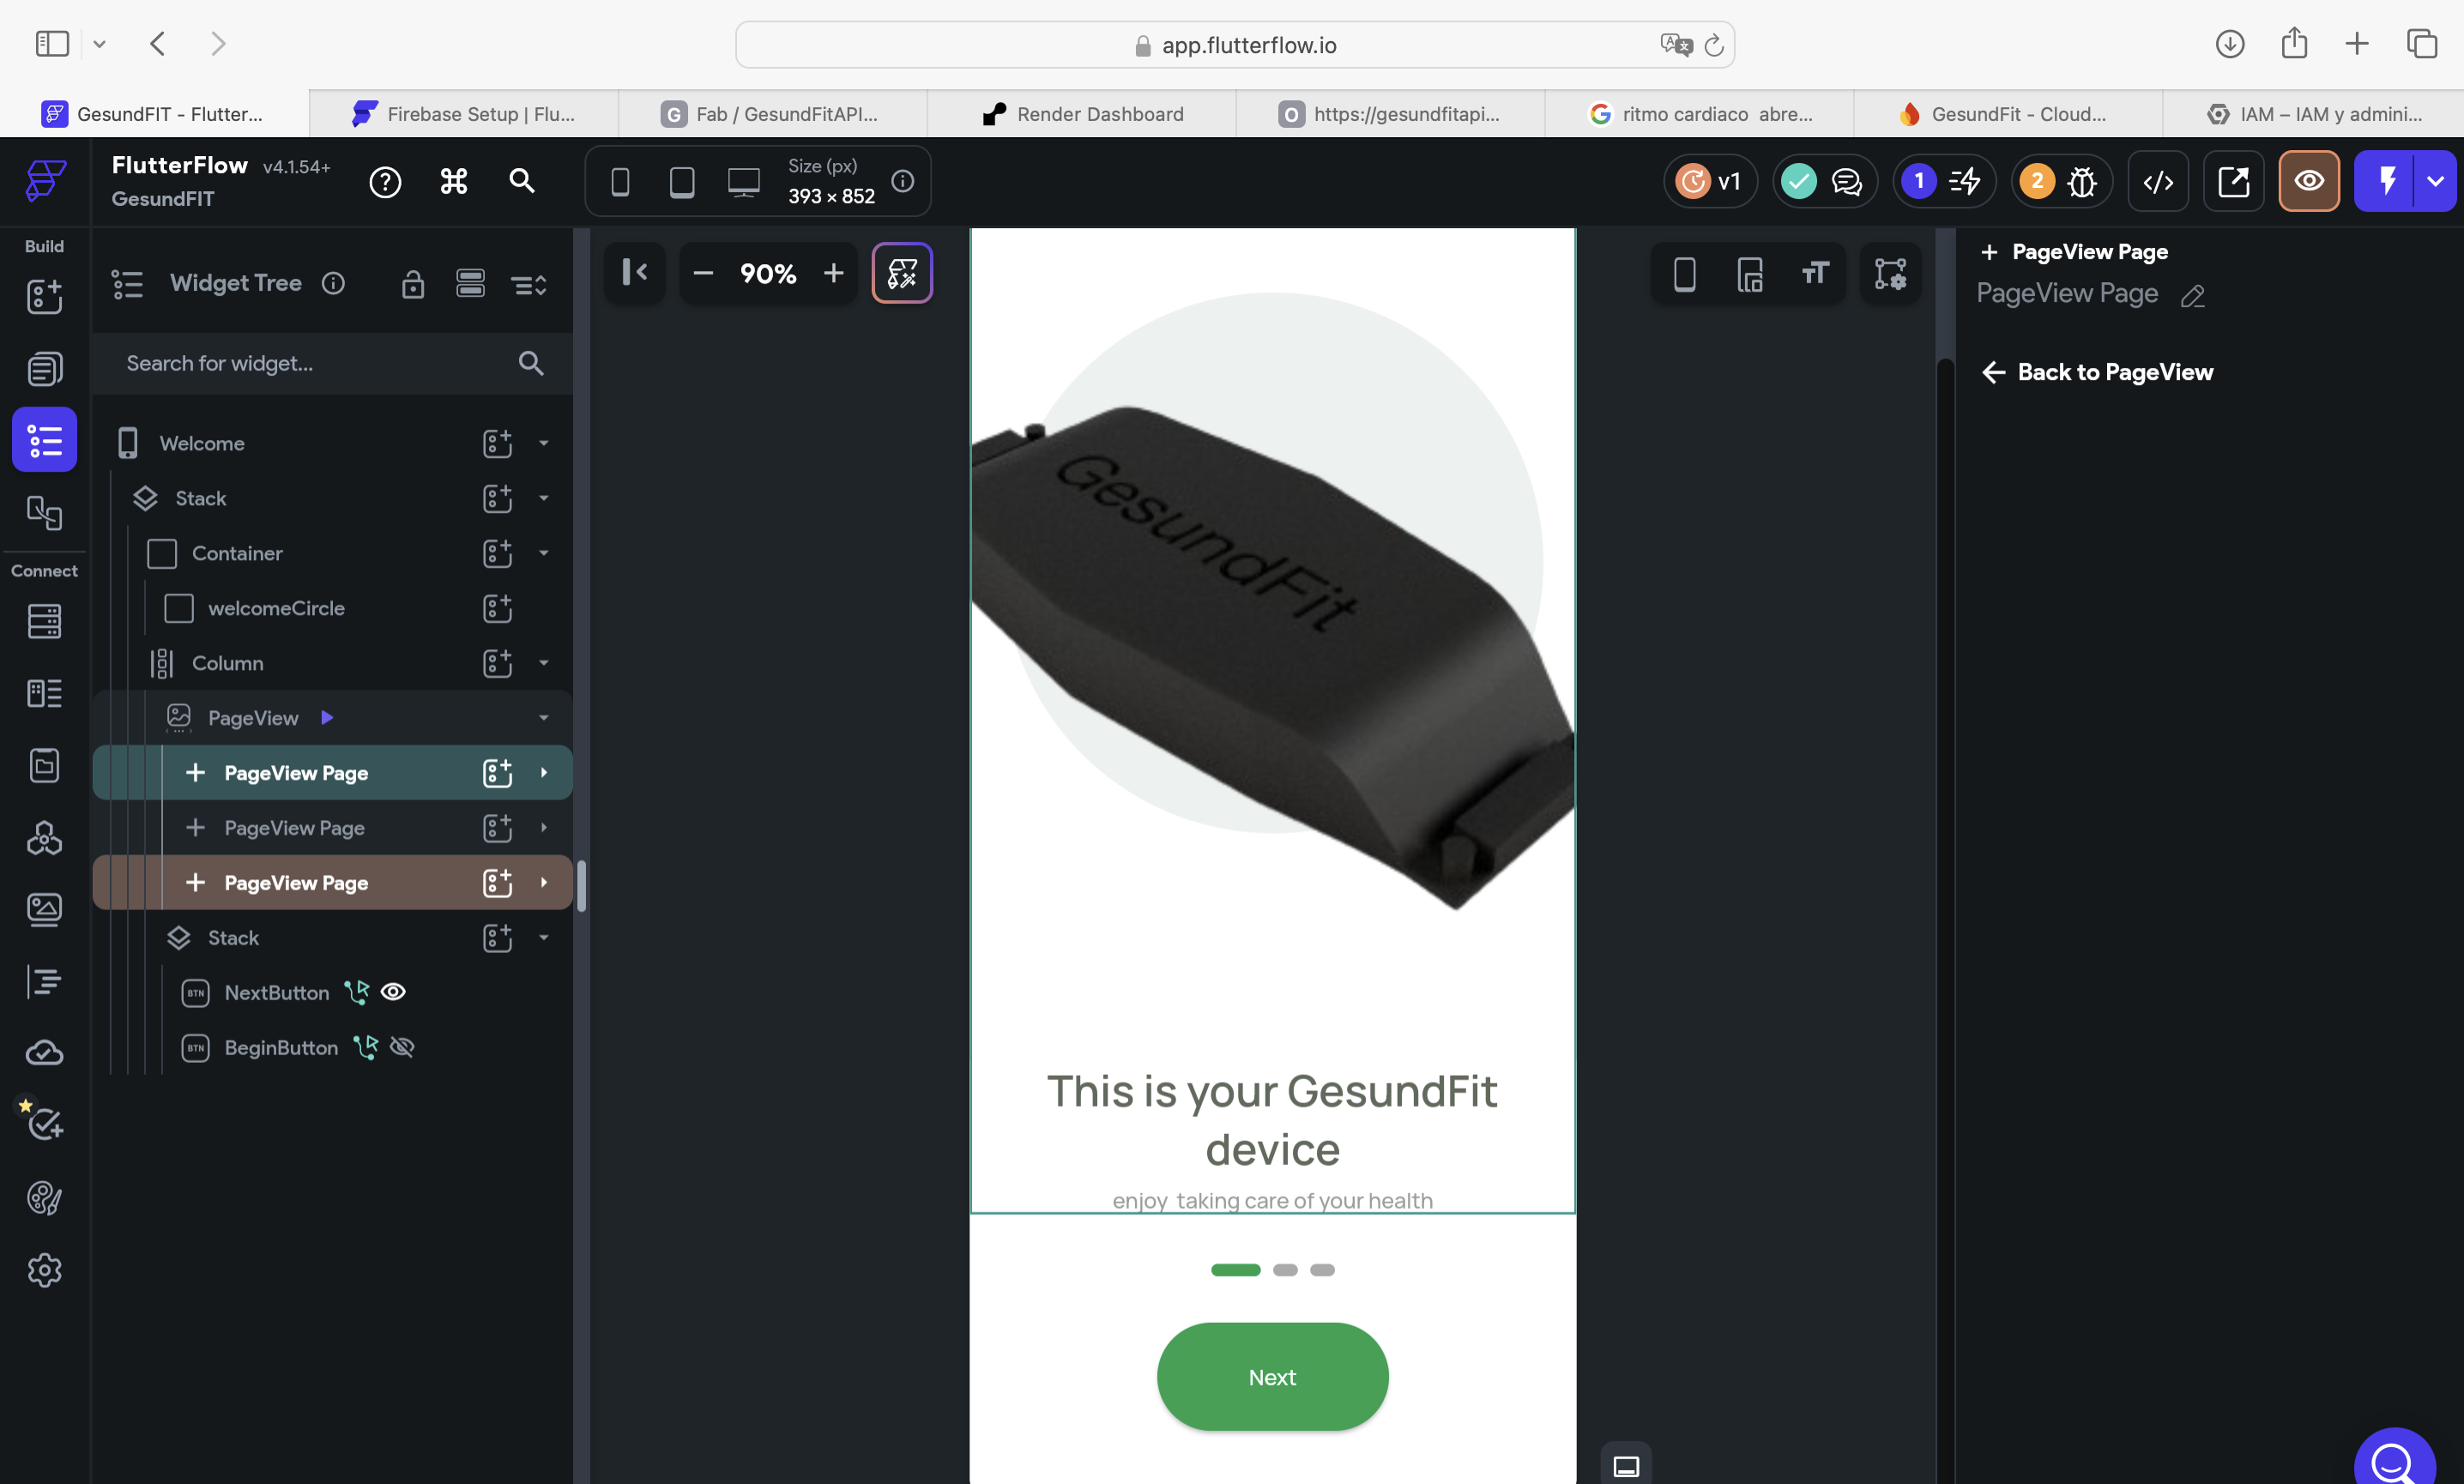
GesundFit is a smart bracelet that measures temperature, heart rate, and oxygen levels. It connects to an app that monitors your vital signs in real time and stores this information in a database.
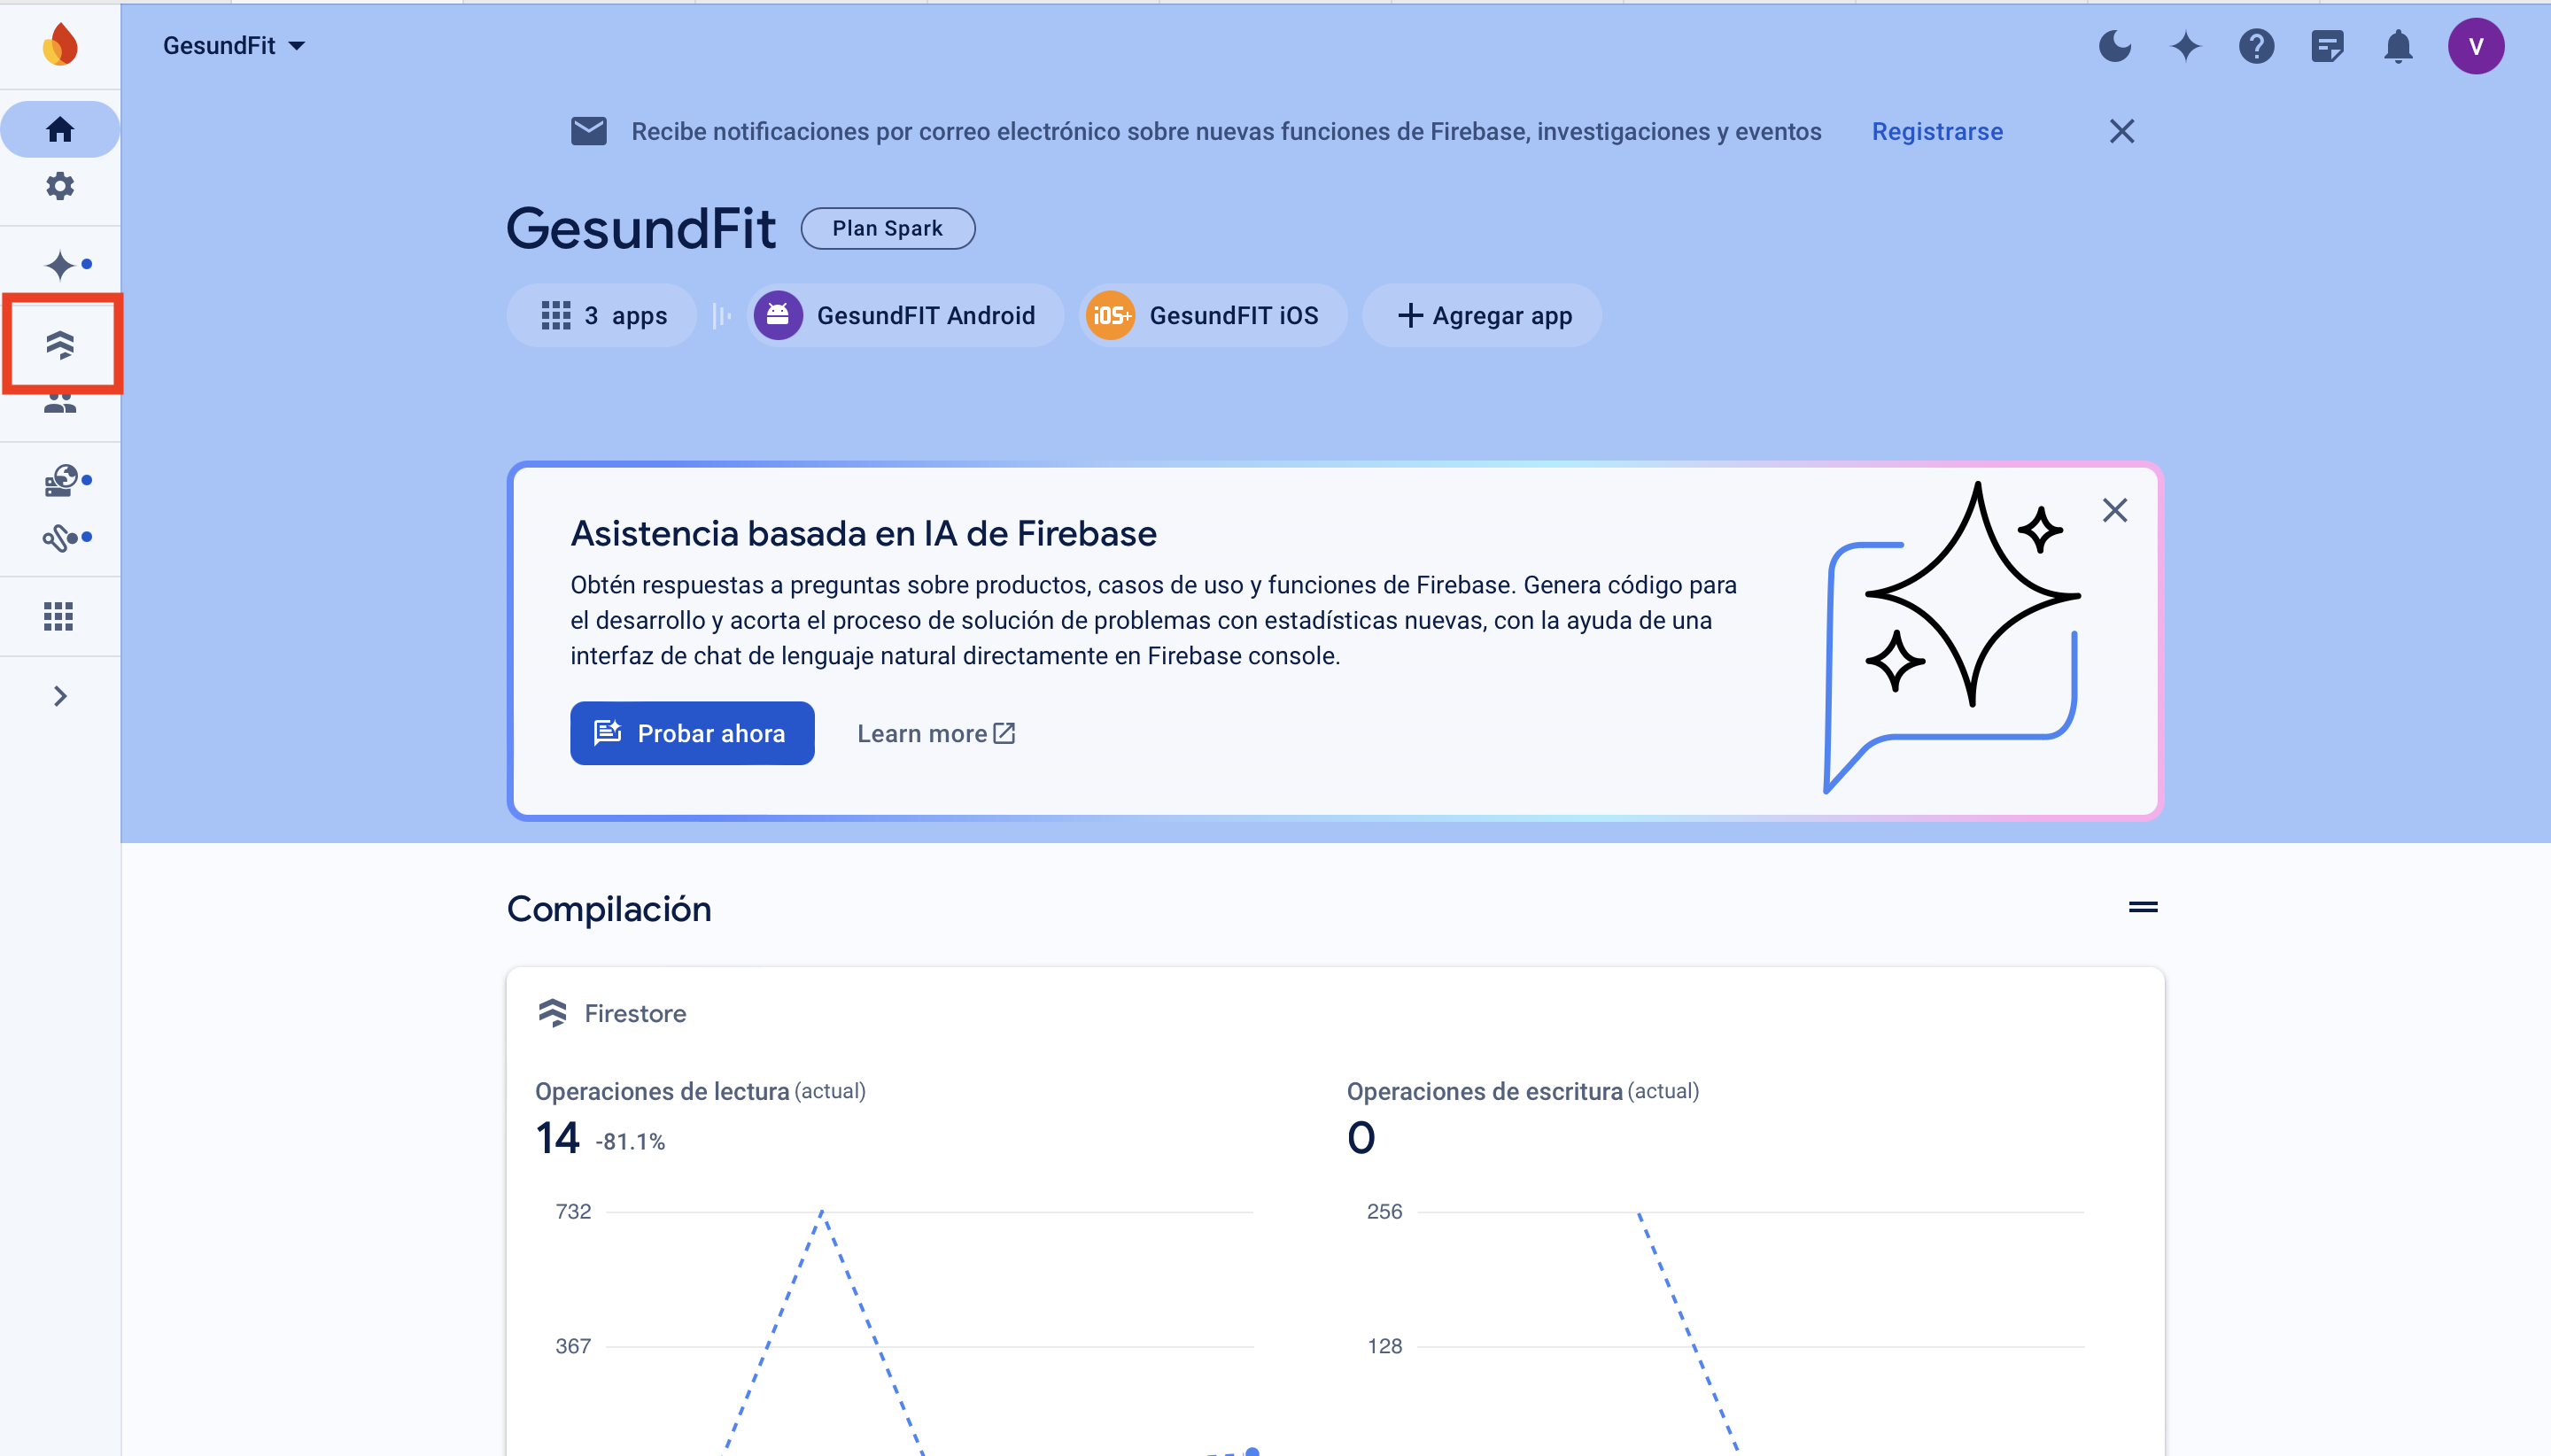
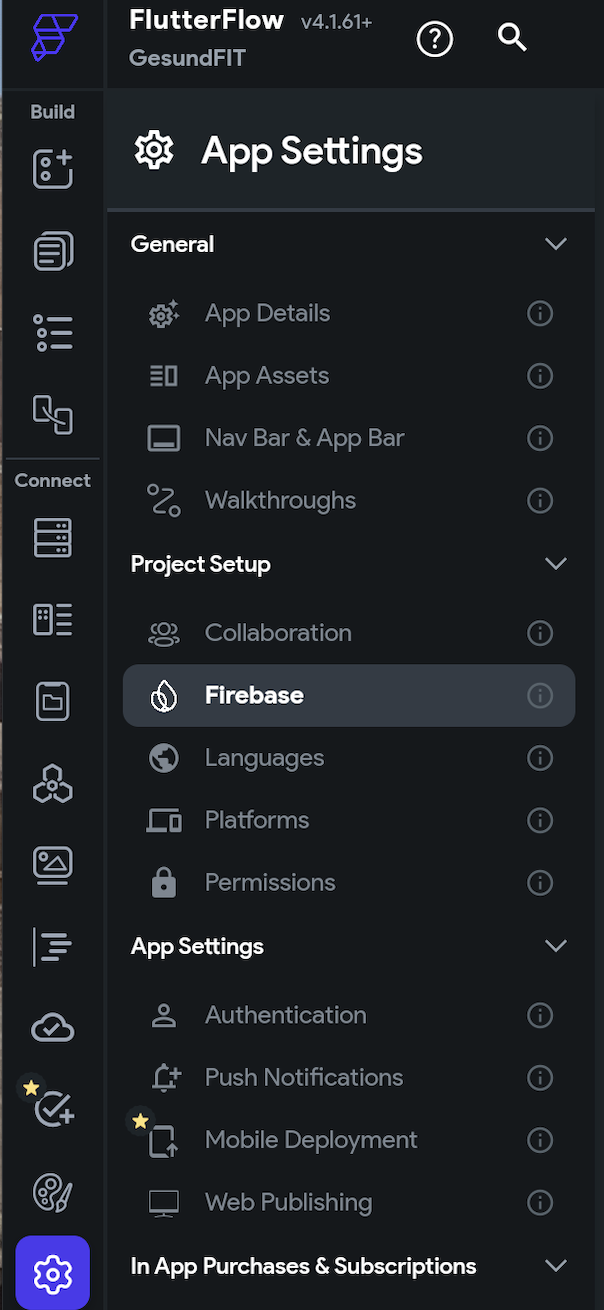
GESUNDFIT APP
Research
Methodology: Design Thinking
Design Thinking is an approach to problem-solving that focuses on understanding user needs and developing creative solutions through multidisciplinary collaboration. It is based on an iterative process that includes stages such as empathy, definition, ideation, prototyping, and testing.
Define Stage
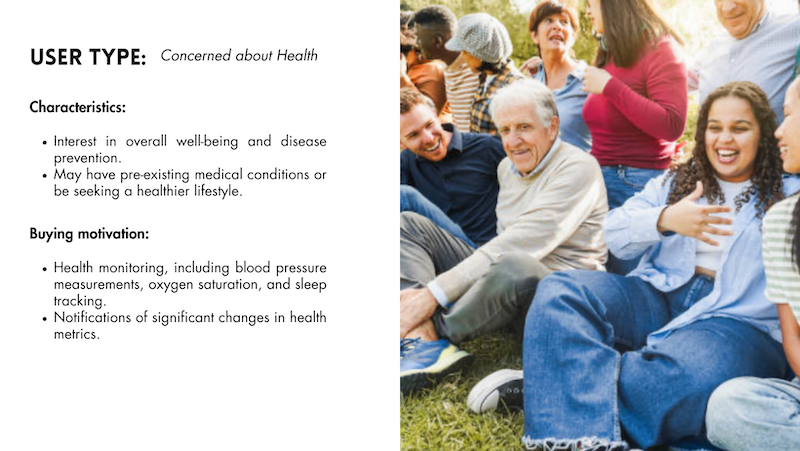
Central Problem: Users desire a smart band that not only measures physical activity but also allows the information to be measurable by experts in the case of known diseases or simply for preventive purposes. Discomfort and lack of style are barriers to adoption, and most users seek a solution that is both accurate and motivating.
Empathy Stage
Ideas Stage
Now in this stage, with all my information, the problematic and the user I started with a brainstorming and sketching my ideas to understand more the way I wanted to work.
First ideas
Here are some of the aim final project ideas.
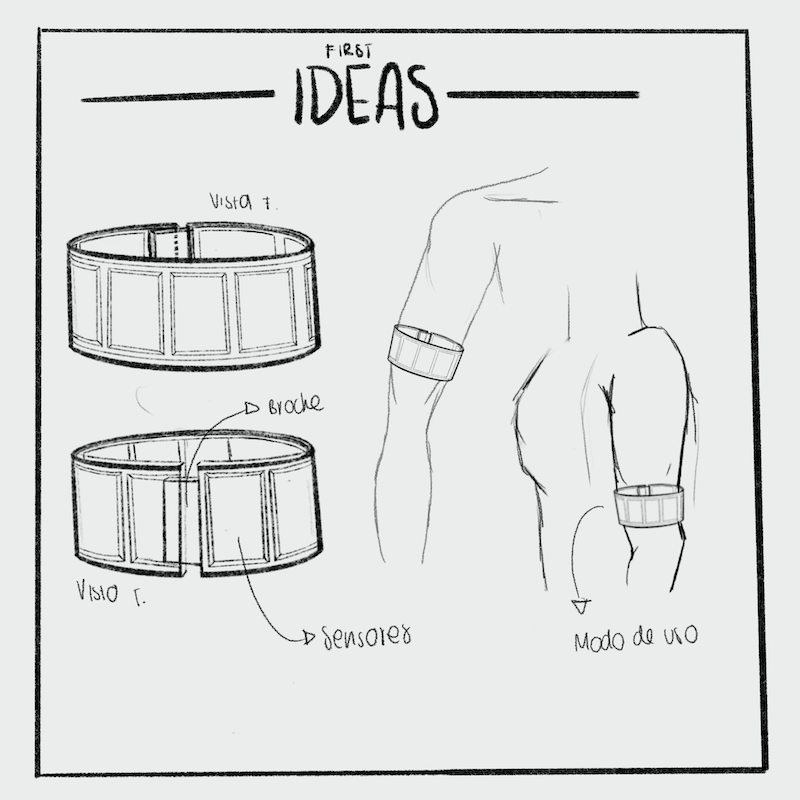
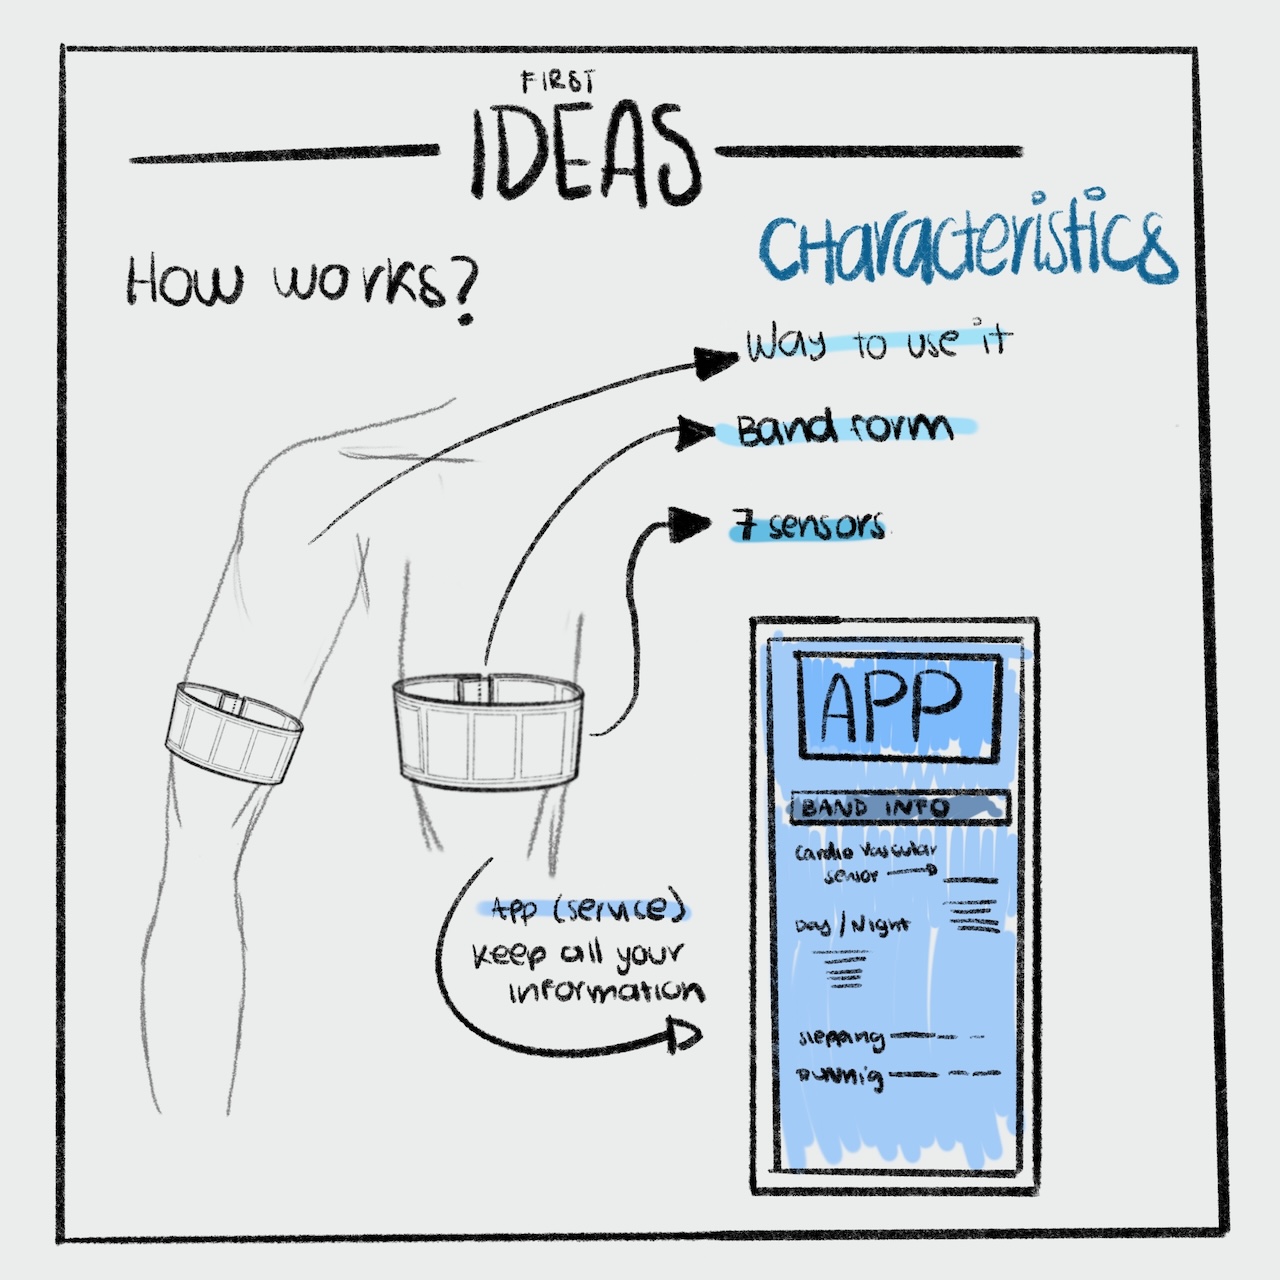
Idea Description
This smart band aims to measure body reactions in order to consistently store them in a database. The goal is to update the information released by the body on a daily basis. A health expert in a specific medical field can then evaluate this information and generate diagnoses related to existing or potential diseases.
Sensors
For this final project we use 3 different sensors
| Sensor Name | Description | Approximate Cost |
|---|---|---|
| Temperature Sensor | Measures the body temperature | $70 mexican pesos. |
| SPO2 sensor | Measures the body oxigenation | $200 mexican pesos. |
| Cardiac beat sensor | Measures heart beat from the body. | $200 mexican pesos. |
Bill of Materials
Here are the list of materials and components I have used for this project.
| Material/Component | Description | Approximate Cost |
|---|---|---|
| XIAO ESP32S3 | Microcontroller | $700 mexican pesos. |
| Temperature Sensor | Measures the body temperature | $70 mexican pesos. |
| SPO2 sensor | Measures the body oxigenation | $200 mexican pesos. |
| Cardiac beat sensor | Measures heart beat from the body. | $200 mexican pesos. |
| TPU filament | Flexible filament | $200 mexican pesos. |
| Copper tape | Tape for cutting the flexible PCB | $300 mexican pesos. |
| Acetate paper | for the base of the board | $30 mexican pesos. |
| Faux leather | for the bracelet strap. | $350 mexican pesos. |
| 5000 glue | to be able to glue the straps | $80 mexican pesos. |
Internal design
Here is the entire process of the internal design of the smart band
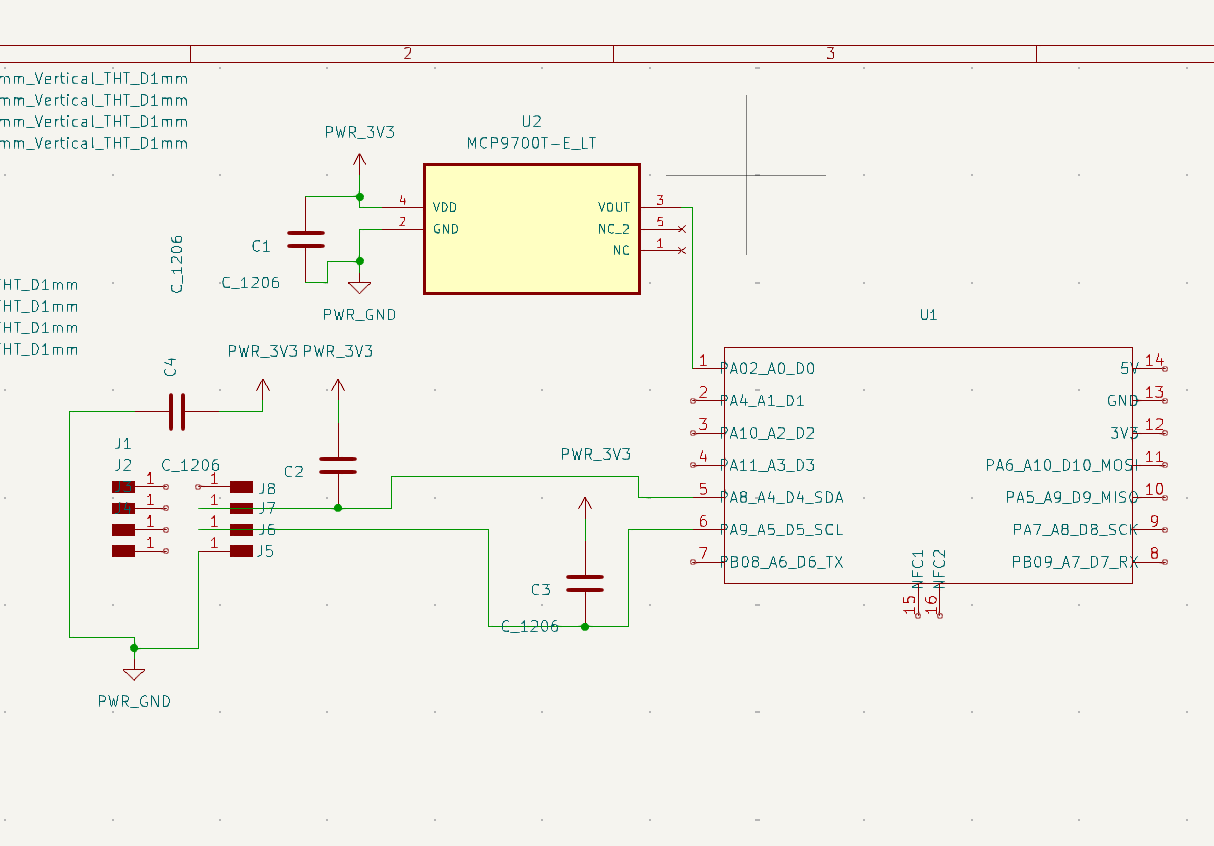
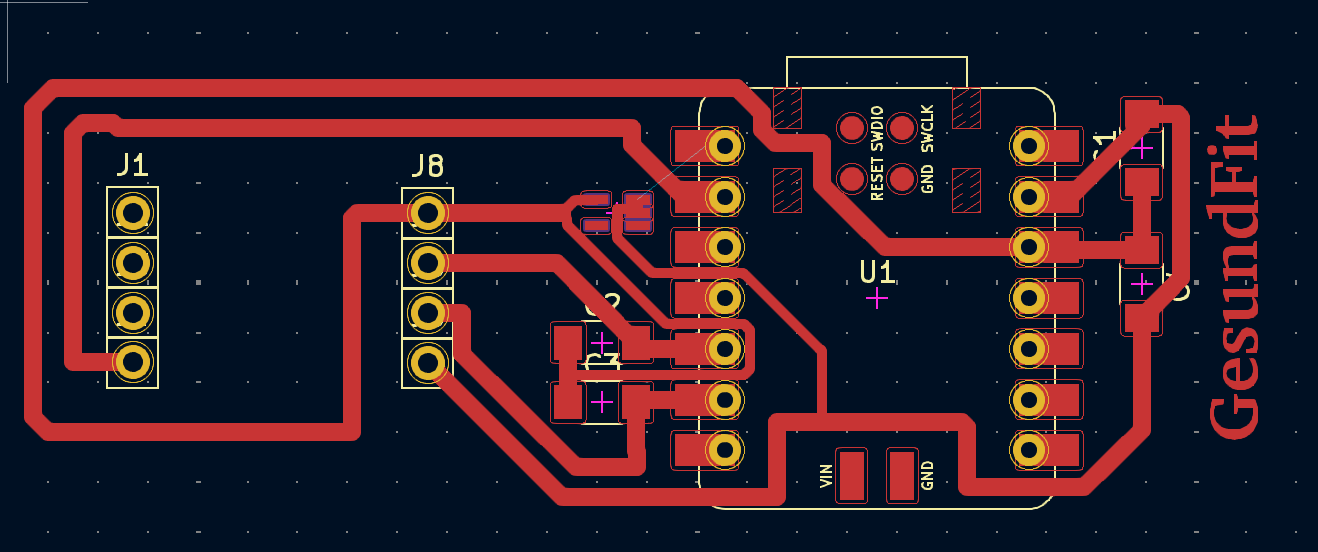
PCB Design
List of components for the pcb desing
| Material/Component | Description |
|---|---|
| MAX30102 | Sensor that includes SpO2 and cardiac sensor. |
| XIAO ESP32C3 BLE AND WIFI | Microcontroller |
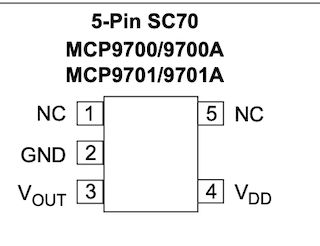
| MCP9700AT-E/LT IC SMD Sensor | Temperature Body sesnor |
| Resistor 4199 | Resistors from the Xiao towards the sensors. |
| Capacitors | From voltage and ground for the entire PCB power supply |
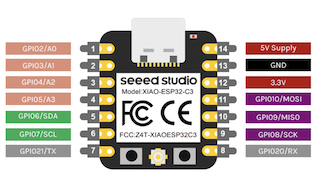
PinOut XIAO ESP32S3
PinOut MAX30102 sensor
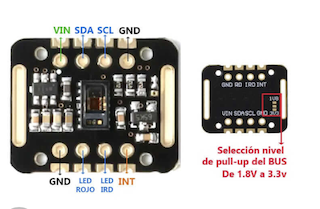
PinOut MCP9700AT-E/LT IC SMD Sensor
Process
I designed my circuit board in KiCad.
Step 1
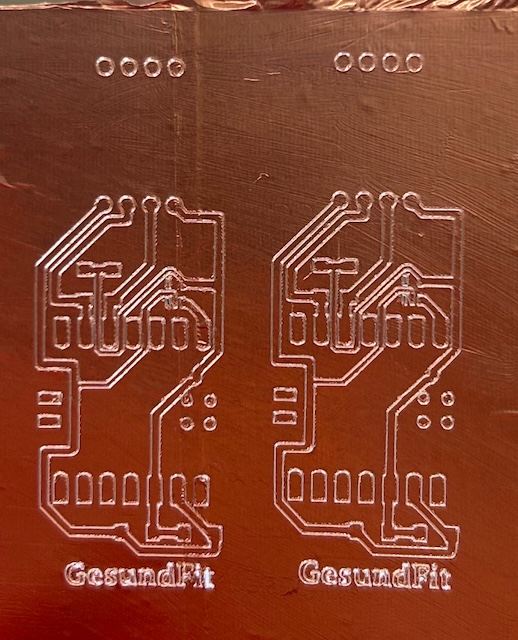
First, I created the schematic design, and then I made the PCB connections while considering the component sizes to avoid making the board too large.
Step 2
Export the design as SVG as usual.
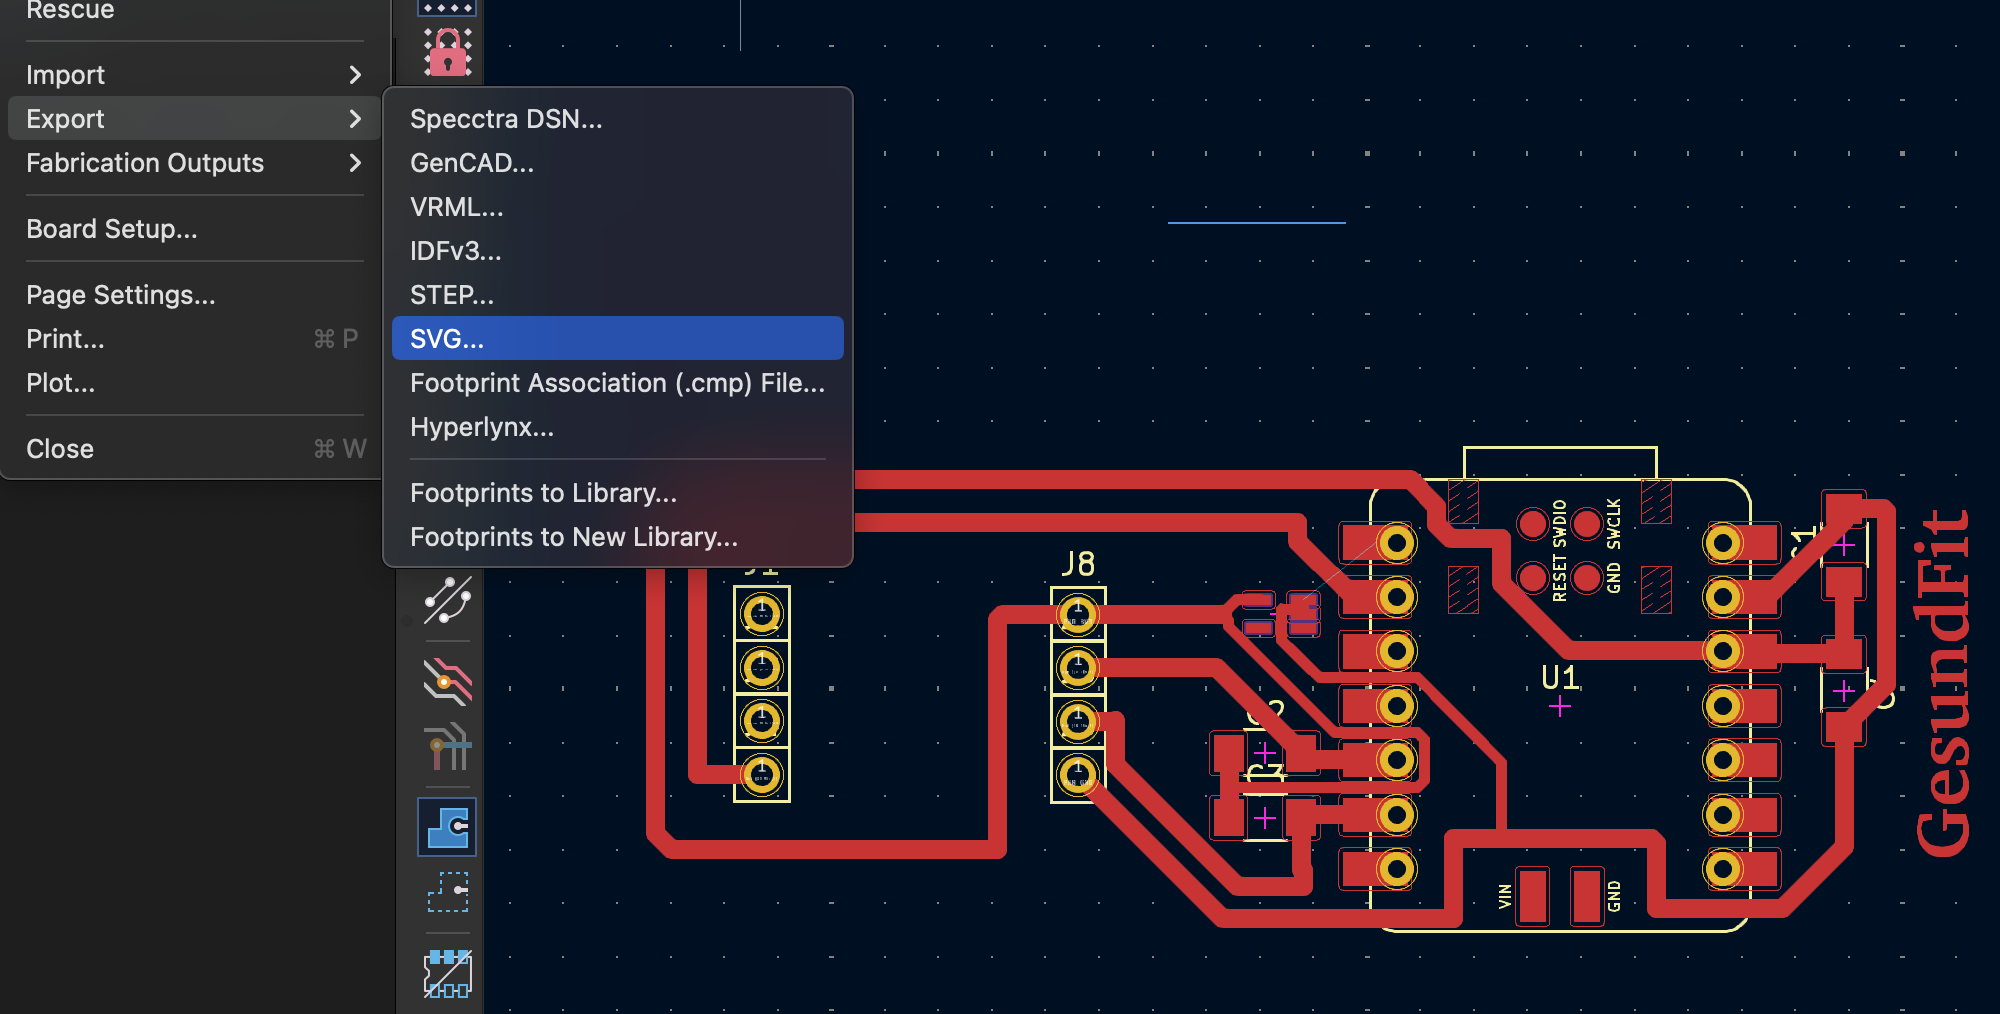
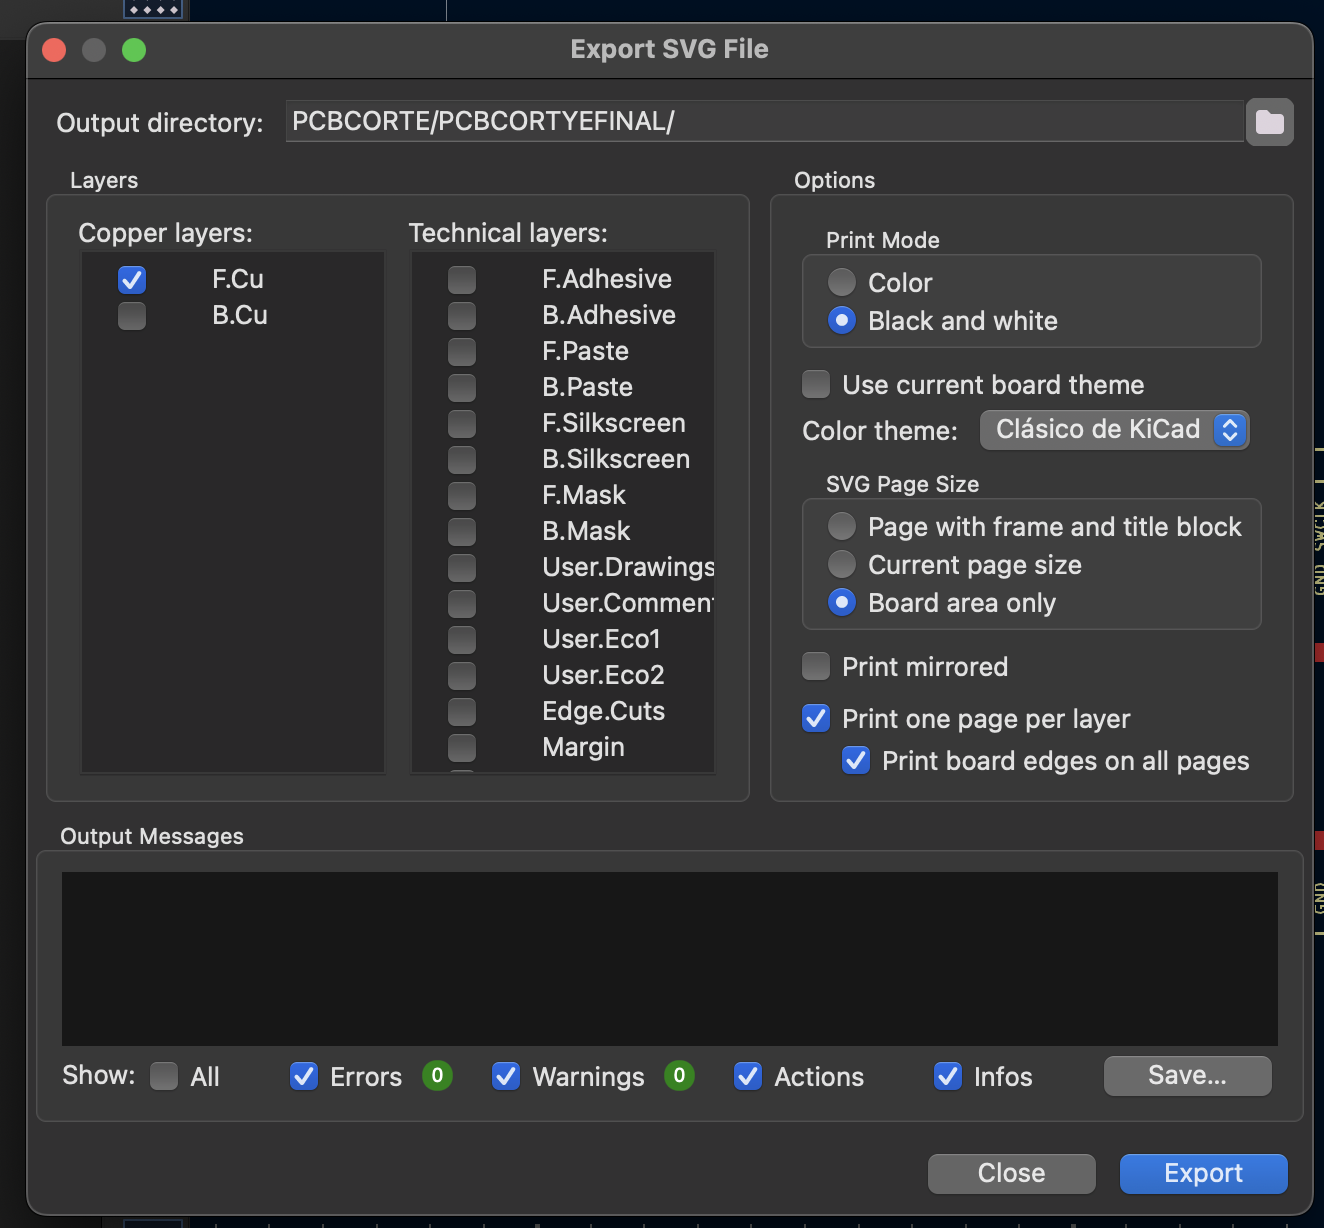
Step 3
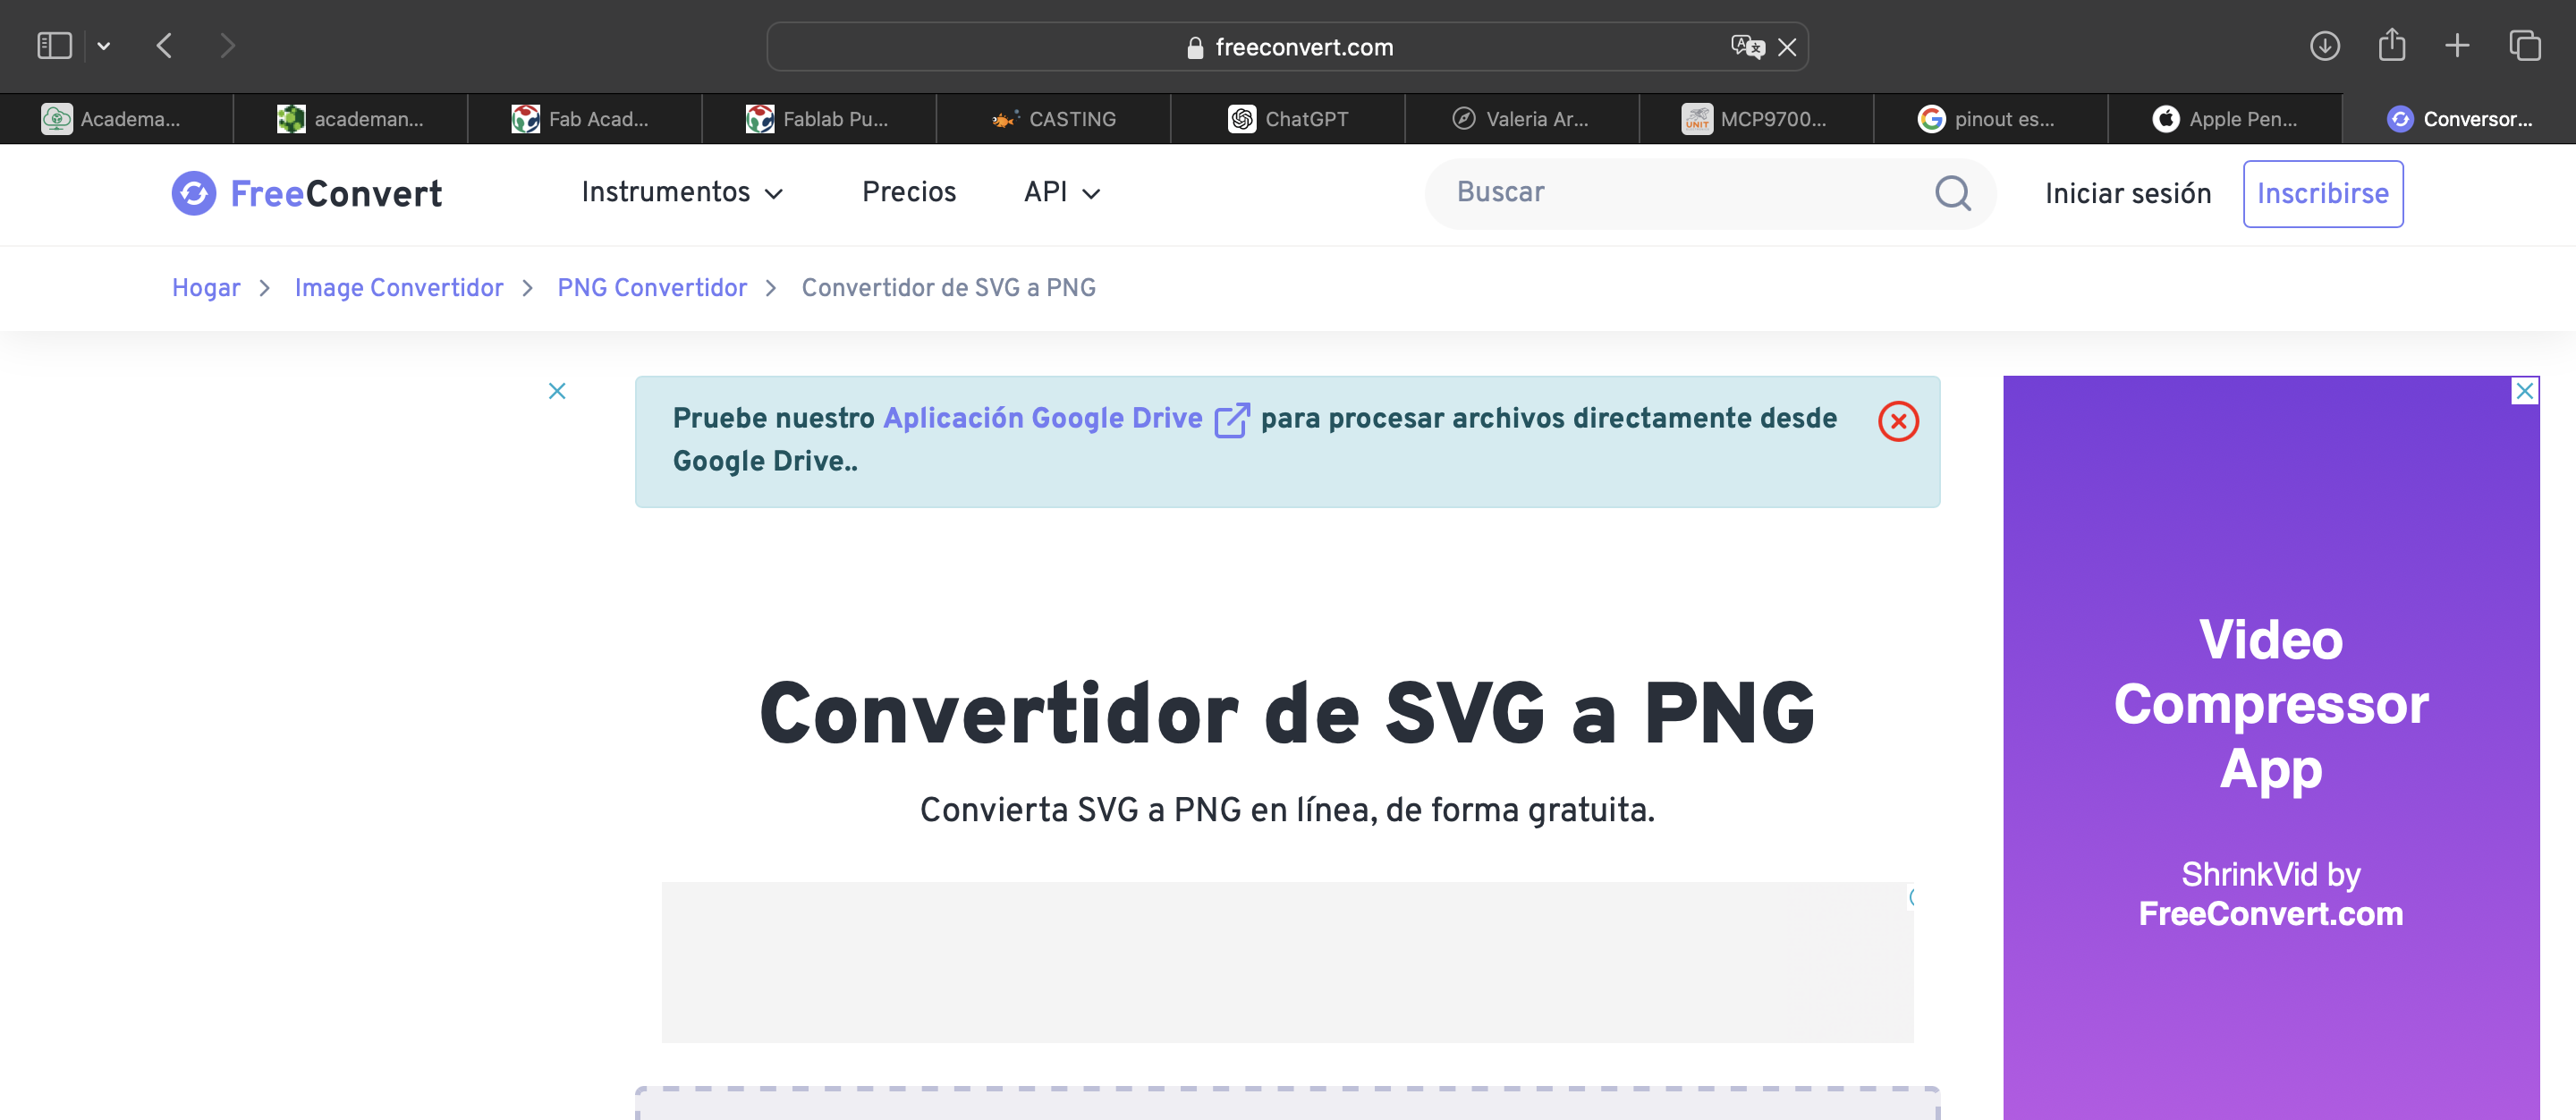
Since I decided to use a vinyl cutter for the flexible PCB design, I needed to convert the SVG design to PNG because that's the format the cutter's program reads.
Therefore, I used an online format converter.
Step 4
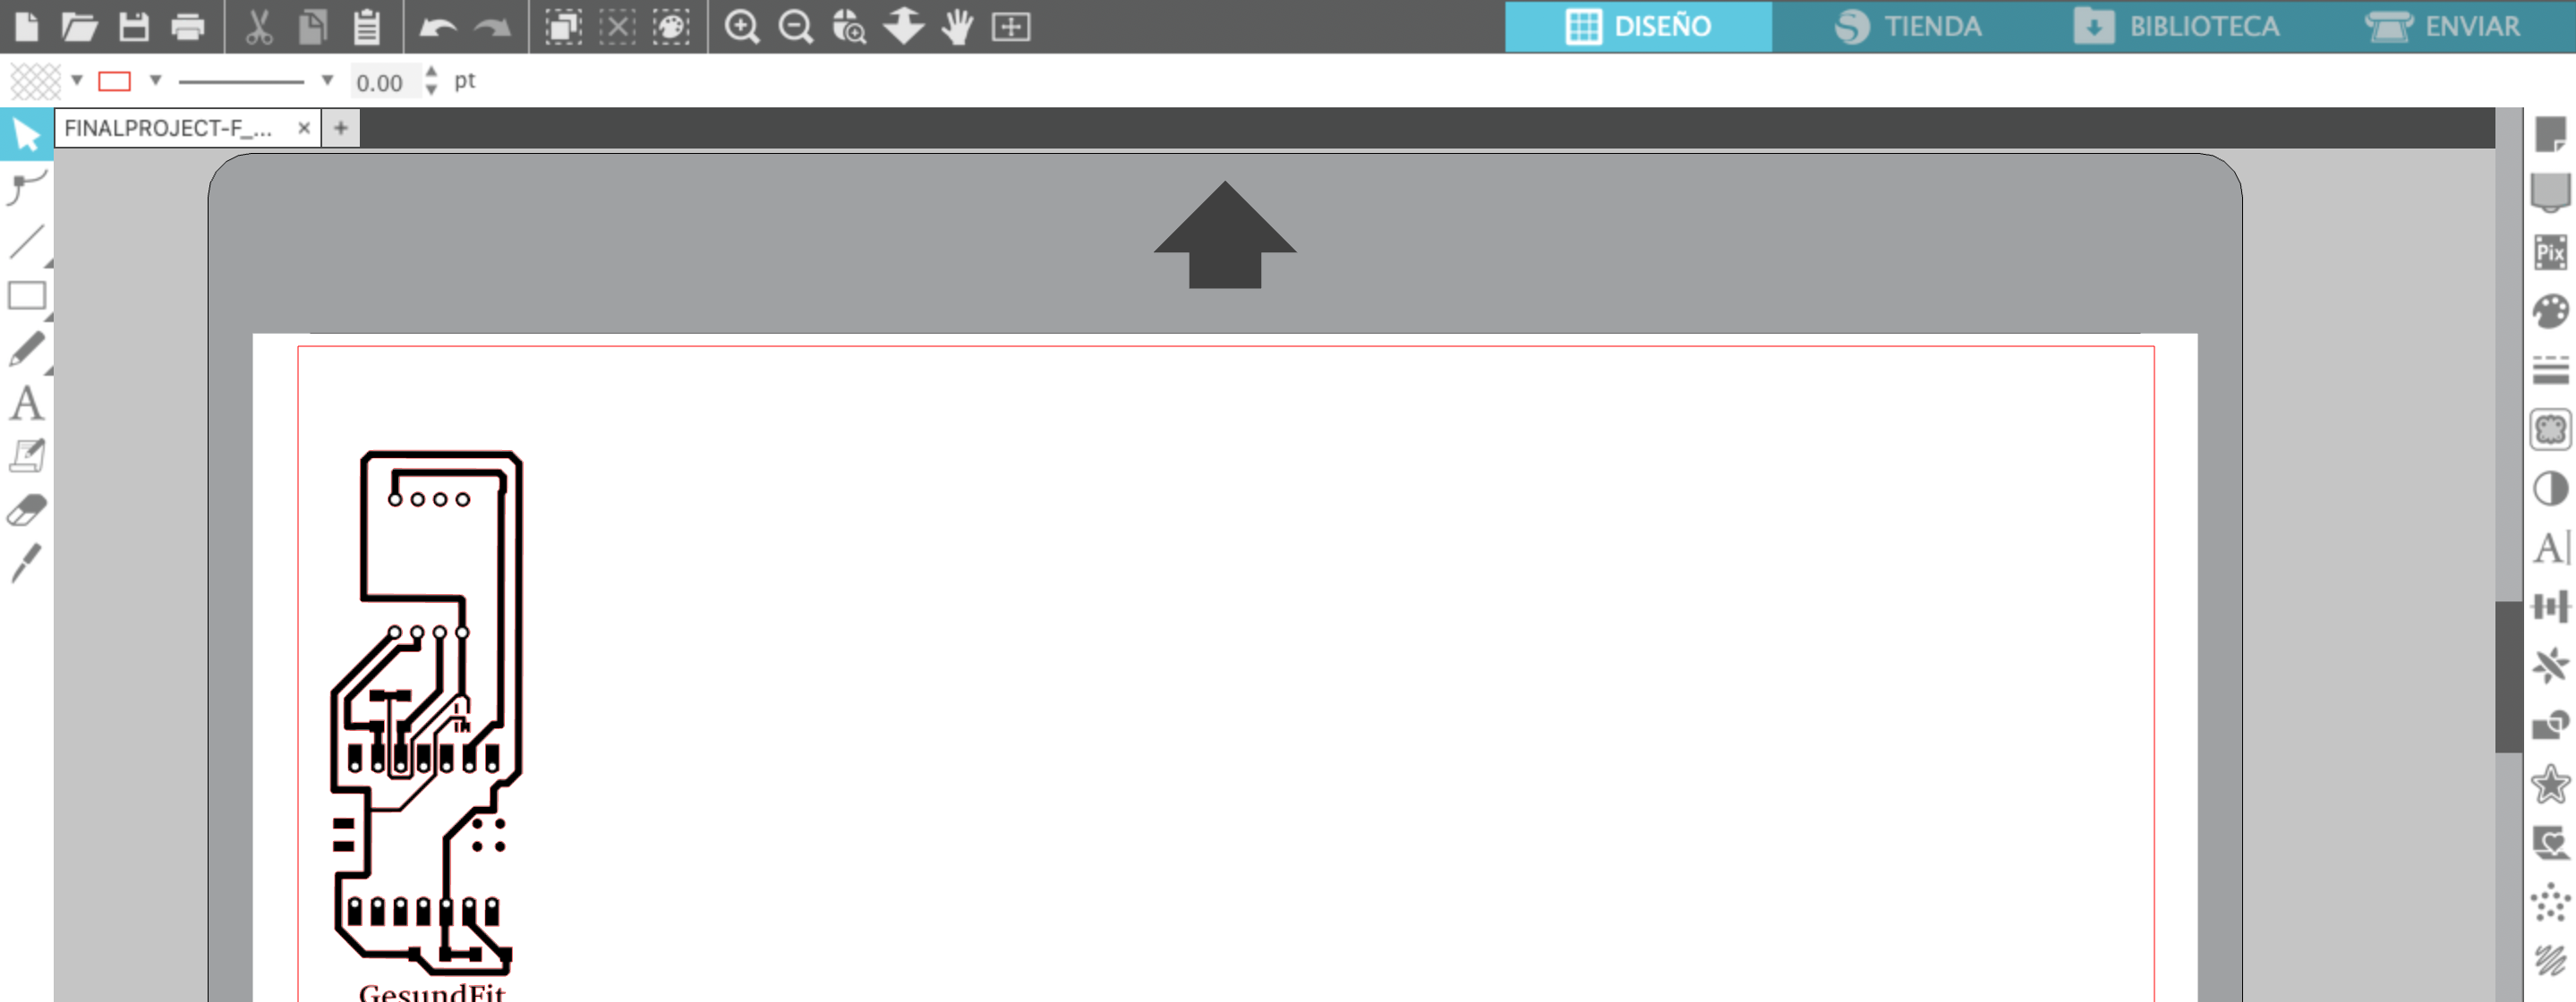
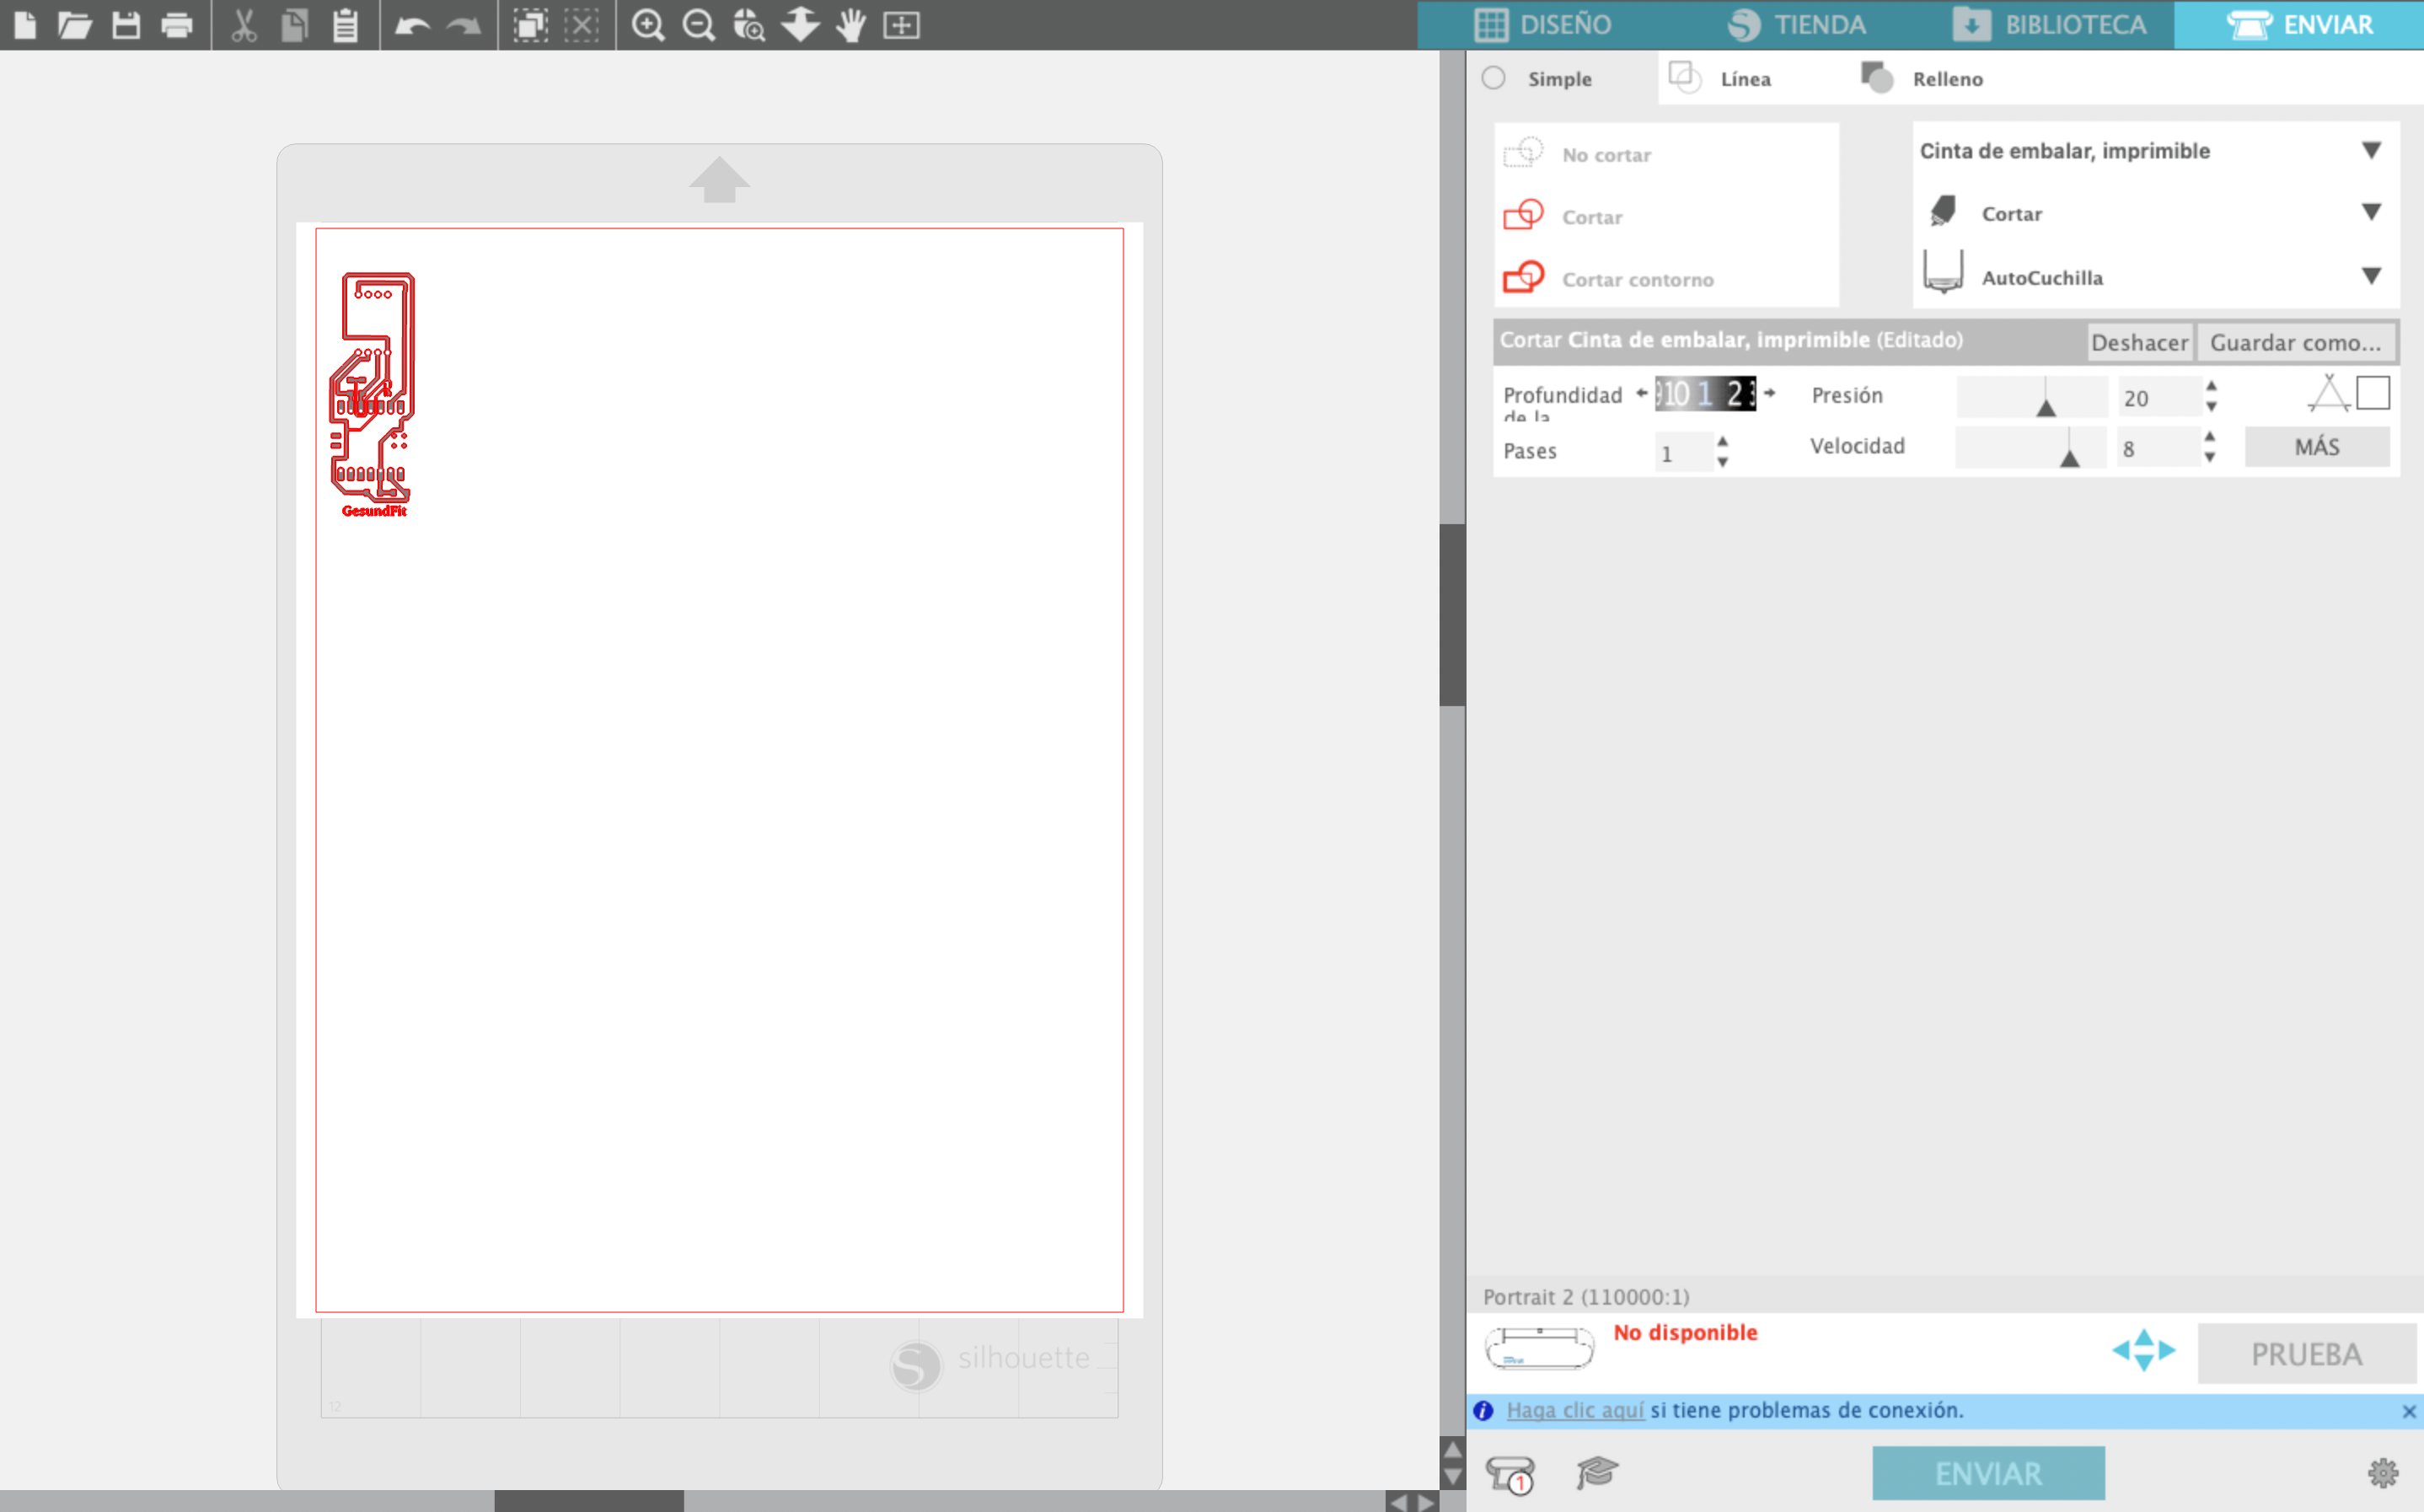
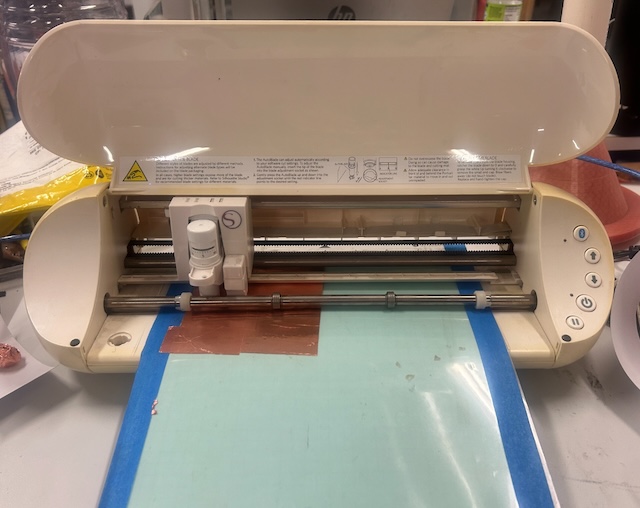
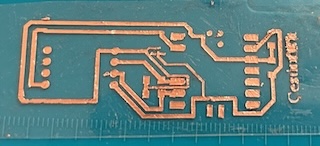
With the PCB cutting format ready, I went to the Silhouette Studio program, where I cut the PCB.

Step 5
Within the program, you insert the image and arrange it on the cutting sheet.
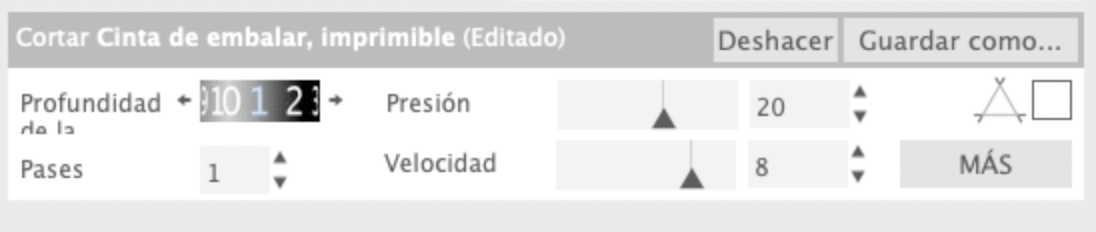
Step 6
Once the PNG is ready, you adjust the cutting machine settings to cut with a depth of 1, a pressure of 20, and a speed of 8.
Step 7
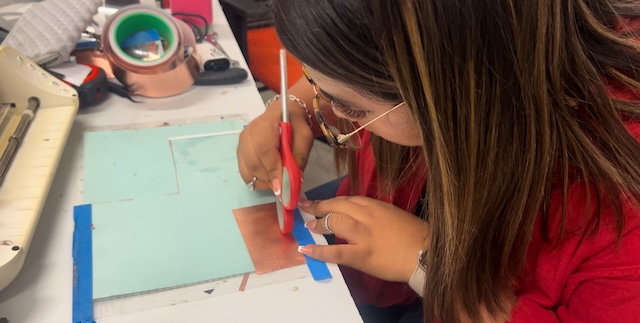
Once ready, I placed the acetate on top of the cutting sheet of the machine with two layers of copper tape stacked on each other to make the PCB guides more durable.
Step 8
Once everything was ready, I loaded the sheet into the machine and it began cutting.
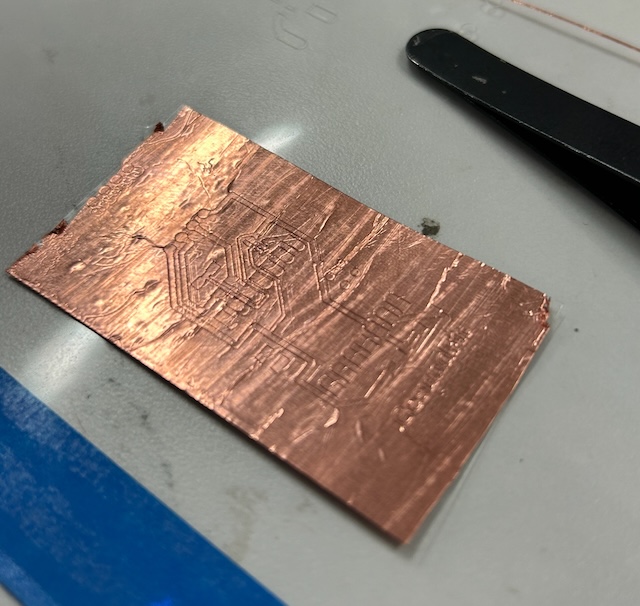
Step 9
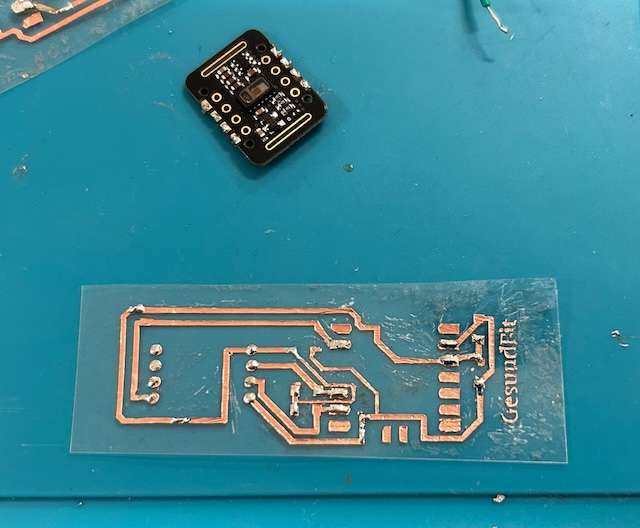
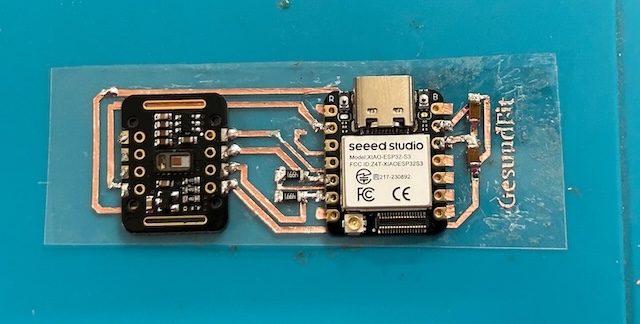
Afterwards, I used tweezers to remove the excess material, leaving the tracks of the board exposed and ready for soldering.
Step 10
Carefully, I soldered the components to avoid breaking the tracks. After nearly 15 attempts, including errors and resoldering, I finally achieved the final soldered PCB.
Files
Programming Board
Now, with the board soldered, it is ready to be programmed.
Step 1
First, I wanted to ensure there was a connection between the XIAO and the sensors, so I wrote a code in Arduino to function as an I2C scanner.
					// Arduino I2C Scanner
					#include

					void setup() {
					  Wire.begin();
					  Serial.begin(9600);
					  while (!Serial); // Wait for the serial connection
					  Serial.println("\nI2C Scanner");
					}

					void loop() {
					  byte error, address;
					  int nDevices;

					  Serial.println("Scanning...");

					  nDevices = 0;
					  for (address = 1; address < 127; address++) {
						Wire.beginTransmission(address);
						error = Wire.endTransmission();

						if (error == 0) {
						  Serial.print("I2C device found at address 0x");
						  if (address < 16)
							Serial.print("0");
						  Serial.print(address, HEX);
						  Serial.println("  !");

						  nDevices++;
						} else if (error == 4) {
						  Serial.print("Unknown error at address 0x");
						  if (address < 16)
							Serial.print("0");
						  Serial.println(address, HEX);
						}
					  }
					  if (nDevices == 0)
						Serial.println("No I2C devices found\n");
					  else
						Serial.println("done\n");

					  delay(5000); // wait 5 seconds for next scan
					}
Step 2
So, I uploaded this code to my board to verify the communication between the XIAO and the sensors.
And it work´s there is a clearly conextion between the XIAO and the sensors.
Step 3
Once the connection was established, I wrote code to read temperature, oxygenation, and heart rate by taking multiple samples with the infrared sensor. These samples were averaged to determine the values of each variable.
At the same time, I also sought to implement a WiFi connection, using my phone's WiFi, to establish connectivity right from the start with the app that I will explain later.
							#include
								#include
								#include
								#include
								#include "MAX30105.h"
								#include "spo2_algorithm.h"

								MAX30105 particleSensor;

								#define MAX_BRIGHTNESS 255

								#if defined(__AVR_ATmega328P__) || defined(__AVR_ATmega168__)
								// Arduino Uno doesn't have enough SRAM to store 100 samples of IR led data and red led data in 32-bit format
								// To solve this problem, 16-bit MSB of the sampled data will be truncated. Samples become 16-bit data.
								uint16_t irBuffer[100]; // infrared LED sensor data
								uint16_t redBuffer[100];  // red LED sensor data
								#else
								uint32_t irBuffer[100]; // infrared LED sensor data
								uint32_t redBuffer[100];  // red LED sensor data
								#endif

								int32_t bufferLength; // data length
								int32_t spo2; // SPO2 value
								int8_t validSPO2; // indicator to show if the SPO2 calculation is valid
								int32_t fc; // heart rate value
								int8_t validFC; // indicator to show if the heart rate calculation is valid
								float temp = 36.0; // fixed temperature value

								byte pulseLED = 1; // Must be on PWM pin
								byte readLED = 13; // Blinks with each data read

								const char* ssid = "iphone de Valeria (6)";
								const char* password = "hola1234";

								const char* serverName = "https://gesundfitapi.onrender.com/api/valeria/";

								void setup() {
								  Serial.begin(115200); // initialize serial communication at 115200 bits per second:

								  pinMode(pulseLED, OUTPUT);
								  pinMode(readLED, OUTPUT);

								  // Initialize sensor
								  if (!particleSensor.begin(Wire, I2C_SPEED_FAST)) { // Use default I2C port, 400kHz speed
									Serial.println(F("MAX30105 was not found. Please check wiring/power."));
									while (1);
								  }

								  Serial.println(F("Attach sensor to finger with rubber band. Press any key to start conversion"));
								  while (Serial.available() == 0); // wait until user presses a key
								  Serial.read();

								  byte ledBrightness = 60; // Options: 0=Off to 255=50mA
								  byte sampleAverage = 4; // Options: 1, 2, 4, 8, 16, 32
								  byte ledMode = 2; // Options: 1 = Red only, 2 = Red + IR, 3 = Red + IR + Green
								  byte sampleRate = 100; // Options: 50, 100, 200, 400, 800, 1000, 1600, 3200
								  int pulseWidth = 411; // Options: 69, 118, 215, 411
								  int adcRange = 4096; // Options: 2048, 4096, 8192, 16384

								  particleSensor.setup(ledBrightness, sampleAverage, ledMode, sampleRate, pulseWidth, adcRange); // Configure sensor with these settings

								  WiFi.begin(ssid, password);
								  Serial.print("Conectando a WiFi...");
								  while (WiFi.status() != WL_CONNECTED) {
									delay(1000);
									Serial.print(".");
								  }
								  Serial.println("Conectado a la red WiFi");
								}

								void loop() {
								  bufferLength = 100; // buffer length of 100 stores 4 seconds of samples running at 25sps

								  // read the first 100 samples, and determine the signal range
								  for (byte i = 0; i < bufferLength; i++) {
									while (particleSensor.available() == false) // do we have new data?
									  particleSensor.check(); // Check the sensor for new data

									redBuffer[i] = particleSensor.getRed();
									irBuffer[i] = particleSensor.getIR();
									particleSensor.nextSample(); // We're finished with this sample so move to next sample

									Serial.print(F("red="));
									Serial.print(redBuffer[i], DEC);
									Serial.print(F(", ir="));
									Serial.println(irBuffer[i], DEC);
								  }

								  // calculate heart rate and SpO2 after first 100 samples (first 4 seconds of samples)
								  maxim_heart_rate_and_oxygen_saturation(irBuffer, bufferLength, redBuffer, &spo2, &validSPO2, &fc, &validFC);

								  // Continuously taking samples from MAX30102. Heart rate and SpO2 are calculated every 1 second
								  while (1) {
									// dumping the first 25 sets of samples in the memory and shift the last 75 sets of samples to the top
									for (byte i = 25; i < 100; i++) {
									  redBuffer[i - 25] = redBuffer[i];
									  irBuffer[i - 25] = irBuffer[i];
									}

									// take 25 sets of samples before calculating the heart rate.
									for (byte i = 75; i < 100; i++) {
									  while (particleSensor.available() == false) // do we have new data?
										particleSensor.check(); // Check the sensor for new data

									  digitalWrite(readLED, !digitalRead(readLED)); // Blink onboard LED with every data read

									  redBuffer[i] = particleSensor.getRed();
									  irBuffer[i] = particleSensor.getIR();
									  particleSensor.nextSample(); // We're finished with this sample so move to next sample

									  // send samples and calculation result to terminal program through UART
									  Serial.print(F("red="));
									  Serial.print(redBuffer[i], DEC);
									  Serial.print(F(", ir="));
									  Serial.print(irBuffer[i], DEC);

									  Serial.print(F(", FC="));
									  Serial.print(fc, DEC);

									  Serial.print(F(", FCvalid="));
									  Serial.print(validFC, DEC);

									  Serial.print(F(", SPO2="));
									  Serial.print(spo2, DEC);

									  Serial.print(F(", SPO2Valid="));
									  Serial.println(validSPO2, DEC);

									  Serial.print(F(", TEMP="));
									  Serial.print(temp, 1); // print the temperature with one decimal place

									  Serial.print(F(", TEMPvalid="));
									  Serial.println(1); // assuming the temperature is always valid
									}

									// After gathering 25 new samples recalculate HR and SP02
									maxim_heart_rate_and_oxygen_saturation(irBuffer, bufferLength, redBuffer, &spo2, &validSPO2, &fc, &validFC);

									// Send data to server
									sendHealthData(fc, spo2, temp);
								  }
								}

								void sendHealthData(int32_t fc, int32_t spo2, float temp) {
								  if (WiFi.status() == WL_CONNECTED) {
									HTTPClient http;
									// Specify the URL of the API
									http.begin(serverName);
									// Specify the content type
									http.addHeader("Content-Type", "application/json");
									// Create the JSON payload to send
									String jsonPayload = "{\"fc\": \"" + String(fc) + "\", \"spo2\": \"" + String(spo2) + "\", \"temp\": \"" + String(temp, 1) + "\"}";
									// Send the POST request
									int httpResponseCode = http.POST(jsonPayload);
									// Check the response from the server
									if (httpResponseCode > 0) {
									  String response = http.getString();
									  Serial.println(httpResponseCode);
									  Serial.println(response);
									} else {
									  Serial.print("Error en la solicitud: ");
									  Serial.println(httpResponseCode);
									}
									// End the connection
									http.end();
								  } else {
									Serial.println("Error en la conexión WiFi");
								  }
								}
Step 4
For this code, I needed to install the following libraries in Arduino
| Library Name | Purpose |
|---|---|
| SparkFun MAX3010x Library | Used for interfacing with the MAX30100, MAX30101, and MAX30102 pulse oximeter and heart-rate sensor modules. |
| EspSoftwareSerial | Enables serial communication on other digital pins of the ESP8266 and ESP32, similar to the Arduino SoftwareSerial library. |
| ArduinoHttpClient | Facilitates HTTP communication for interacting with web servers and APIs. |
Step 5
After having everything ready, I tested the internet connection to ensure it was established, as it was crucial for connecting the data from the XIAO and sending it to our database.
Step 6
Once the connection was ready, it was time to verify that the code could correctly read the vital signs.
| Variable name | Meaning |
|---|---|
| TemValid=1 | Means that value of the temperature is valid. |
| FCValid=1 | Means that the Heart Beat rate is valid. |
| SPO2Valid=1 | Means that the spo2 is valid. |
Since everything is working correctly, it is time to link the information from the XIAO with the app.
Files
App Desing
For the app design, I decided to use Flutter Flow. Considering the need for a database, I used various programs to create a connection from the XIAO via WiFi to an API using the RENDER program, as it facilitates the connection between GitLab and Firebase.
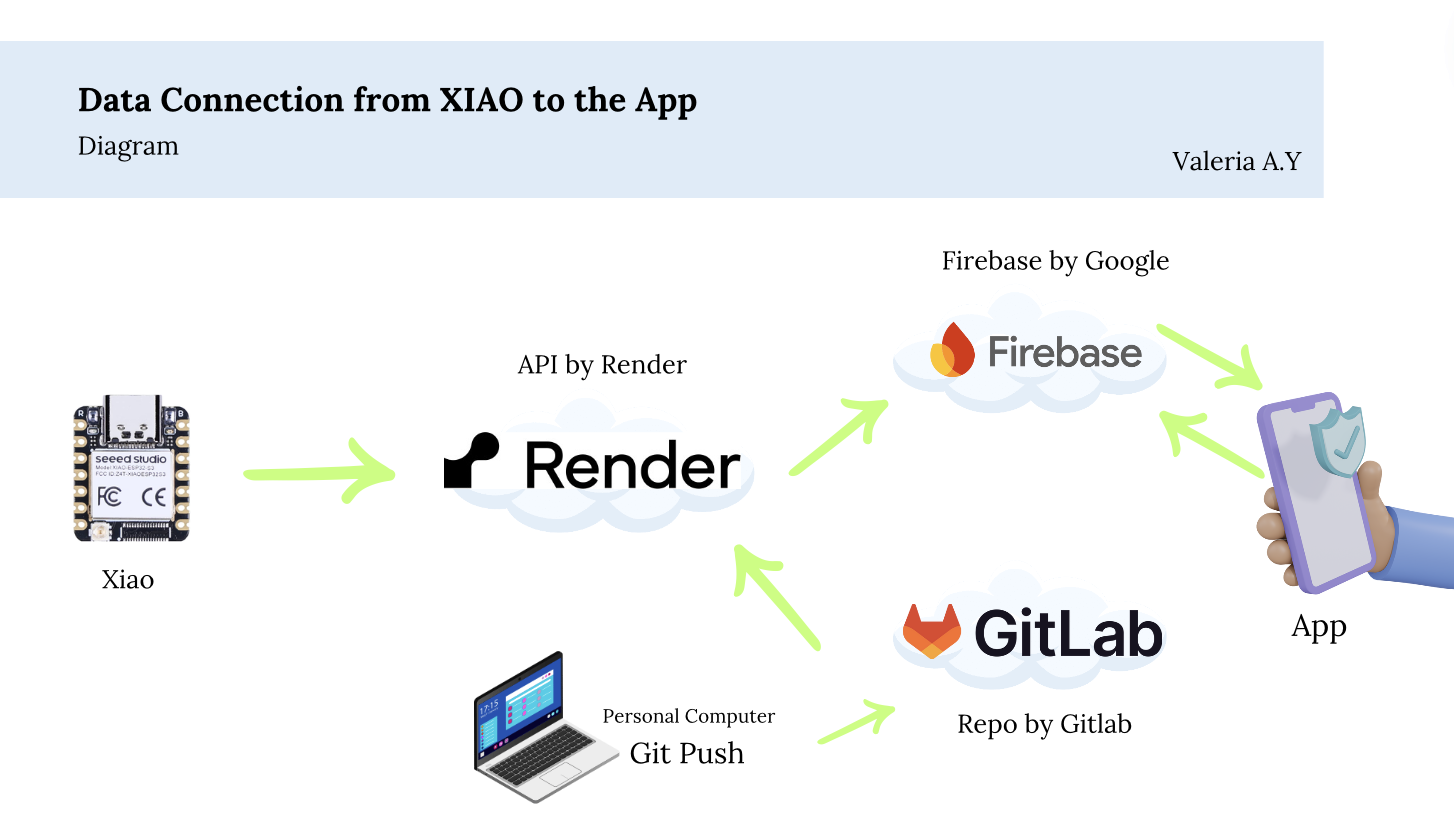
| Program | Description |
|---|---|
| XIAO | Collects sensor data and sends it via WiFi. |
| WiFi Connection | Enables XIAO to connect to the internet and communicate with the API. |
| API Endpoint (RENDER) | Acts as an intermediary, receiving data from XIAO and forwarding it to Firebase. |
| GitLab | Manages the API code, ensuring it is up-to-date and functional. |
| Firebase | Stores the data received from the API and makes it accessible in real-time. |
| Flutter Flow App | Connects to Firebase to fetch and display the sensor data to the user. |
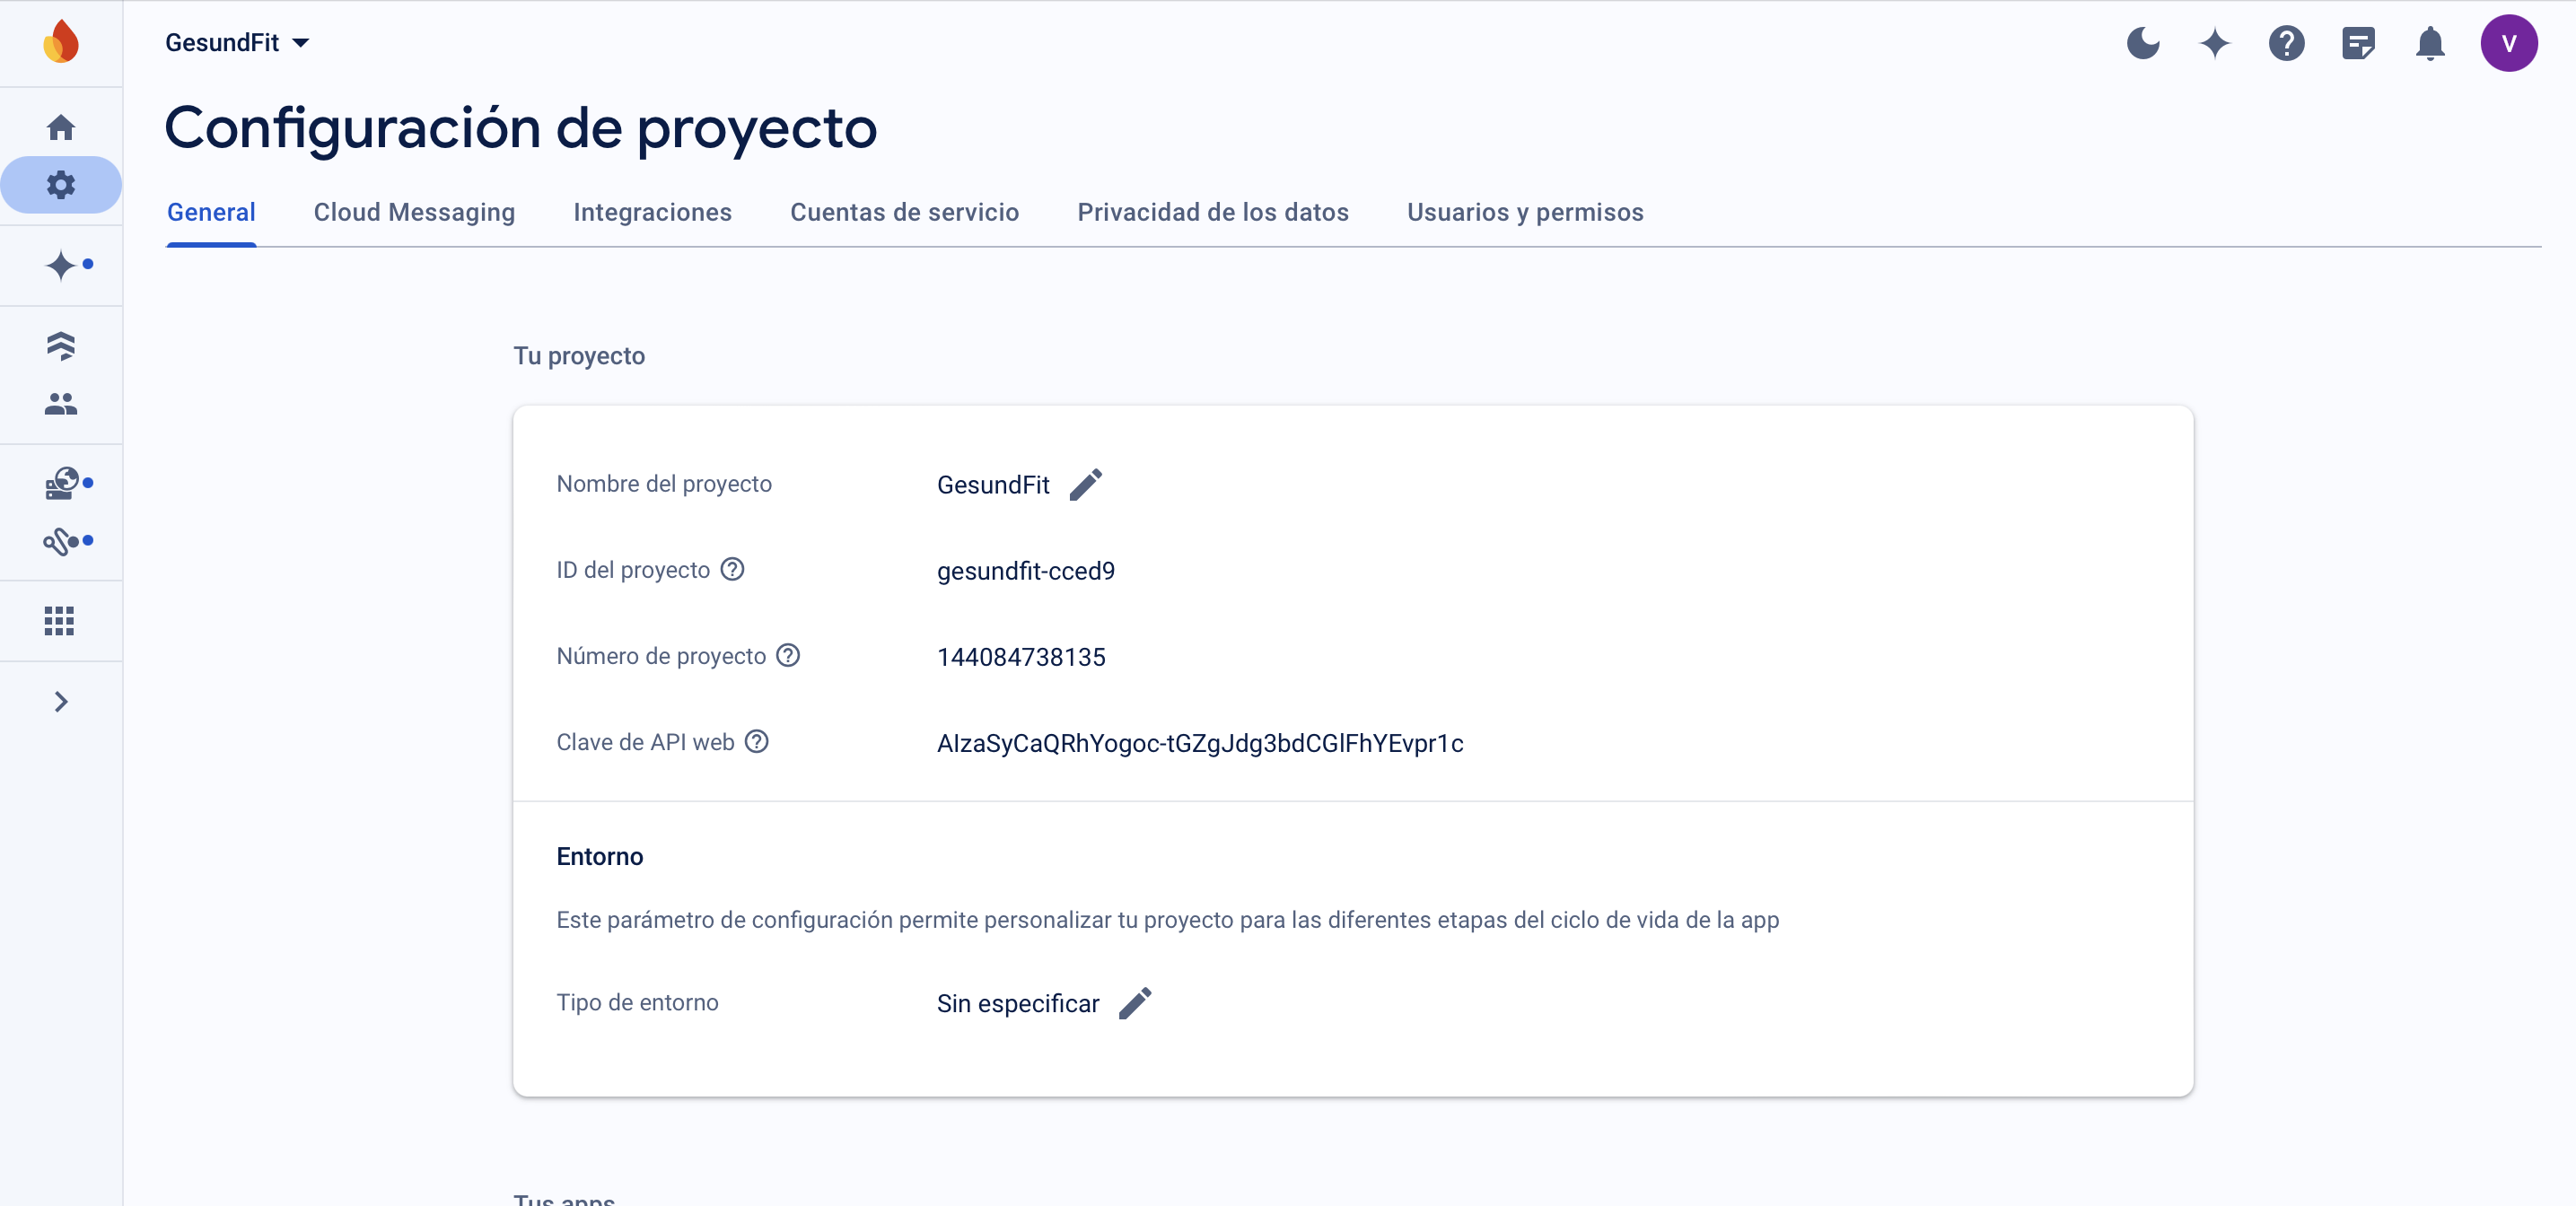
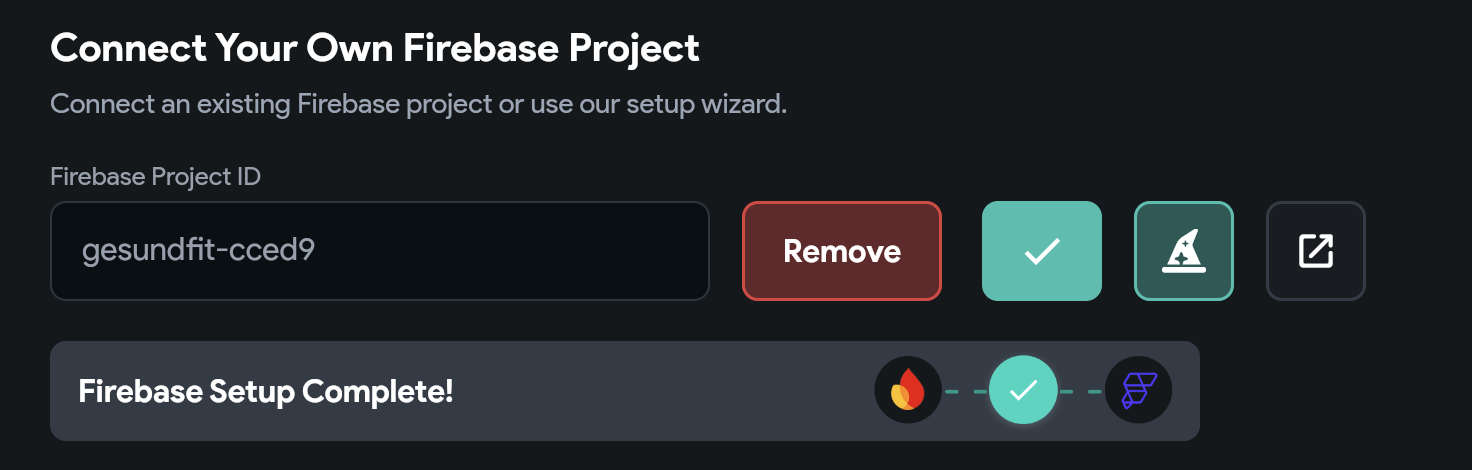
FireBase by Google
In Firebase, I created a database to receive data from the XIAO and link it with the app.
| Step | Action |
|---|---|
| Step 1 | Access the Firebase Console and create a new project. |
| Step 2 | Configure Firebase for your Flutter project: |
| Step 3 | Select or create a project in Firebase Console. |
| Step 4 | Connect with nummer in your Flutter Flow app, in settings |
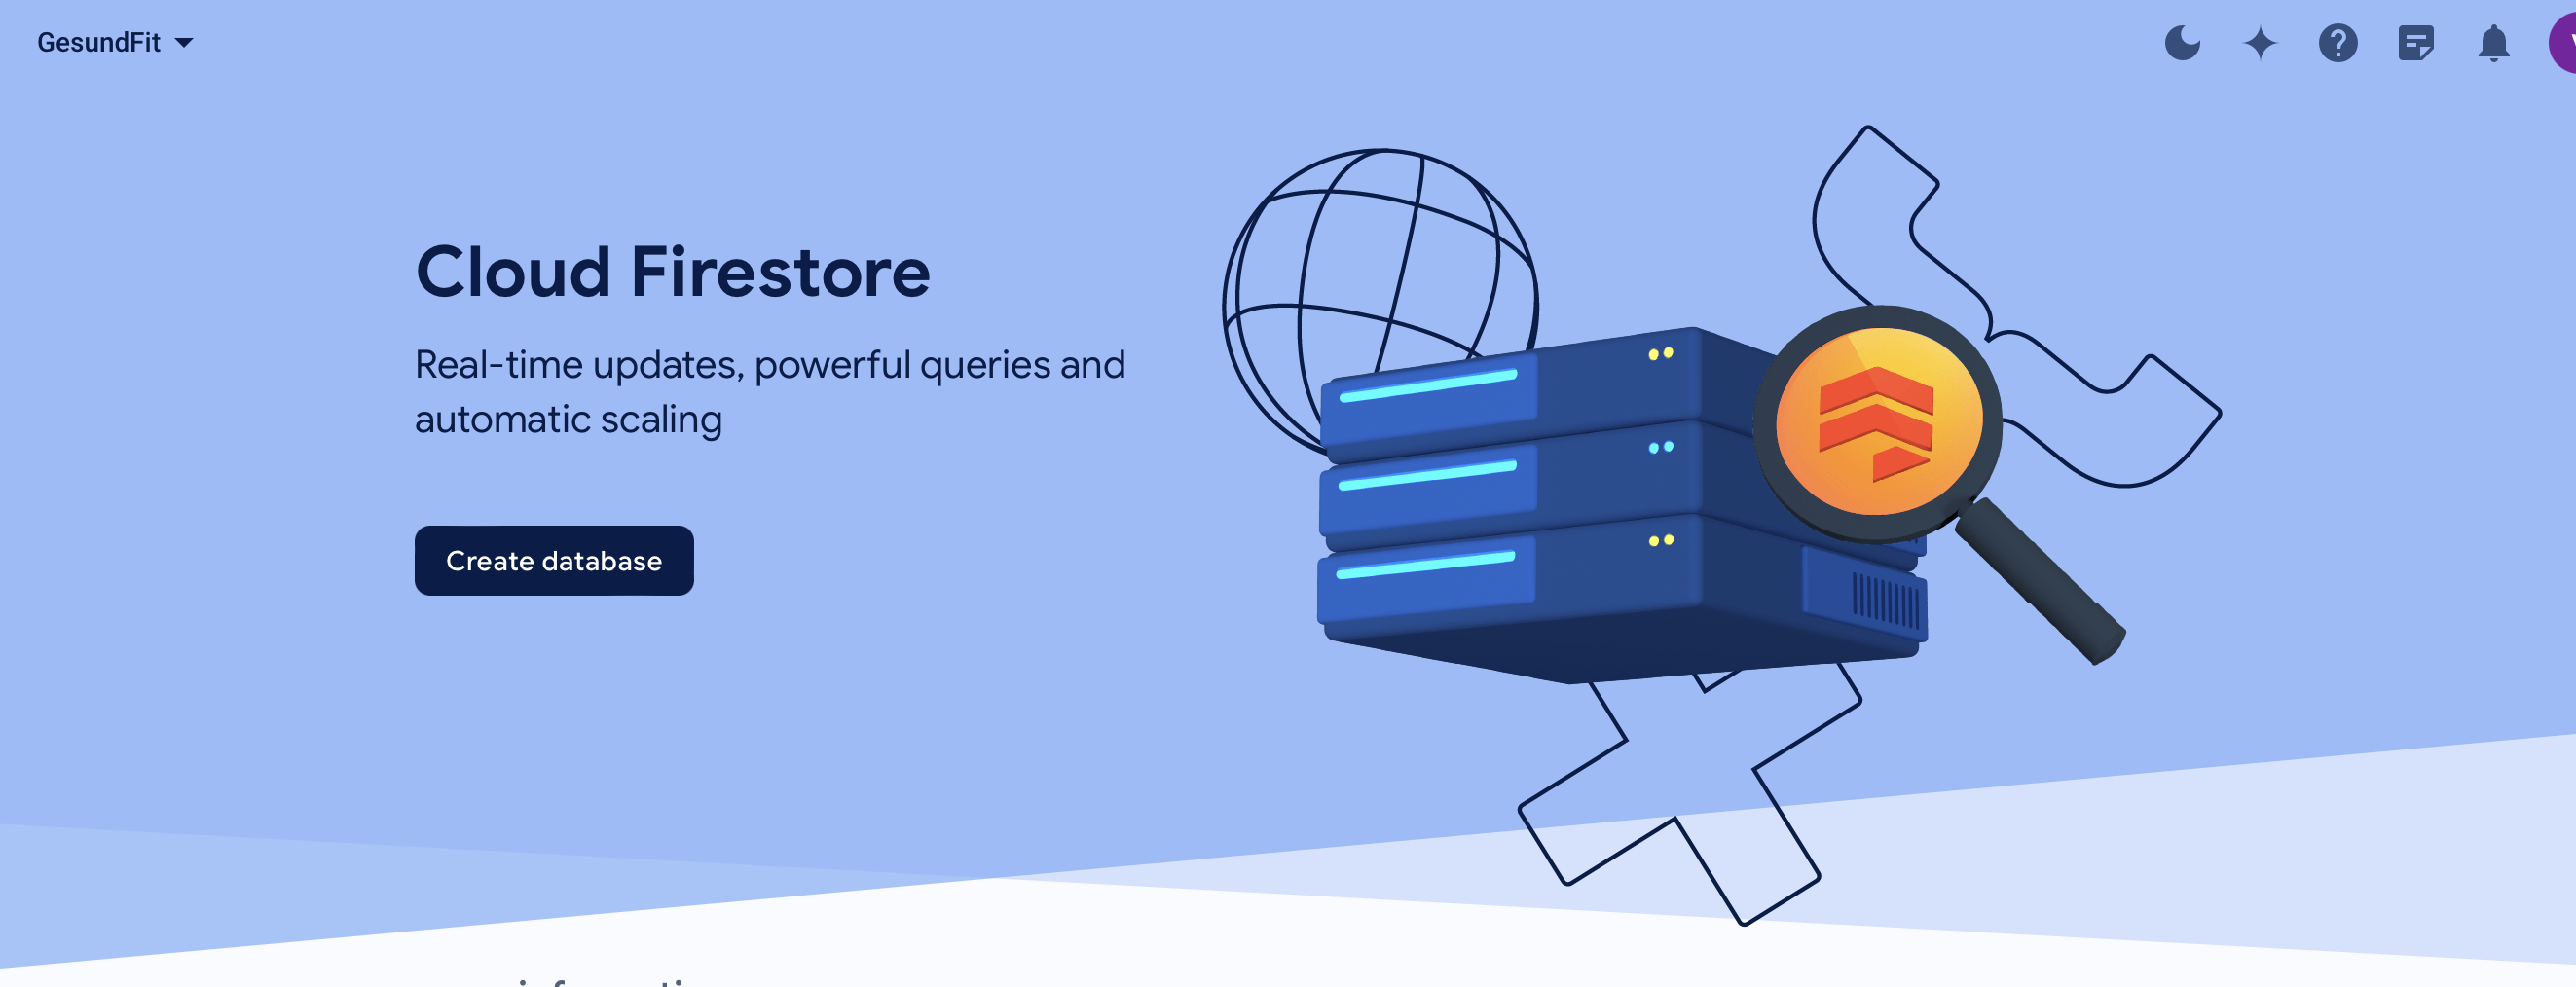
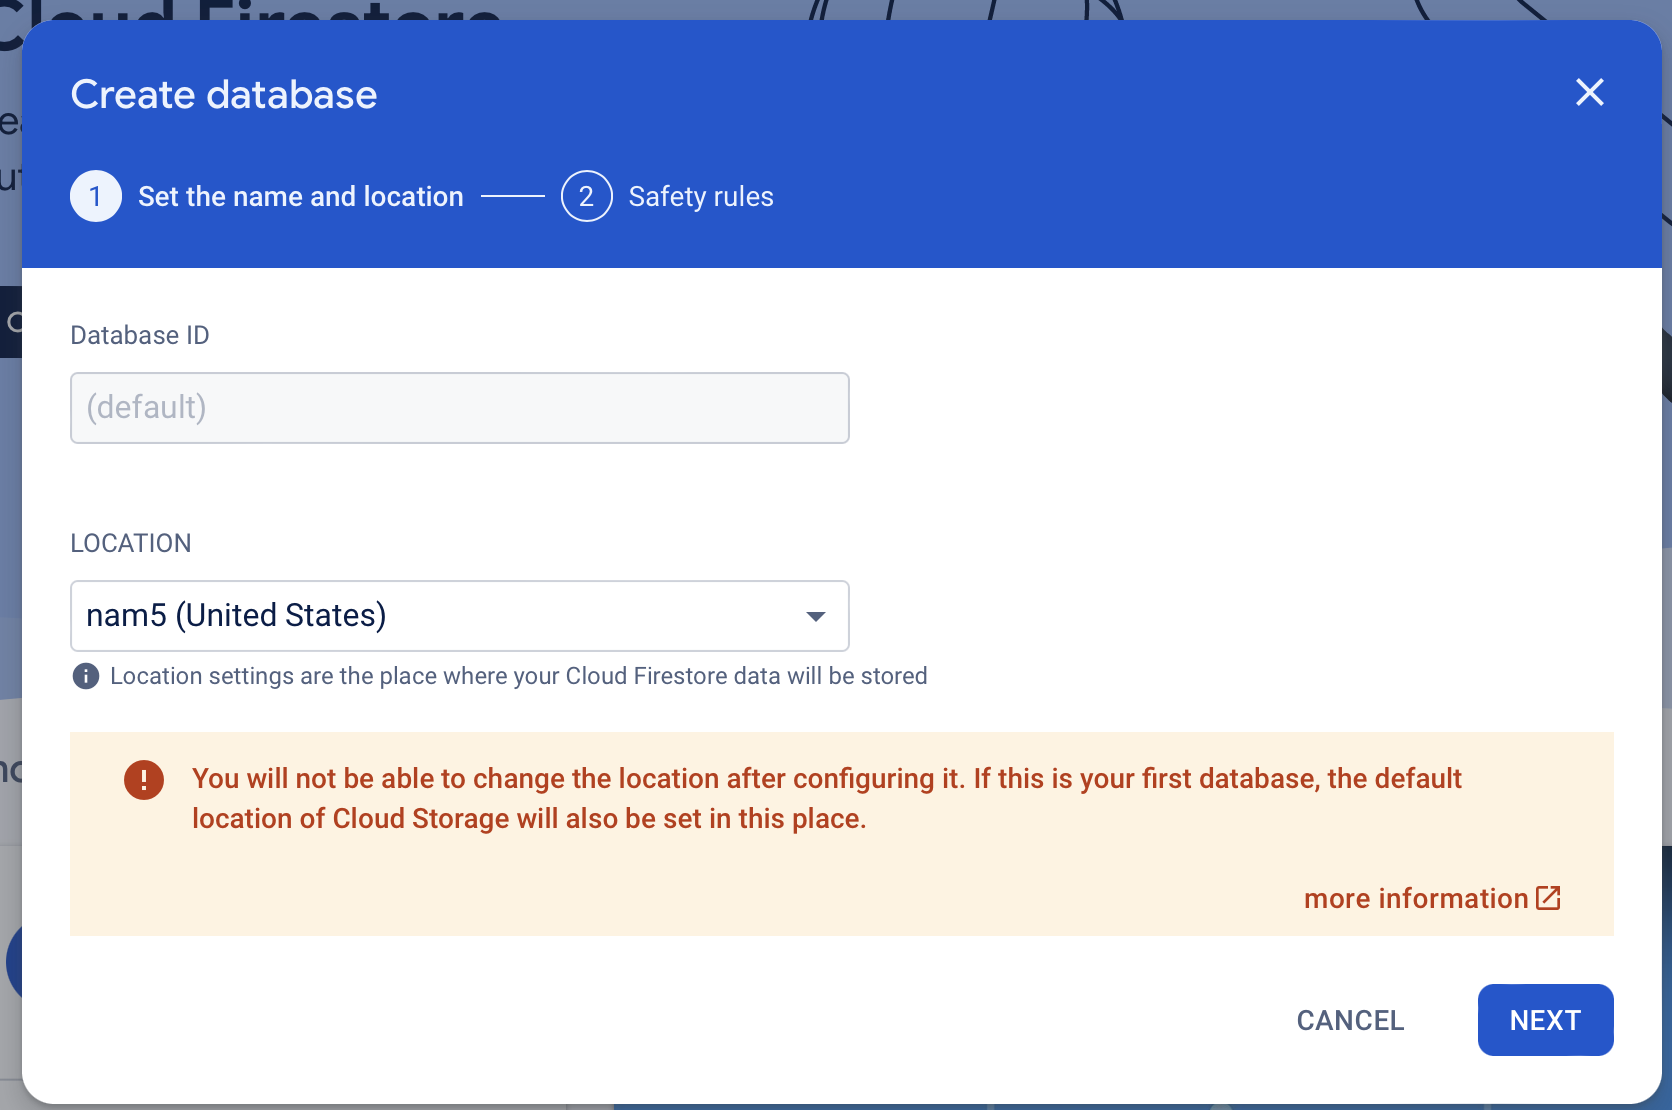
| Step 5 | Set up Firestore to store real-time data. Firestore is a flexible NoSQL database that you can use to store and synchronize data across your app clients. |


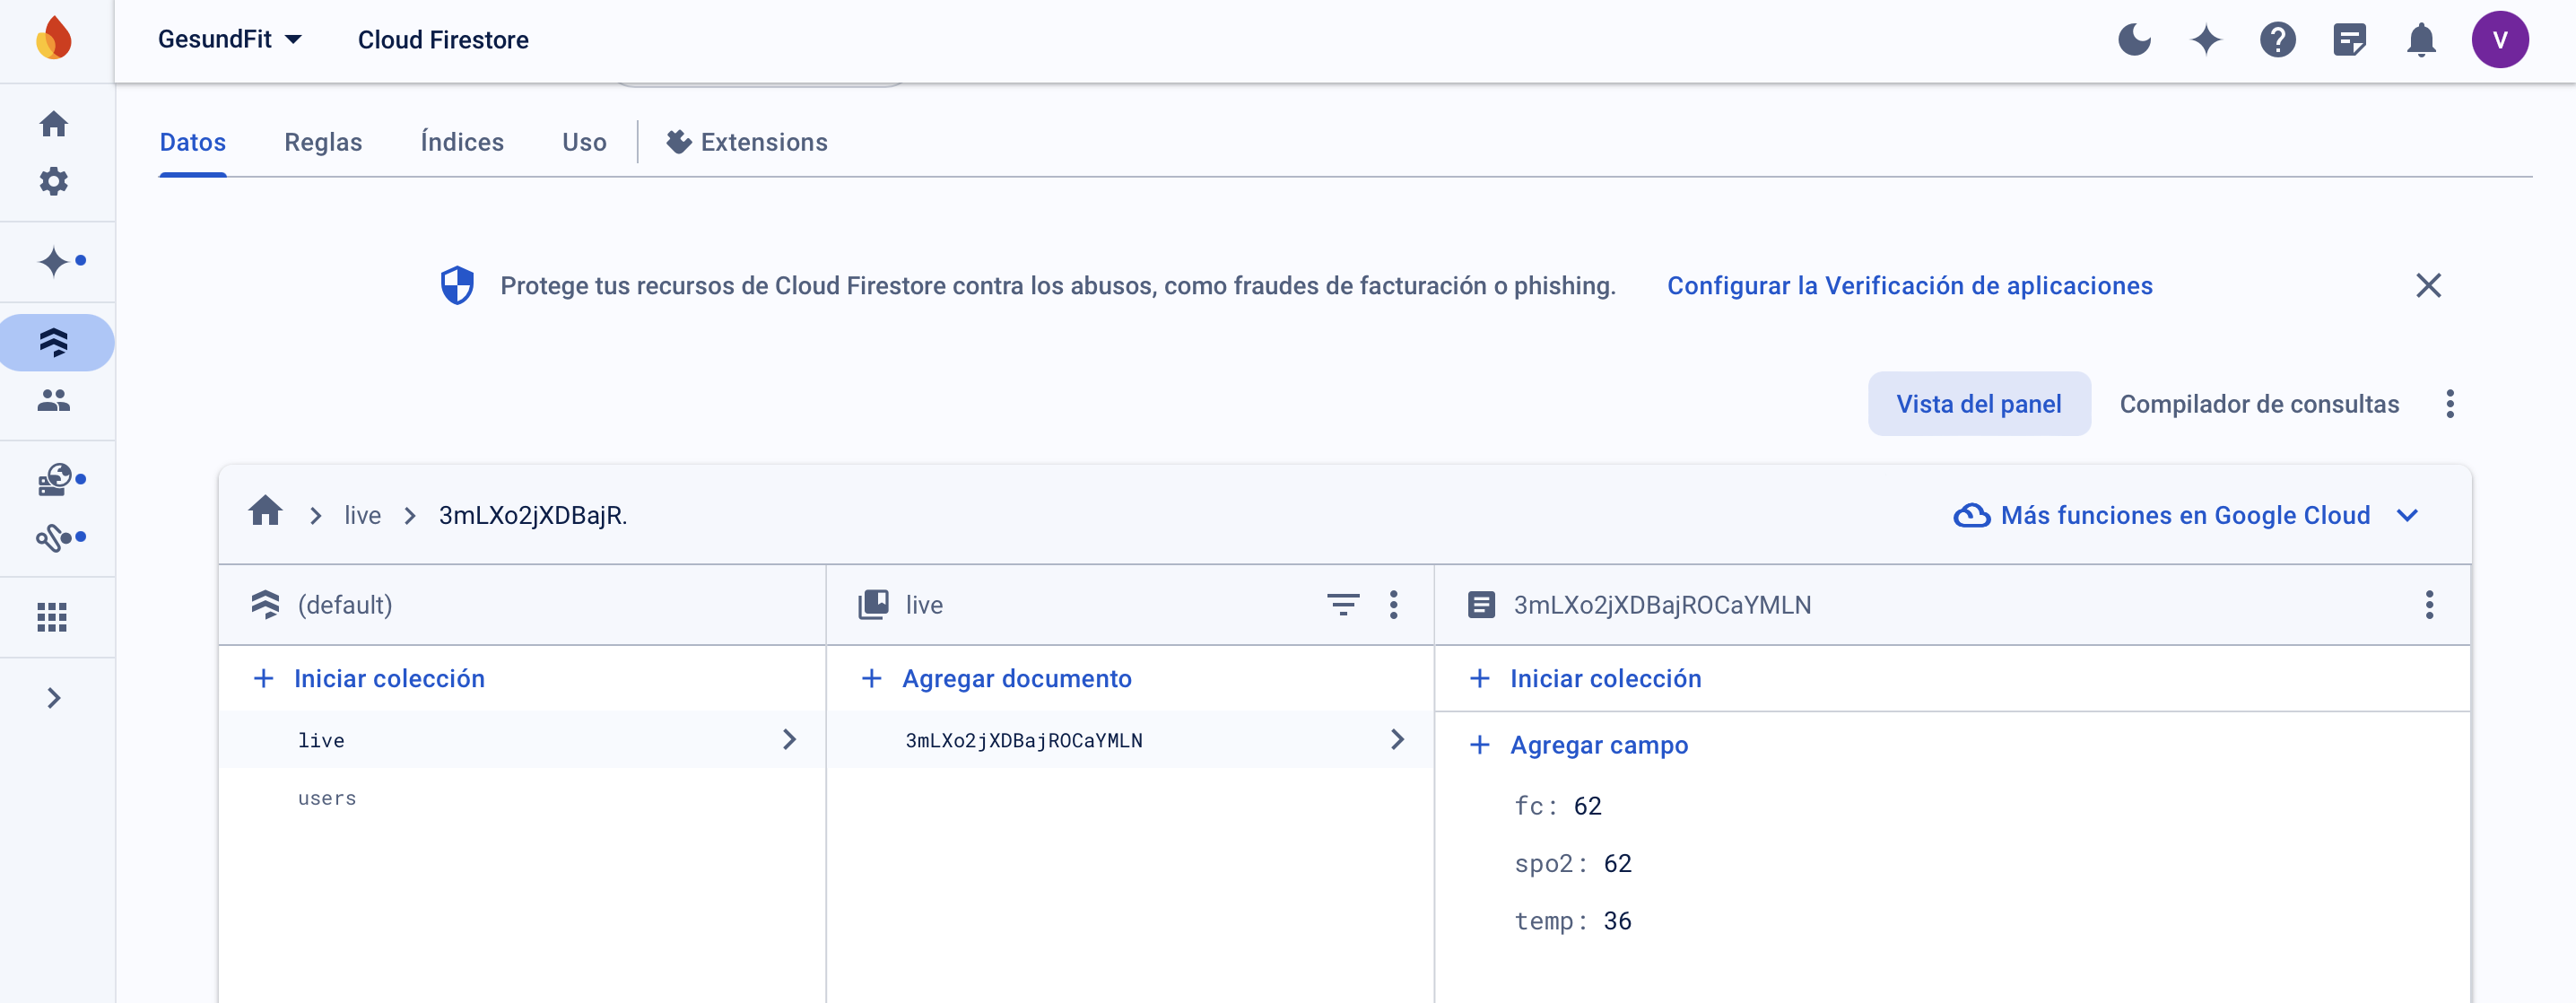
Once the database is set up with real-time defined variables, similar to those in the Arduino code, they are ready to be linked with the app in Flutter Flow.
Flutter Flow app desing
For the app design, I used Flutter Flow because its platform is more user-friendly than others, and I preferred its design over the alternatives.
Step 1
First, I created an account on the platform.
Step 2
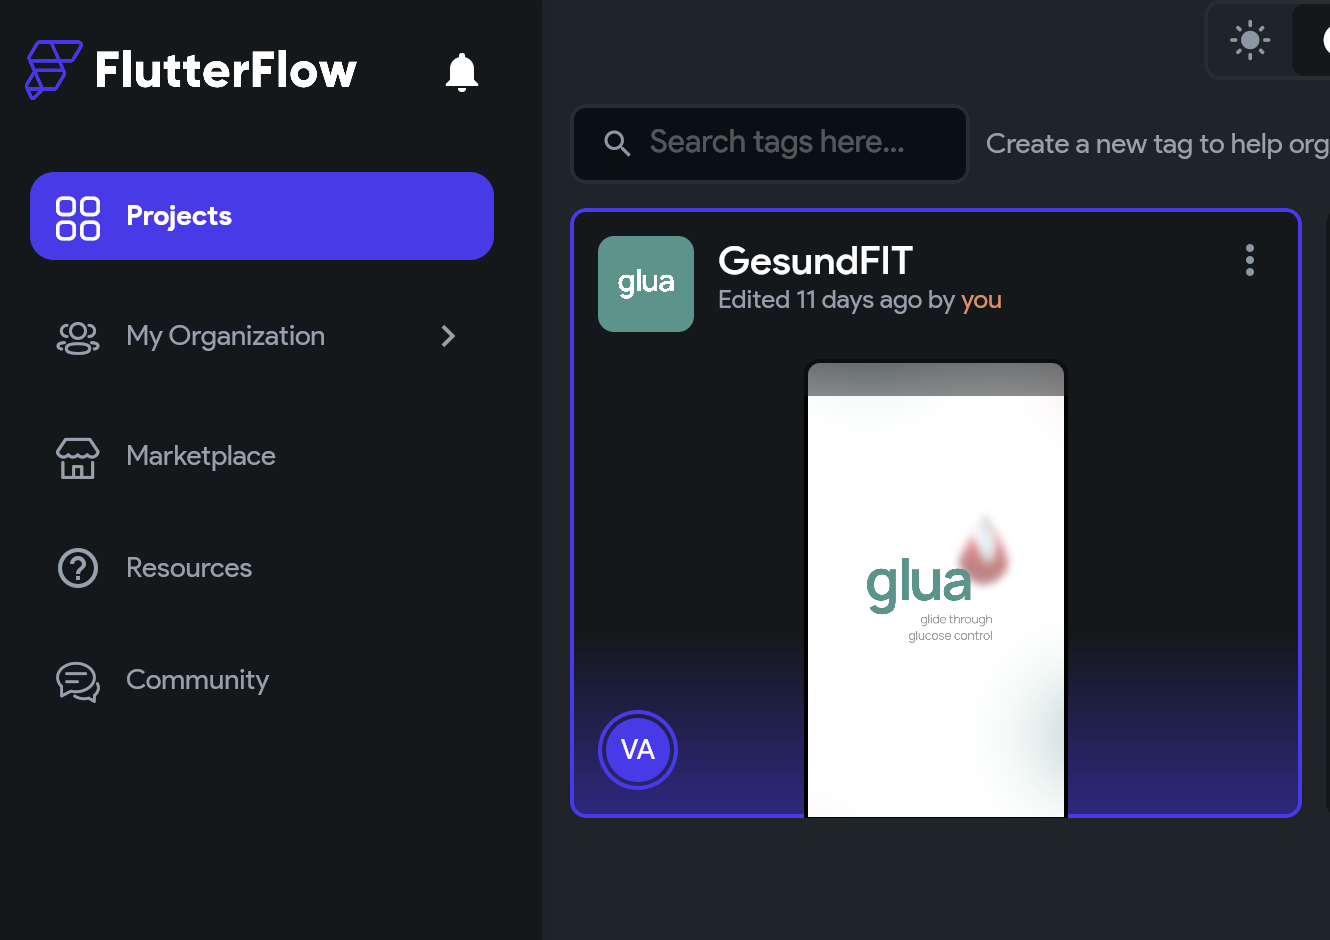
I created a new project named "GesundFit," which became the name of my app.
Step 3
Within the project, I used a template that I modified to suit my preferences and needs.
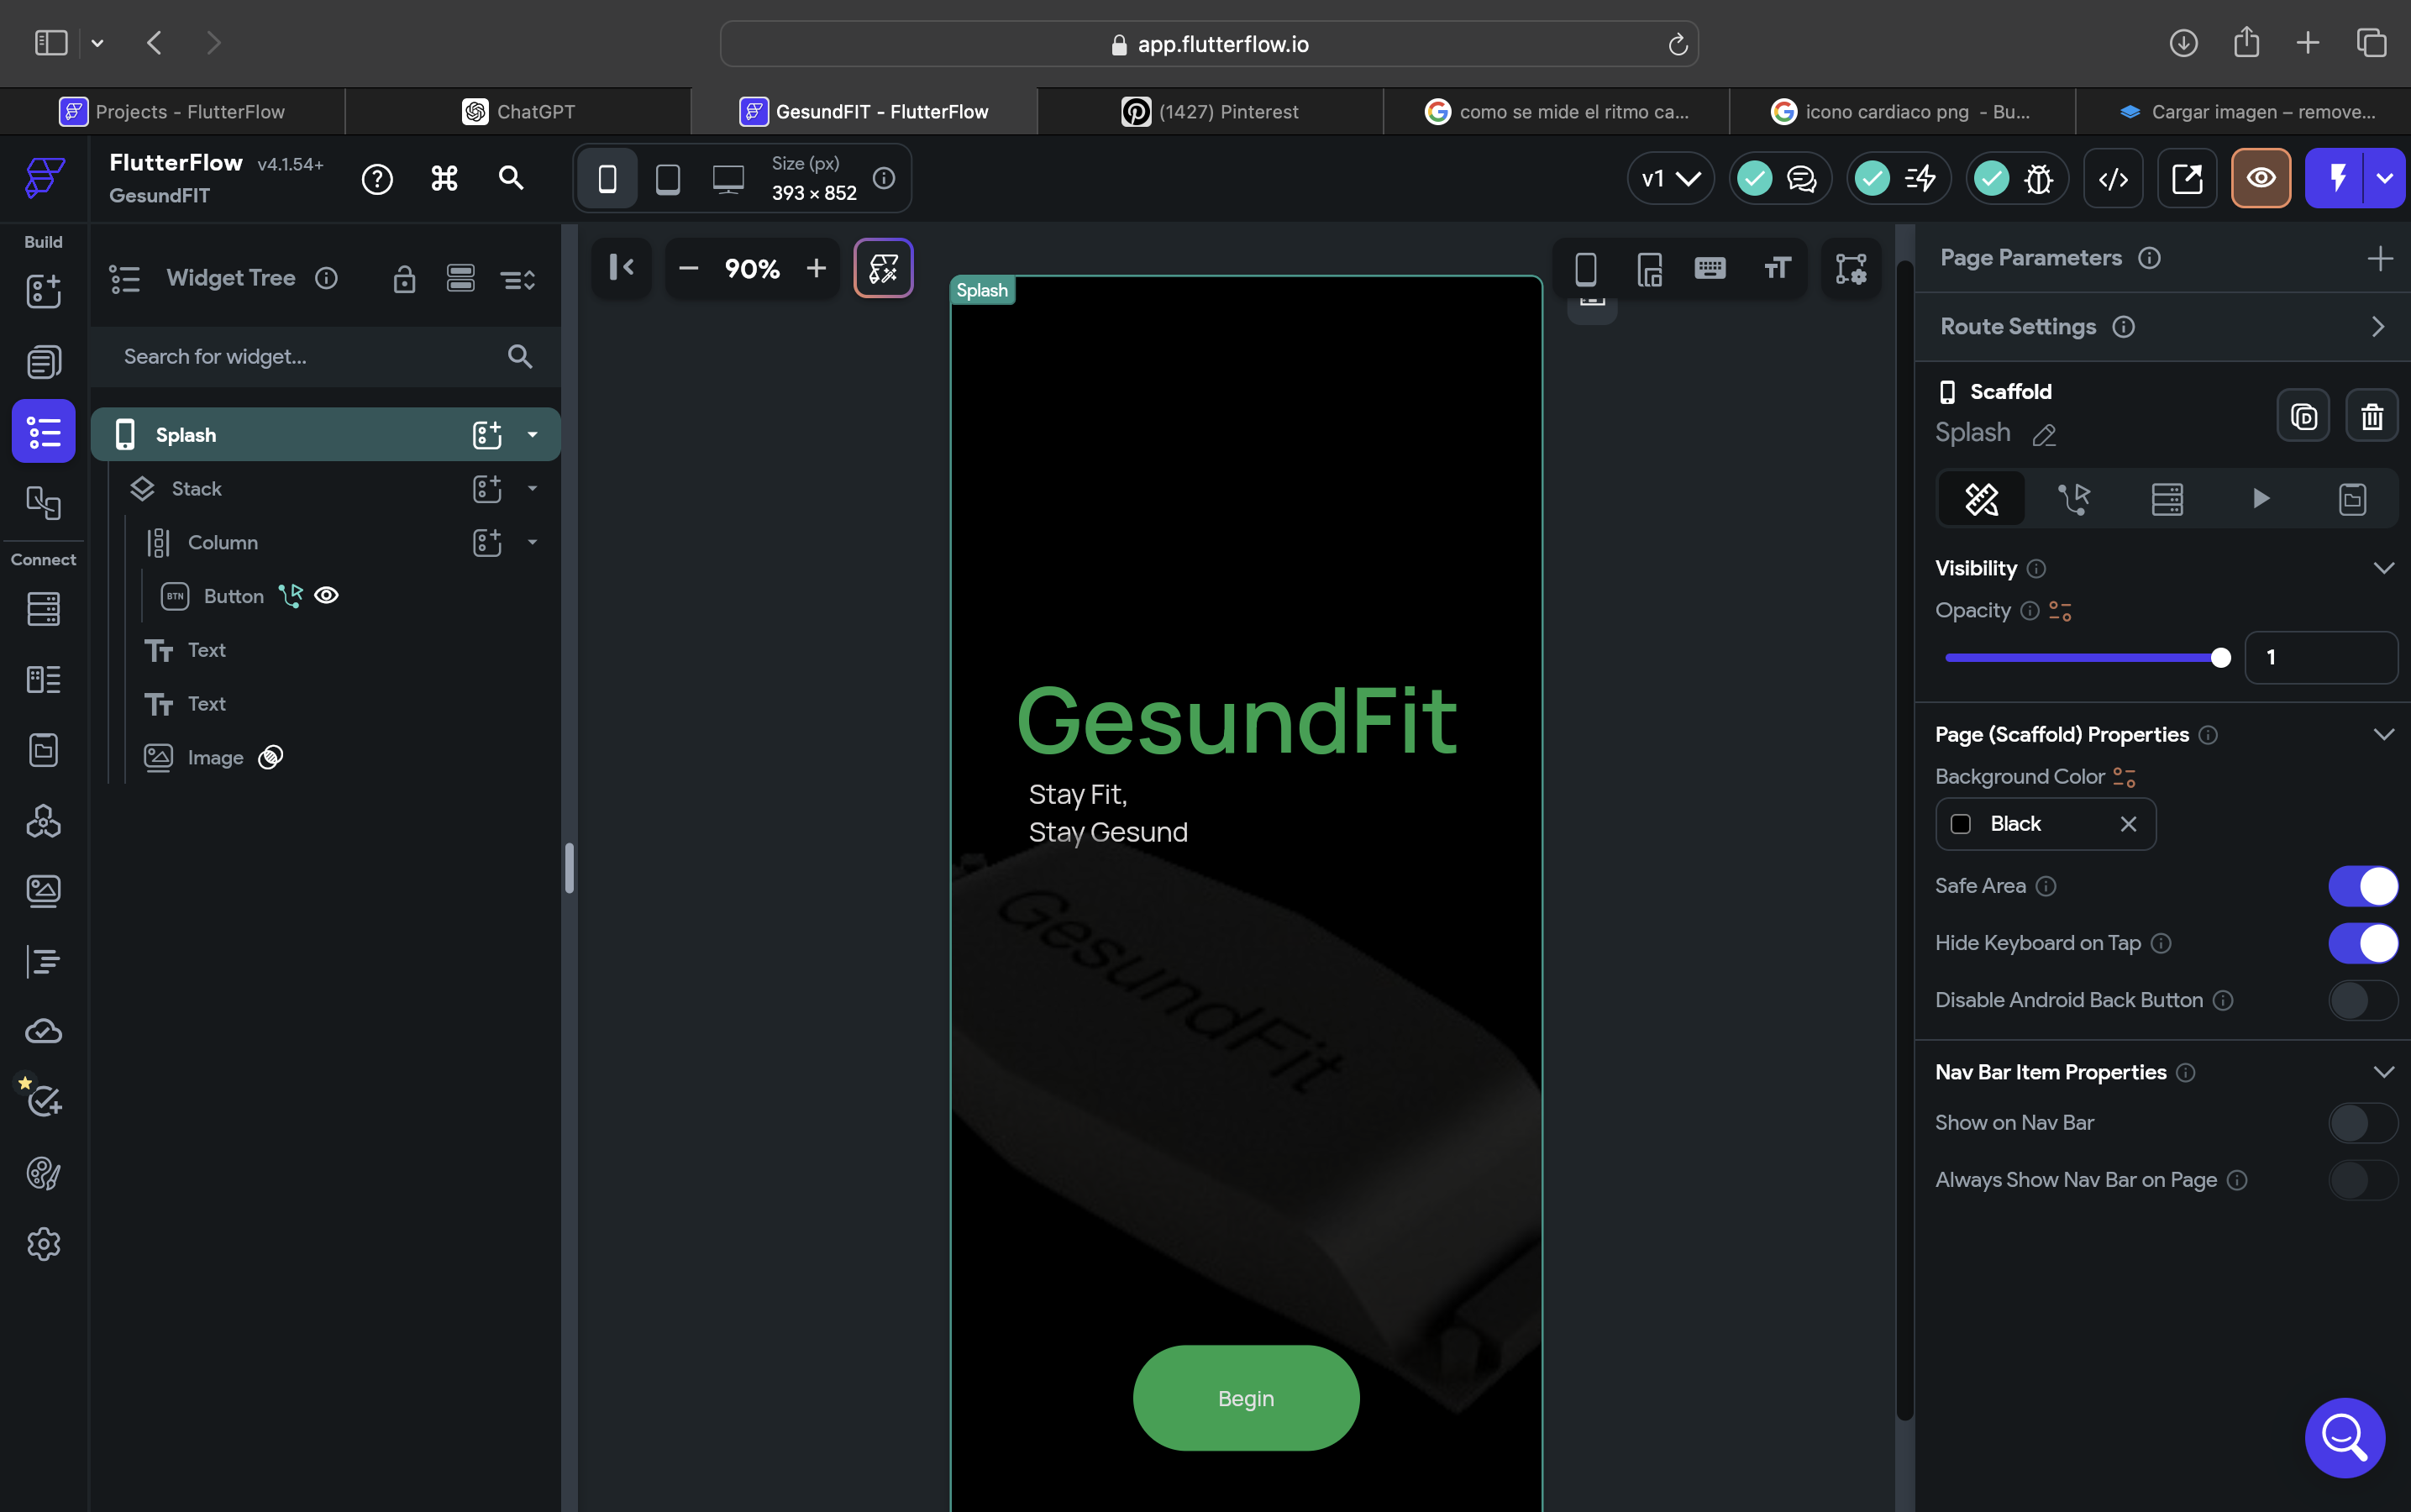
Step 4
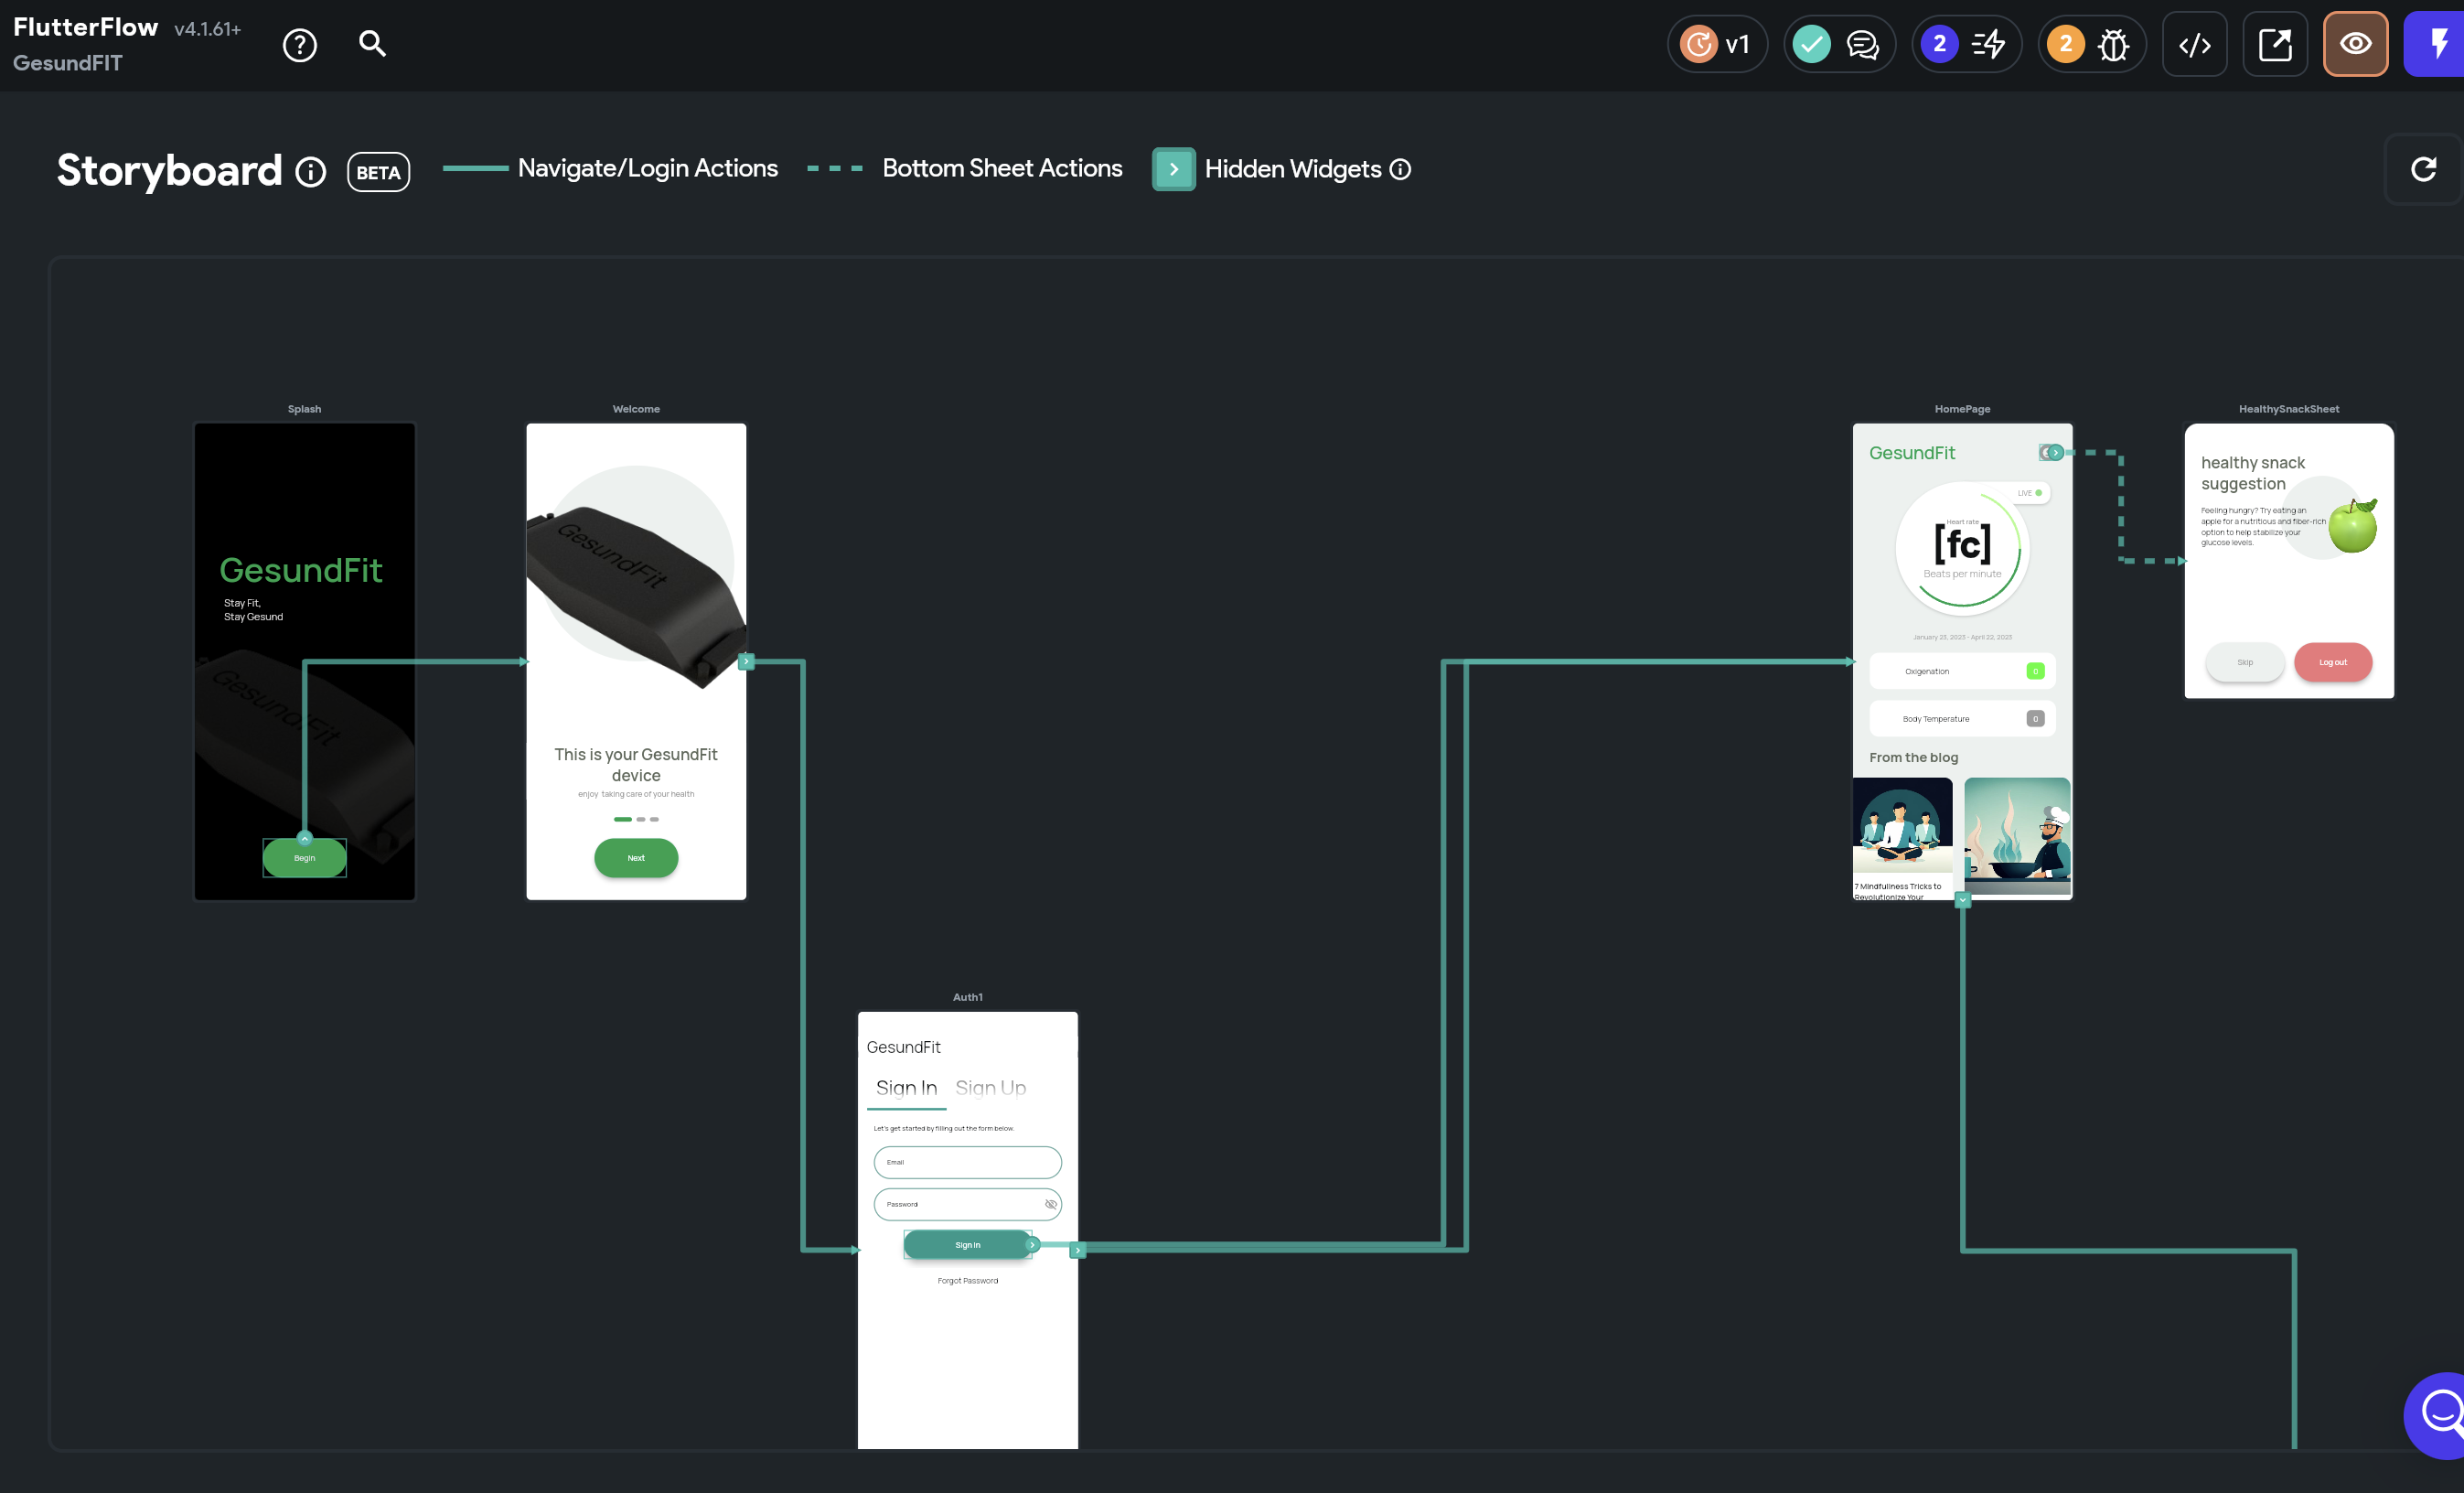
I added various screens so that the user could learn about the product, register, and have a specific section where they could monitor their vital signs.
Step 5
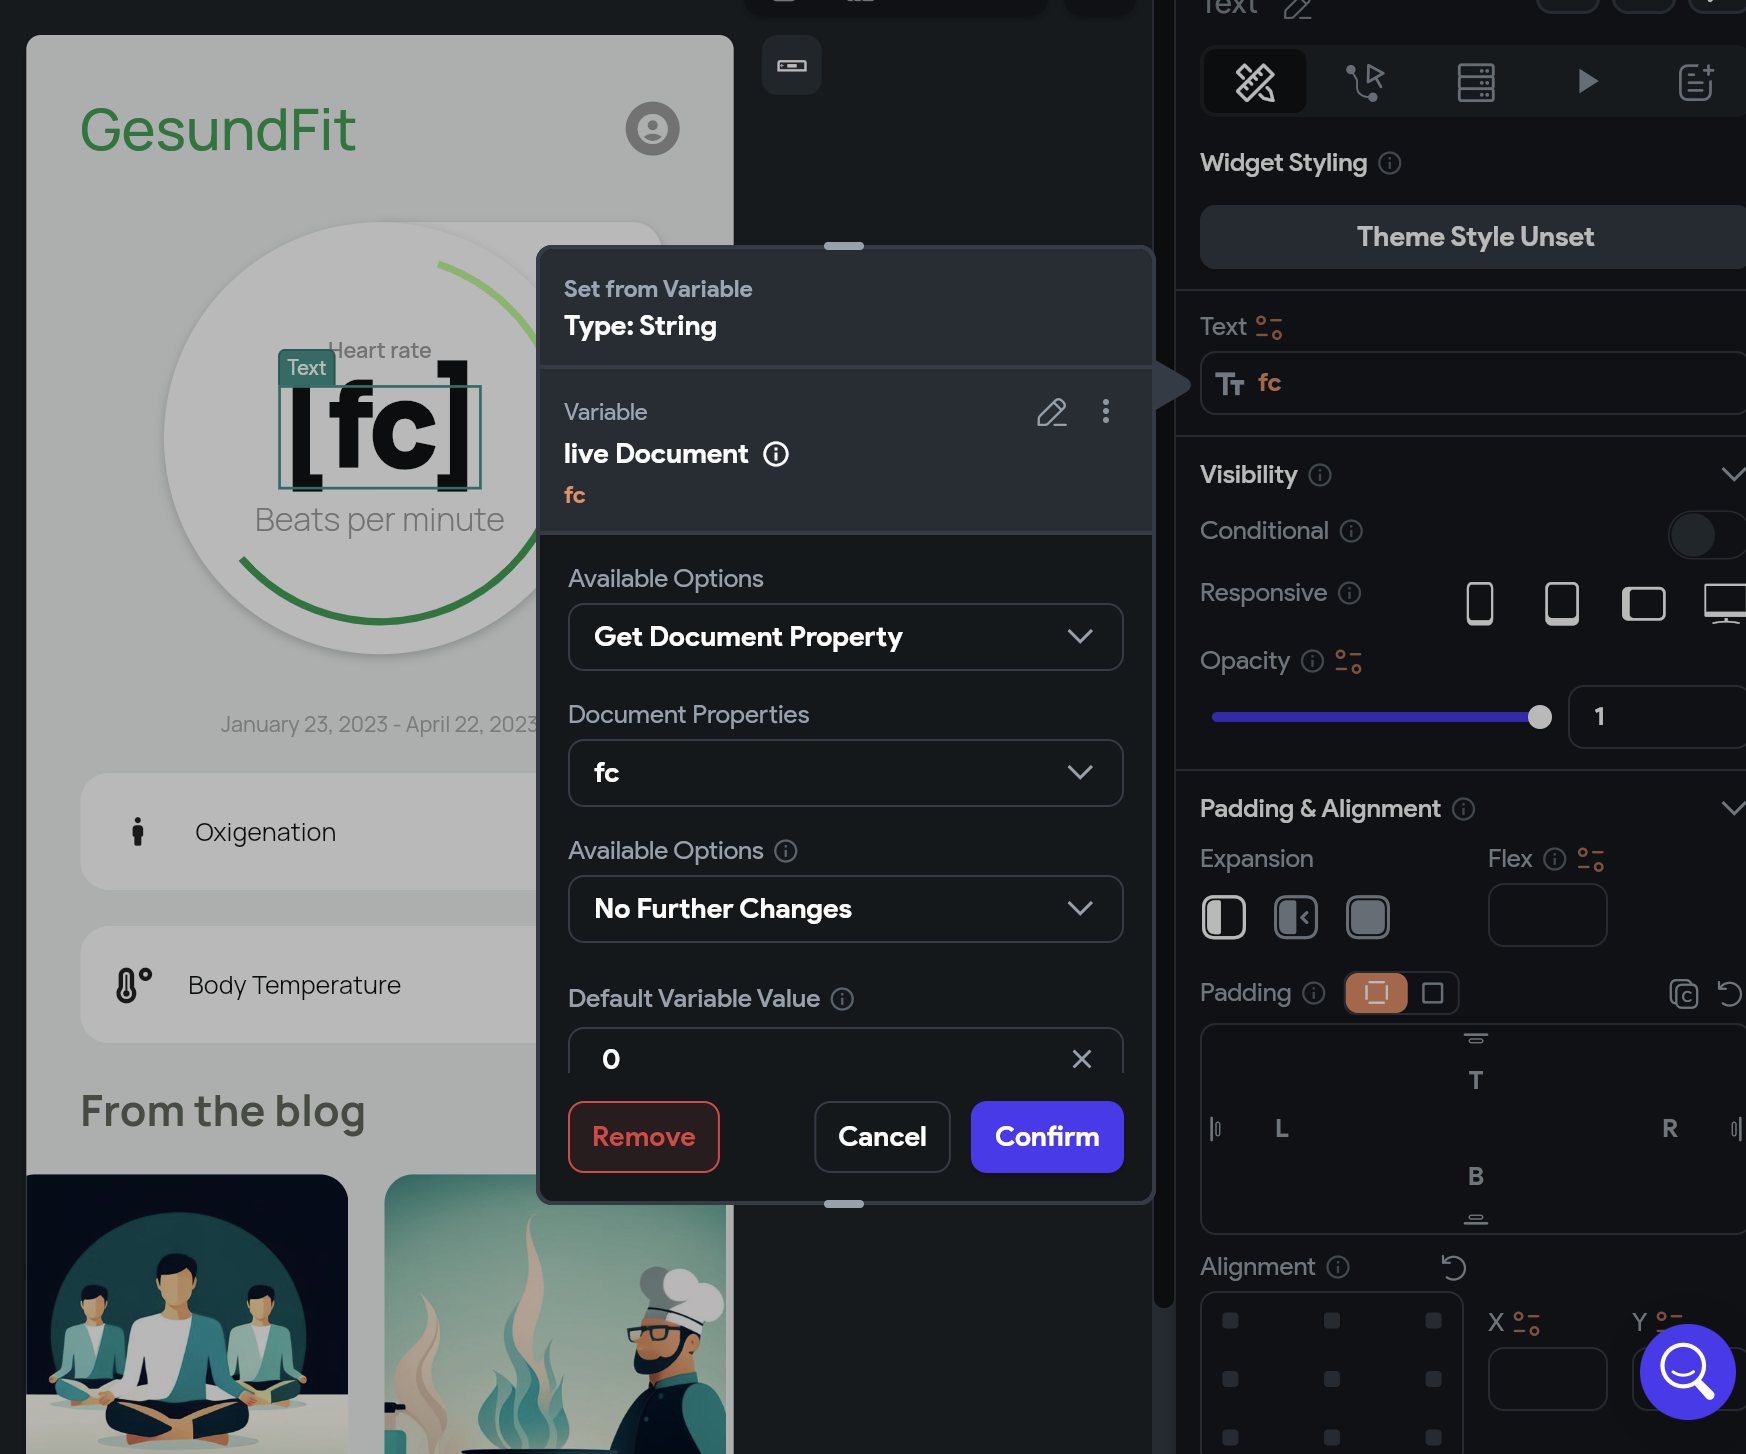
The screen where the vital signs are displayed is important because this is where the variables with the exact names we used in our Arduino code will be established.
Final Result off the GesundFit APP
With the variables in the database and the app design ready, we are prepared to proceed with the next step for the connection.
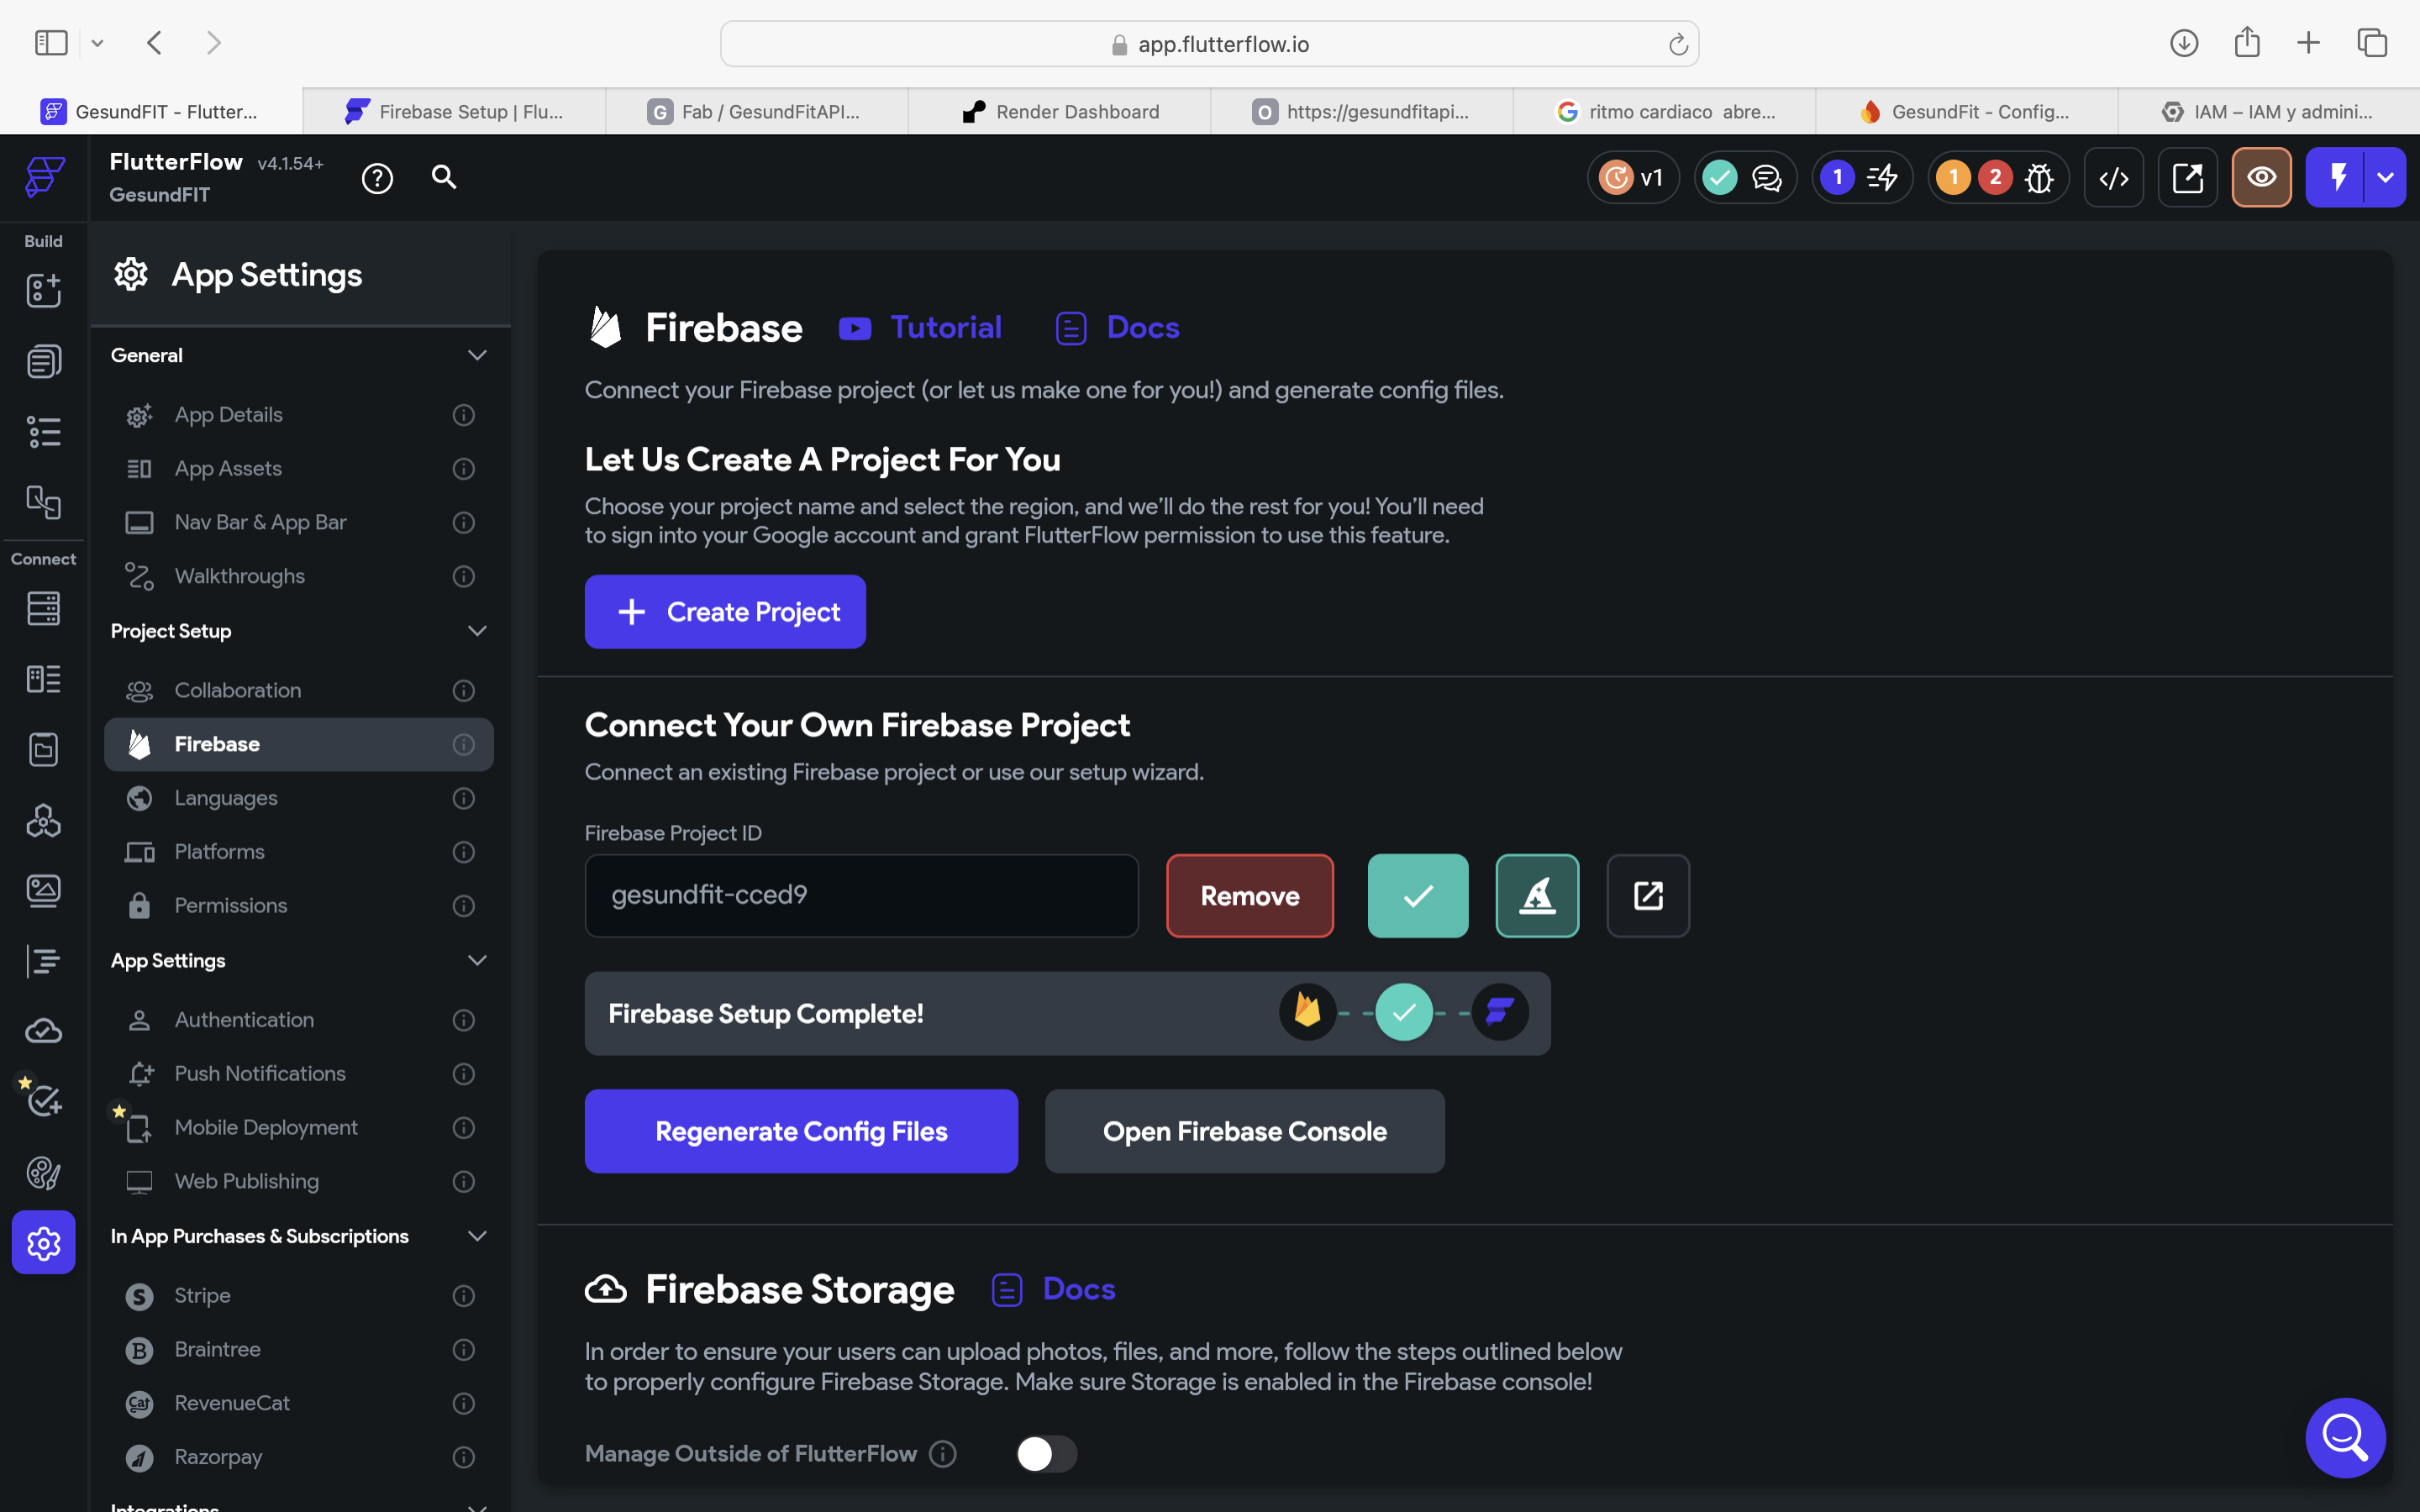
Connection between Flutter Flow and Firebase
Step 1
To connect our app with the Fiera database, it is very quick. First, we go to the configuration in Flutter Flow.
Step 2
We go to Firebase and navigate to where it says "Connect to an existing database."
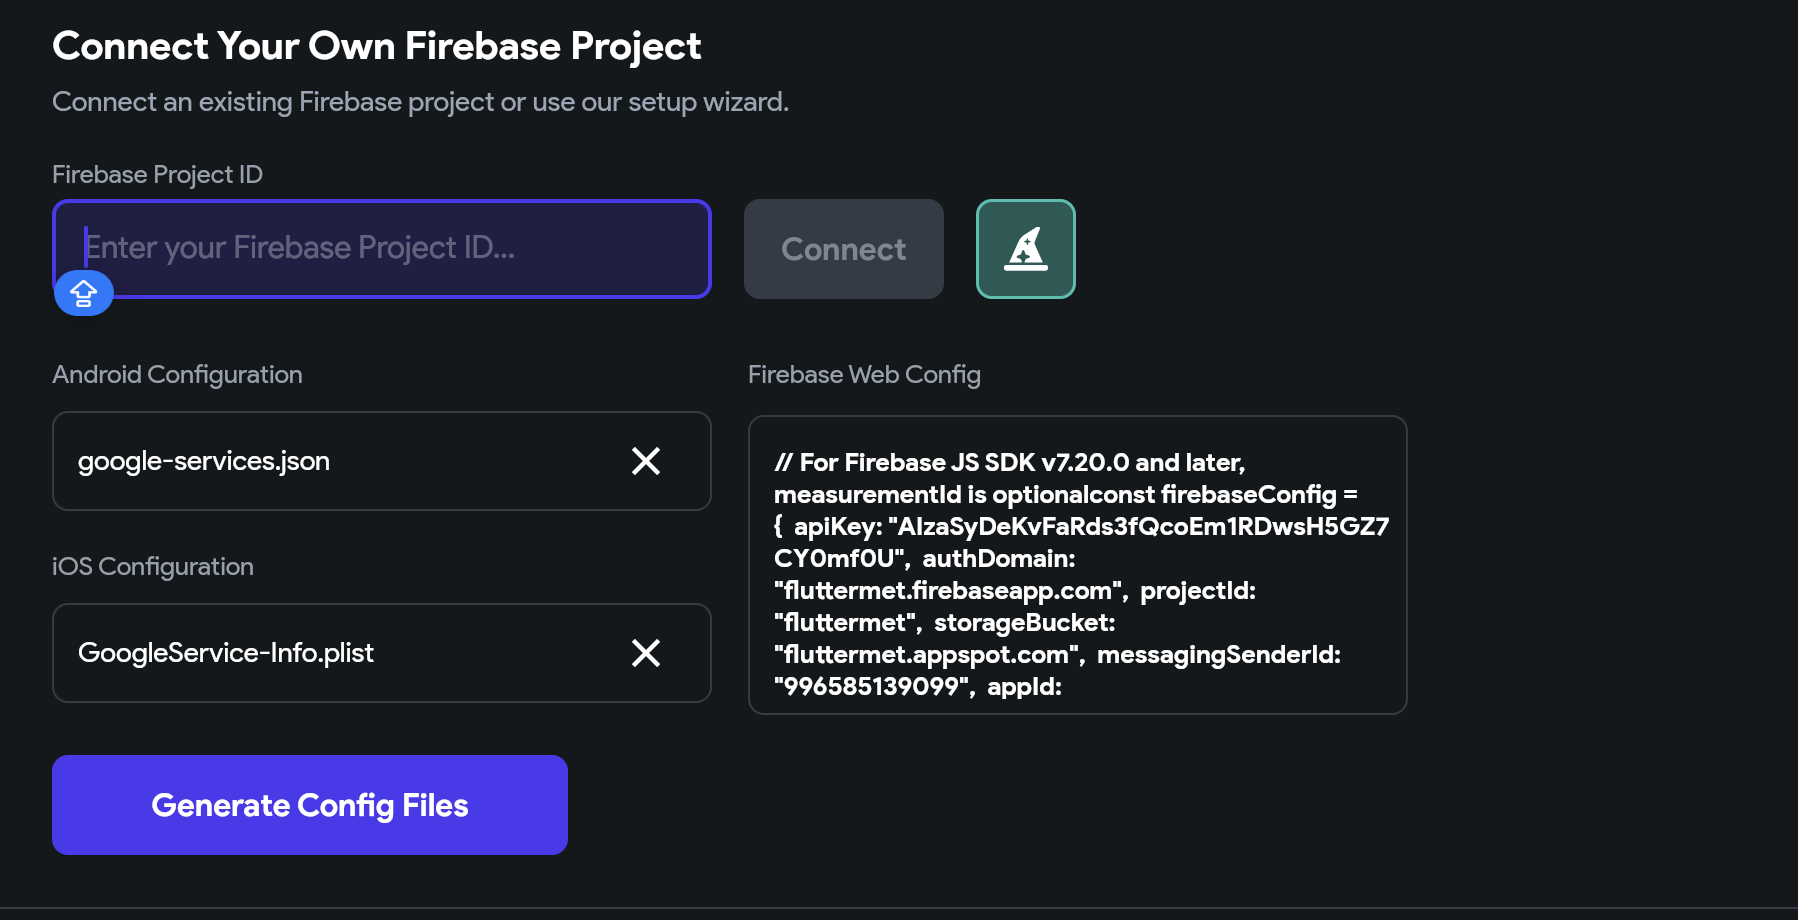
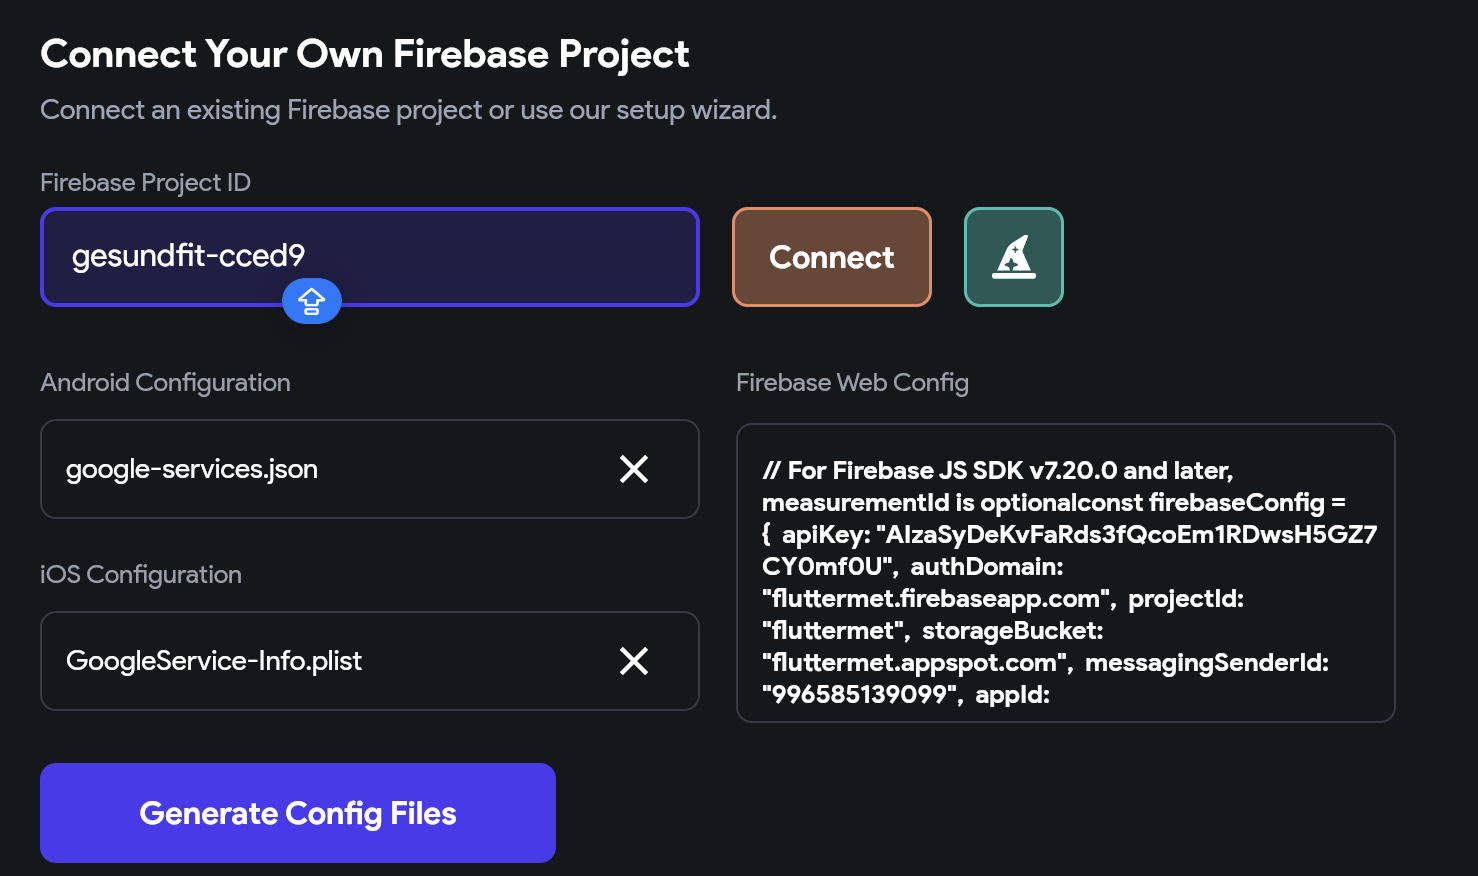
Step 3
Here we add the number of the ID that we fine in our Firebase settings project.
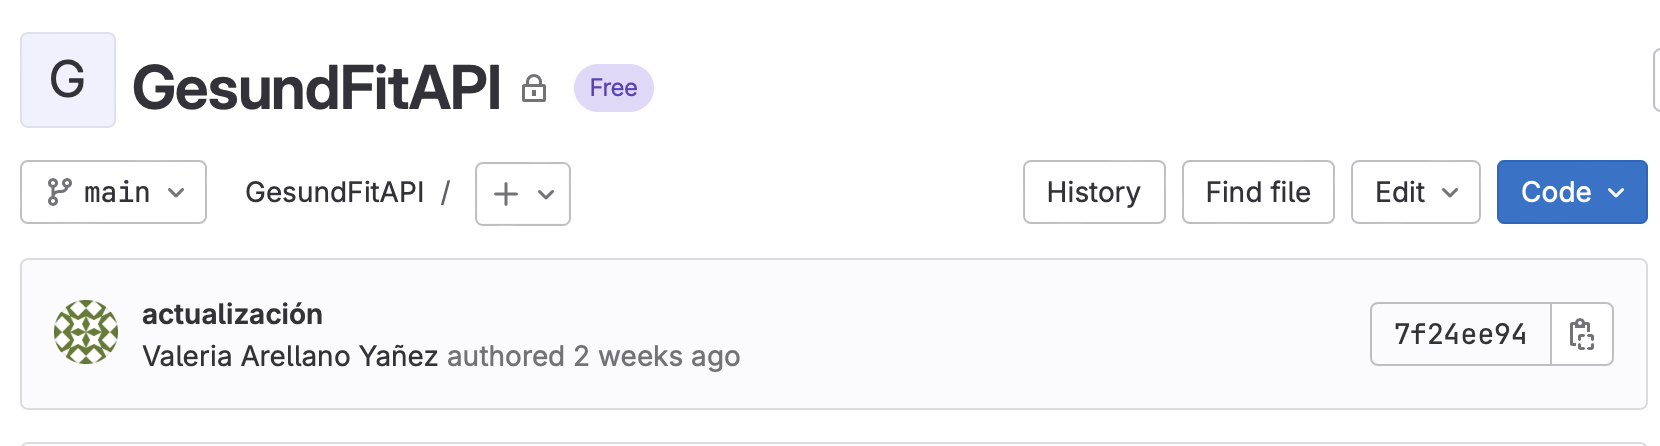
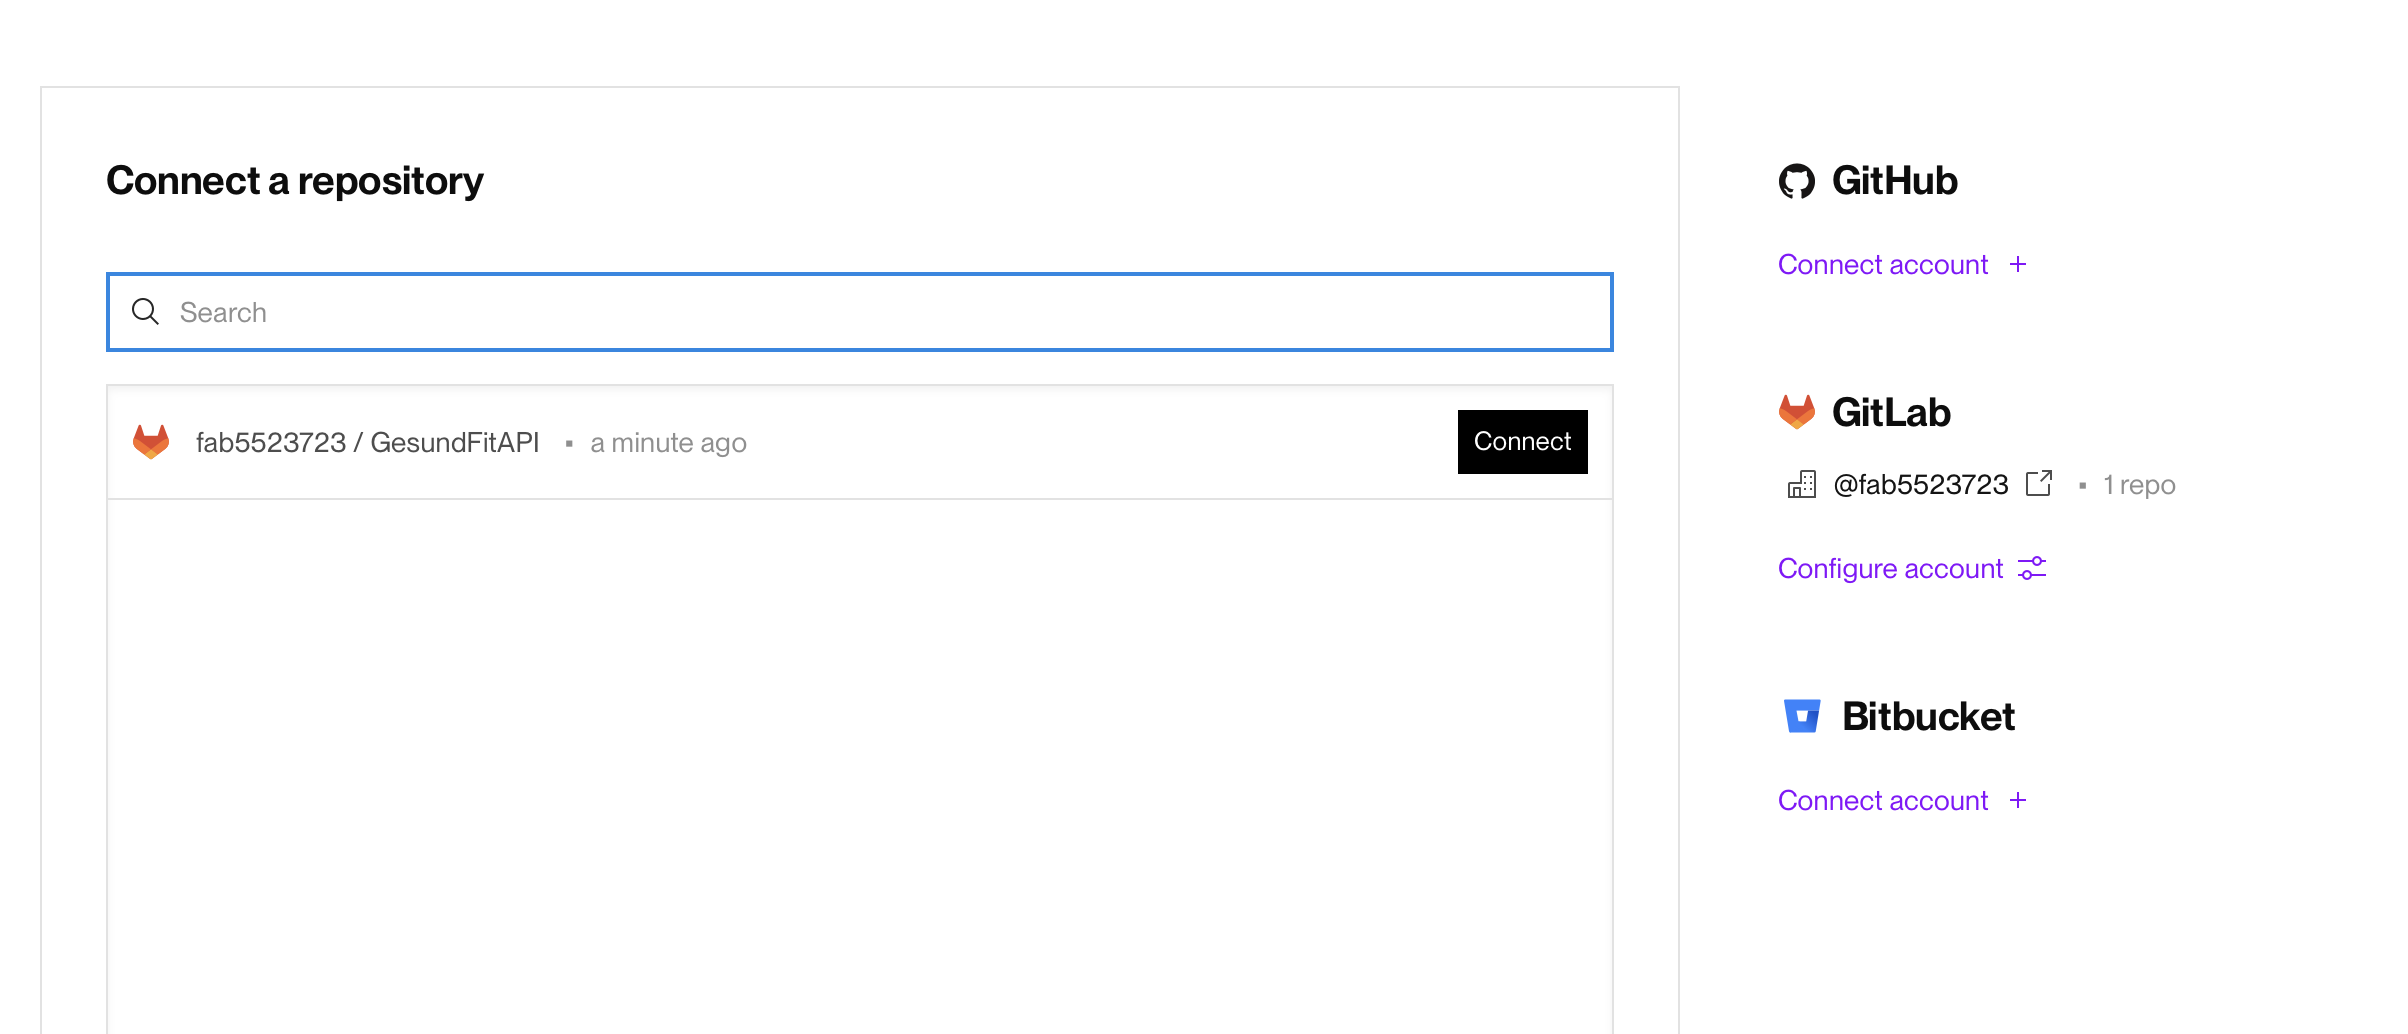
Git Lab repository
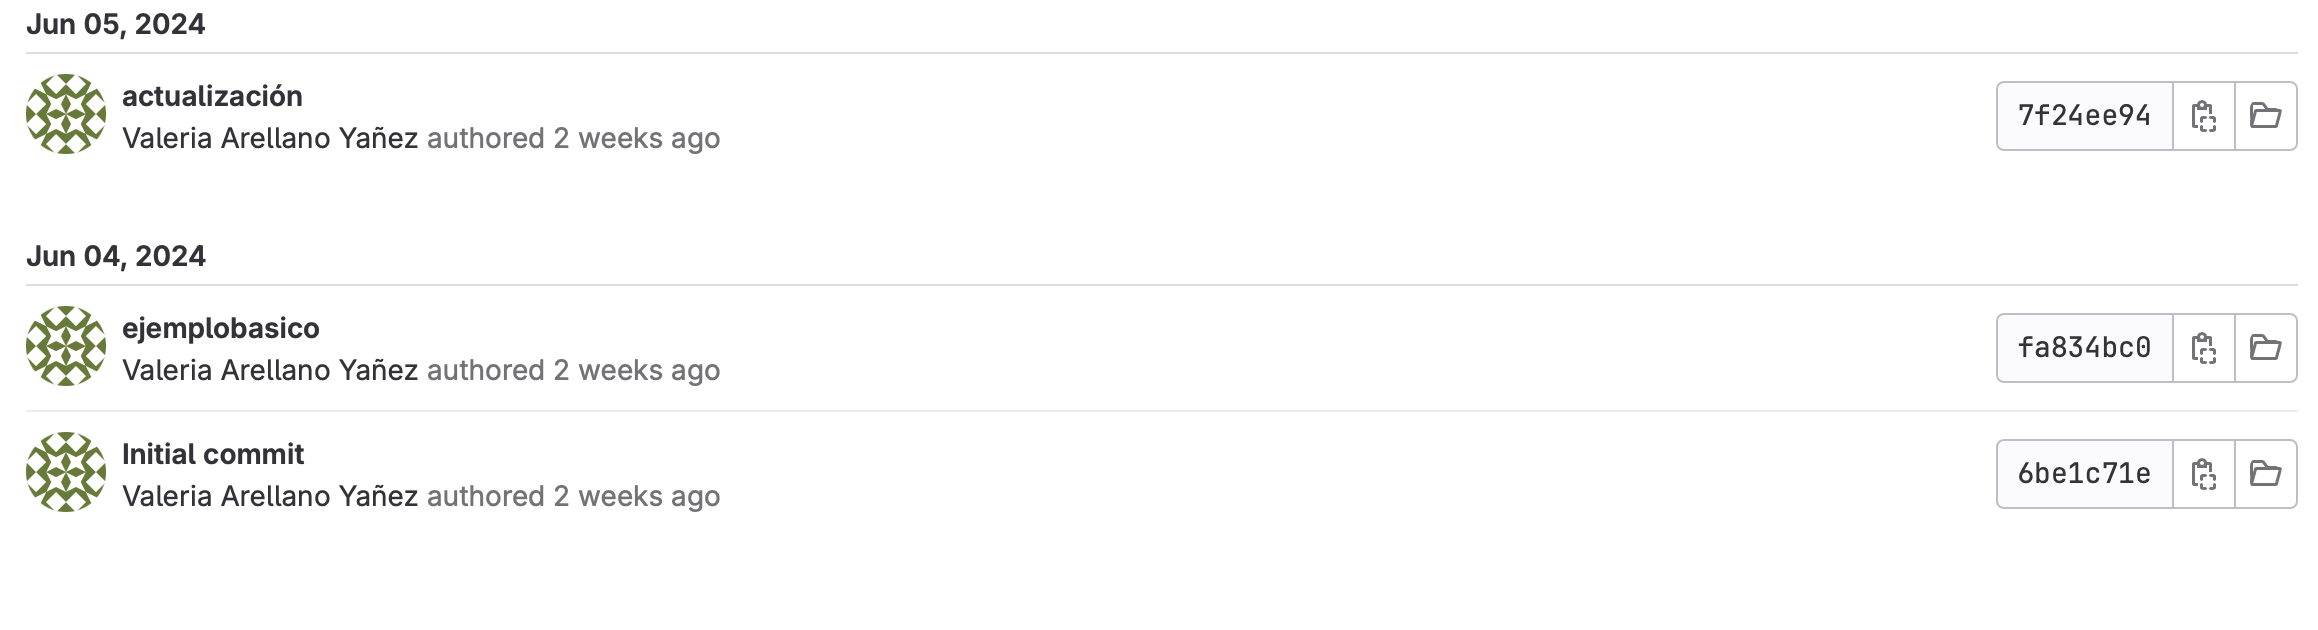
In GitLab, we created an account to establish the connection between the API and the repository.
Step 1
Create an account on GitLab.

Step 2
Once inside GitLab, create a project named "GesundFit".
Step 3
Clone the repository by copying the SSH link.
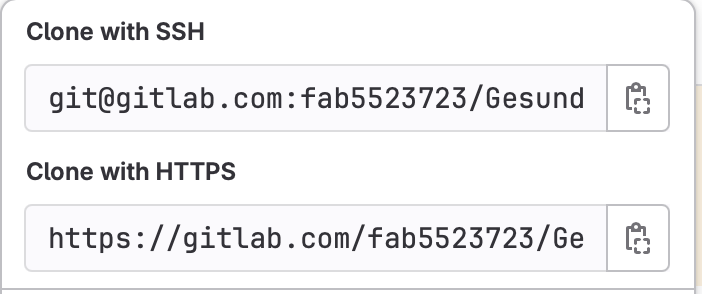
Step 4
Go to the terminal on your computer and use the command “git clone” along with the previously copied link to clone the repository to your computer.
Once ready up to this point, it is time to move on to the next step.
Visual Studio Code
Now we will use Visual Studio to establish the foundation of the API, which we will later connect with Render and the application's database.
Step 1
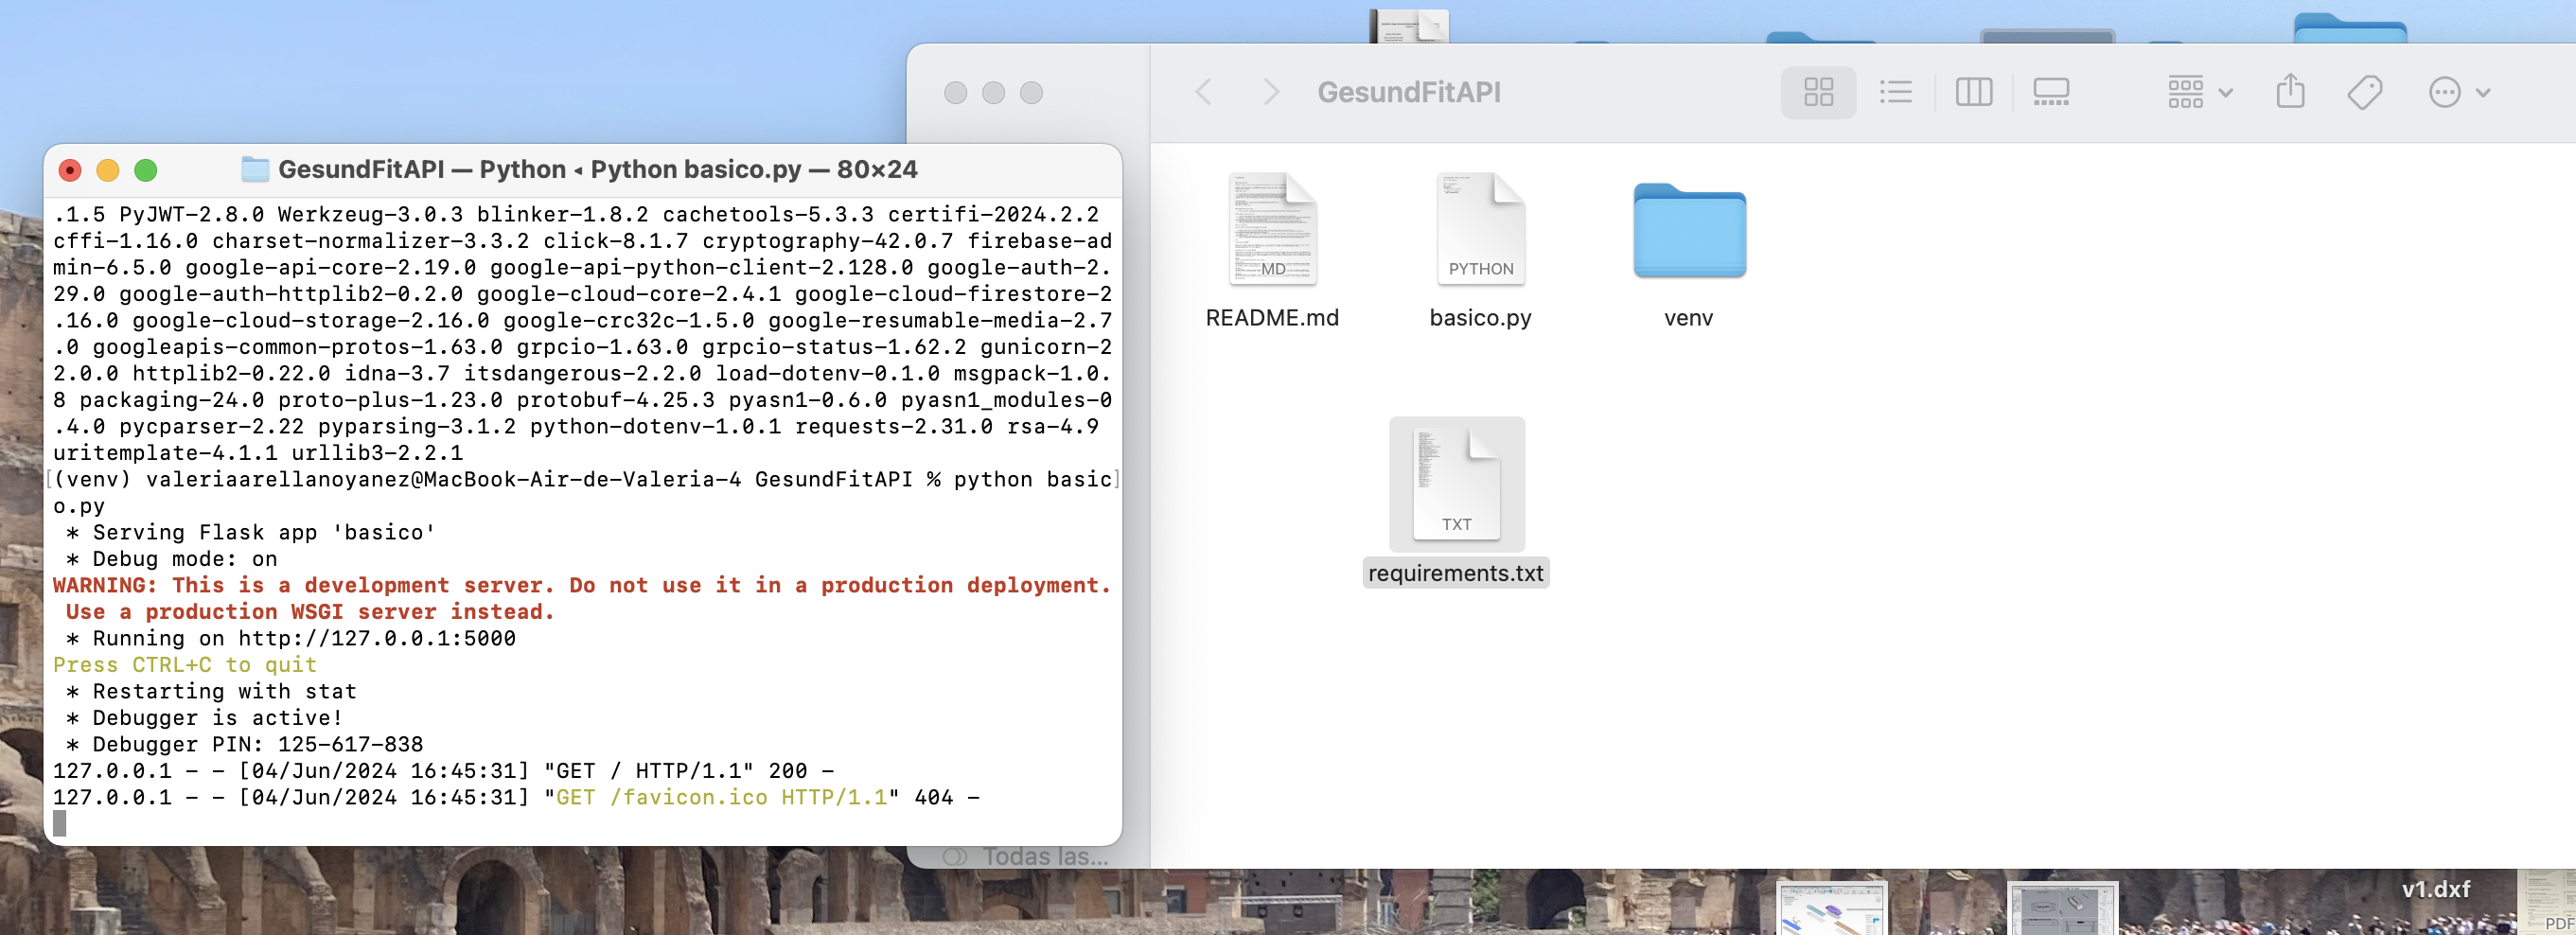
Since we were previously in our terminal within the folder that was already cloned, using the command "code ." will automatically open Visual Studio Code with everything that was cloned.
Step 2
To verify that our communication with GitLab is working, we will create a basic file and upload it to the repository to check if we can access it online.
The name of this file will be "basic.py" because as we know ".py" means to play it.
We need to make our normal git commit and push in order to save all of this in out gitLab acoount.
After this, we are going to open our terminal again and to write " Python ...." anthe name of this file to play it.
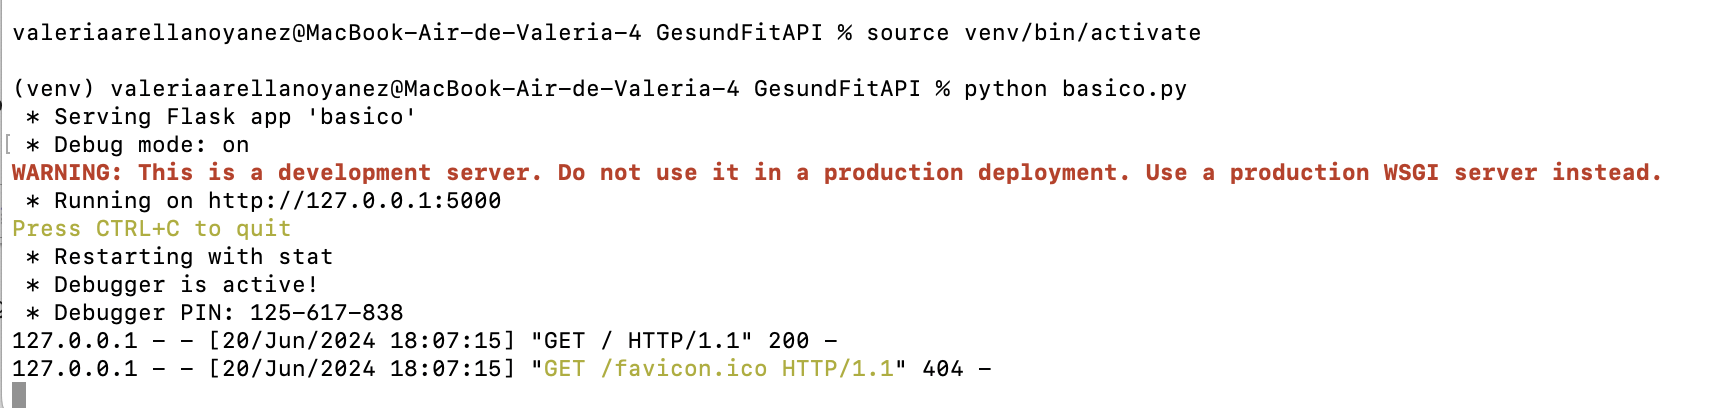
As we can see there is a link so we need to open it.
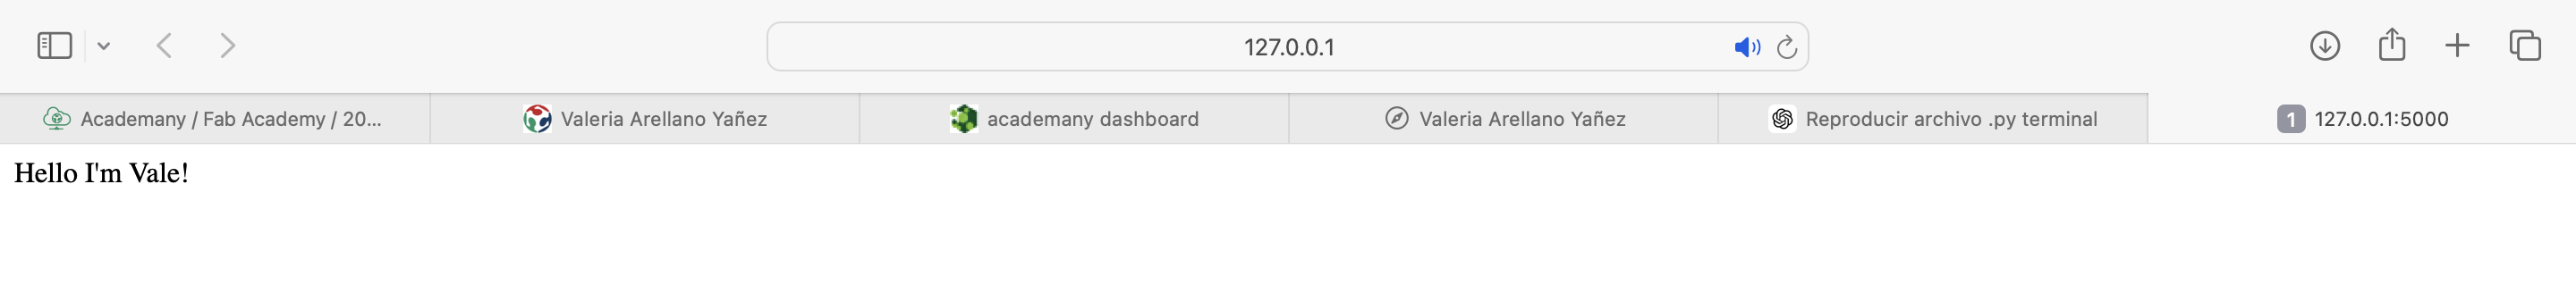
And it work´s.
Step 3
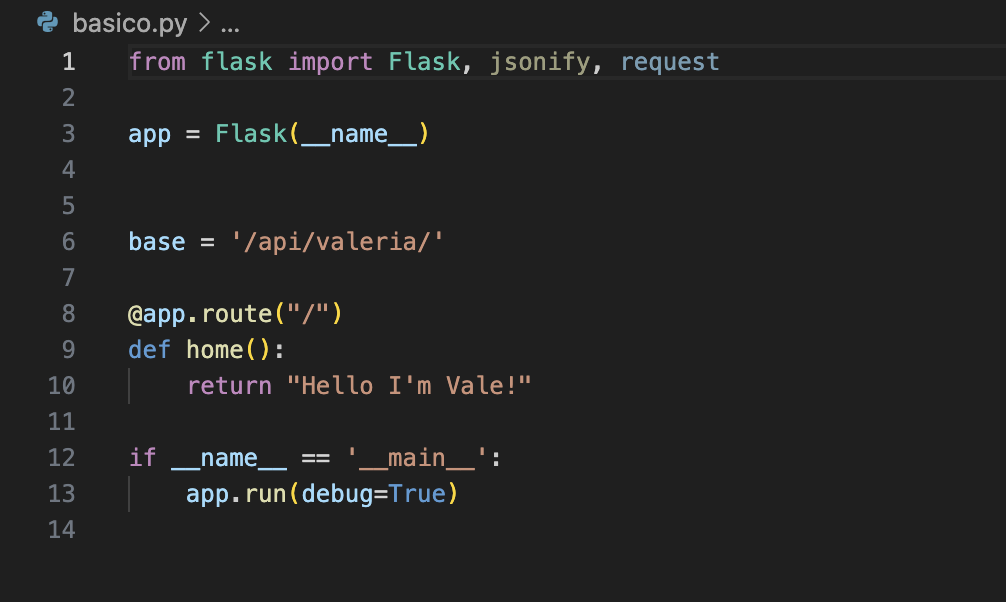
Within Visual Studio Code, we will create a new file that will be our project API.
We add the following code where it establishes the direct connection with Firebase
							from flask import Flask, jsonify, request
							import firebase_admin
							from firebase_admin import credentials, firestore
							from datetime import datetime
							from dotenv import load_dotenv
							import os

							load_dotenv()

							cred = credentials.Certificate(
								{
									"type": os.getenv("TYPE"),
									"project_id": os.getenv("PROJECT_ID"),
									"private_key_id": os.getenv("PRIVATE_KEY_ID"),
									"private_key": os.getenv("PRIVATE_KEY"),
									"client_email": os.getenv("CLIENT_EMAIL"),
									"client_id": os.getenv("CLIENT_ID"),
									"auth_uri": os.getenv("AUTH_URI"),
									"token_uri": os.getenv("TOKEN_URI"),
									"auth_provider_x509_cert_url": os.getenv("AUTH_PROVIDER_X509_CERT_URL"),
									"client_x509_cert_url": os.getenv("CLIENT_X509_CERT_URL"),
									"universe_domain": os.getenv("UNIVERSE_DOMAIN"),
									}
							)

							firebase_admin.initialize_app(cred)
							db = firestore.client()
							live_ref = db.collection('live').document('3mLXo2jXDBajROCaYMLN')

							app = Flask(__name__)


							base = '/api/valeria/'


							@app.route("/")
							def home():
								return "Hello I'm Vale!"


							@app.route(base, methods=['POST'])
							def set_data():
								data = request.json

								temp = float(data.get('temp'))
								spo2 = float(data.get('spo2'))
								fc = float(data.get('fc'))

								if temp is None or spo2 is None or fc is None:
									return jsonify({"error": "Missing data"}), 400

								send_to_firebase(temp, spo2, fc)

								return jsonify({"success": True}), 200


							def send_to_firebase(temp, spo2, fc):
								print(f"Temperatura: {temp}")
								print(f"Oxigenacion: {spo2}")
								print(f"Frecuencia cardiaca: {fc}")

								data = {
									"temp": temp,
									"spo2": spo2,
									"fc": fc
								}
								live_ref.set(data)  # Update data


							if __name__ == '__main__':
								app.run(debug=True)
Here we haved established the variables of our project, the same variables that we have used in everything.
Step 4
After this we create a new git commit and we push it again.
API by Render
To observe the database in action, we need API integration with Render.
Step 1
First, create an account on Render directly using GitLab.
Step 2
I created a web service by selecting the option "Build and deploy from a Git repository."
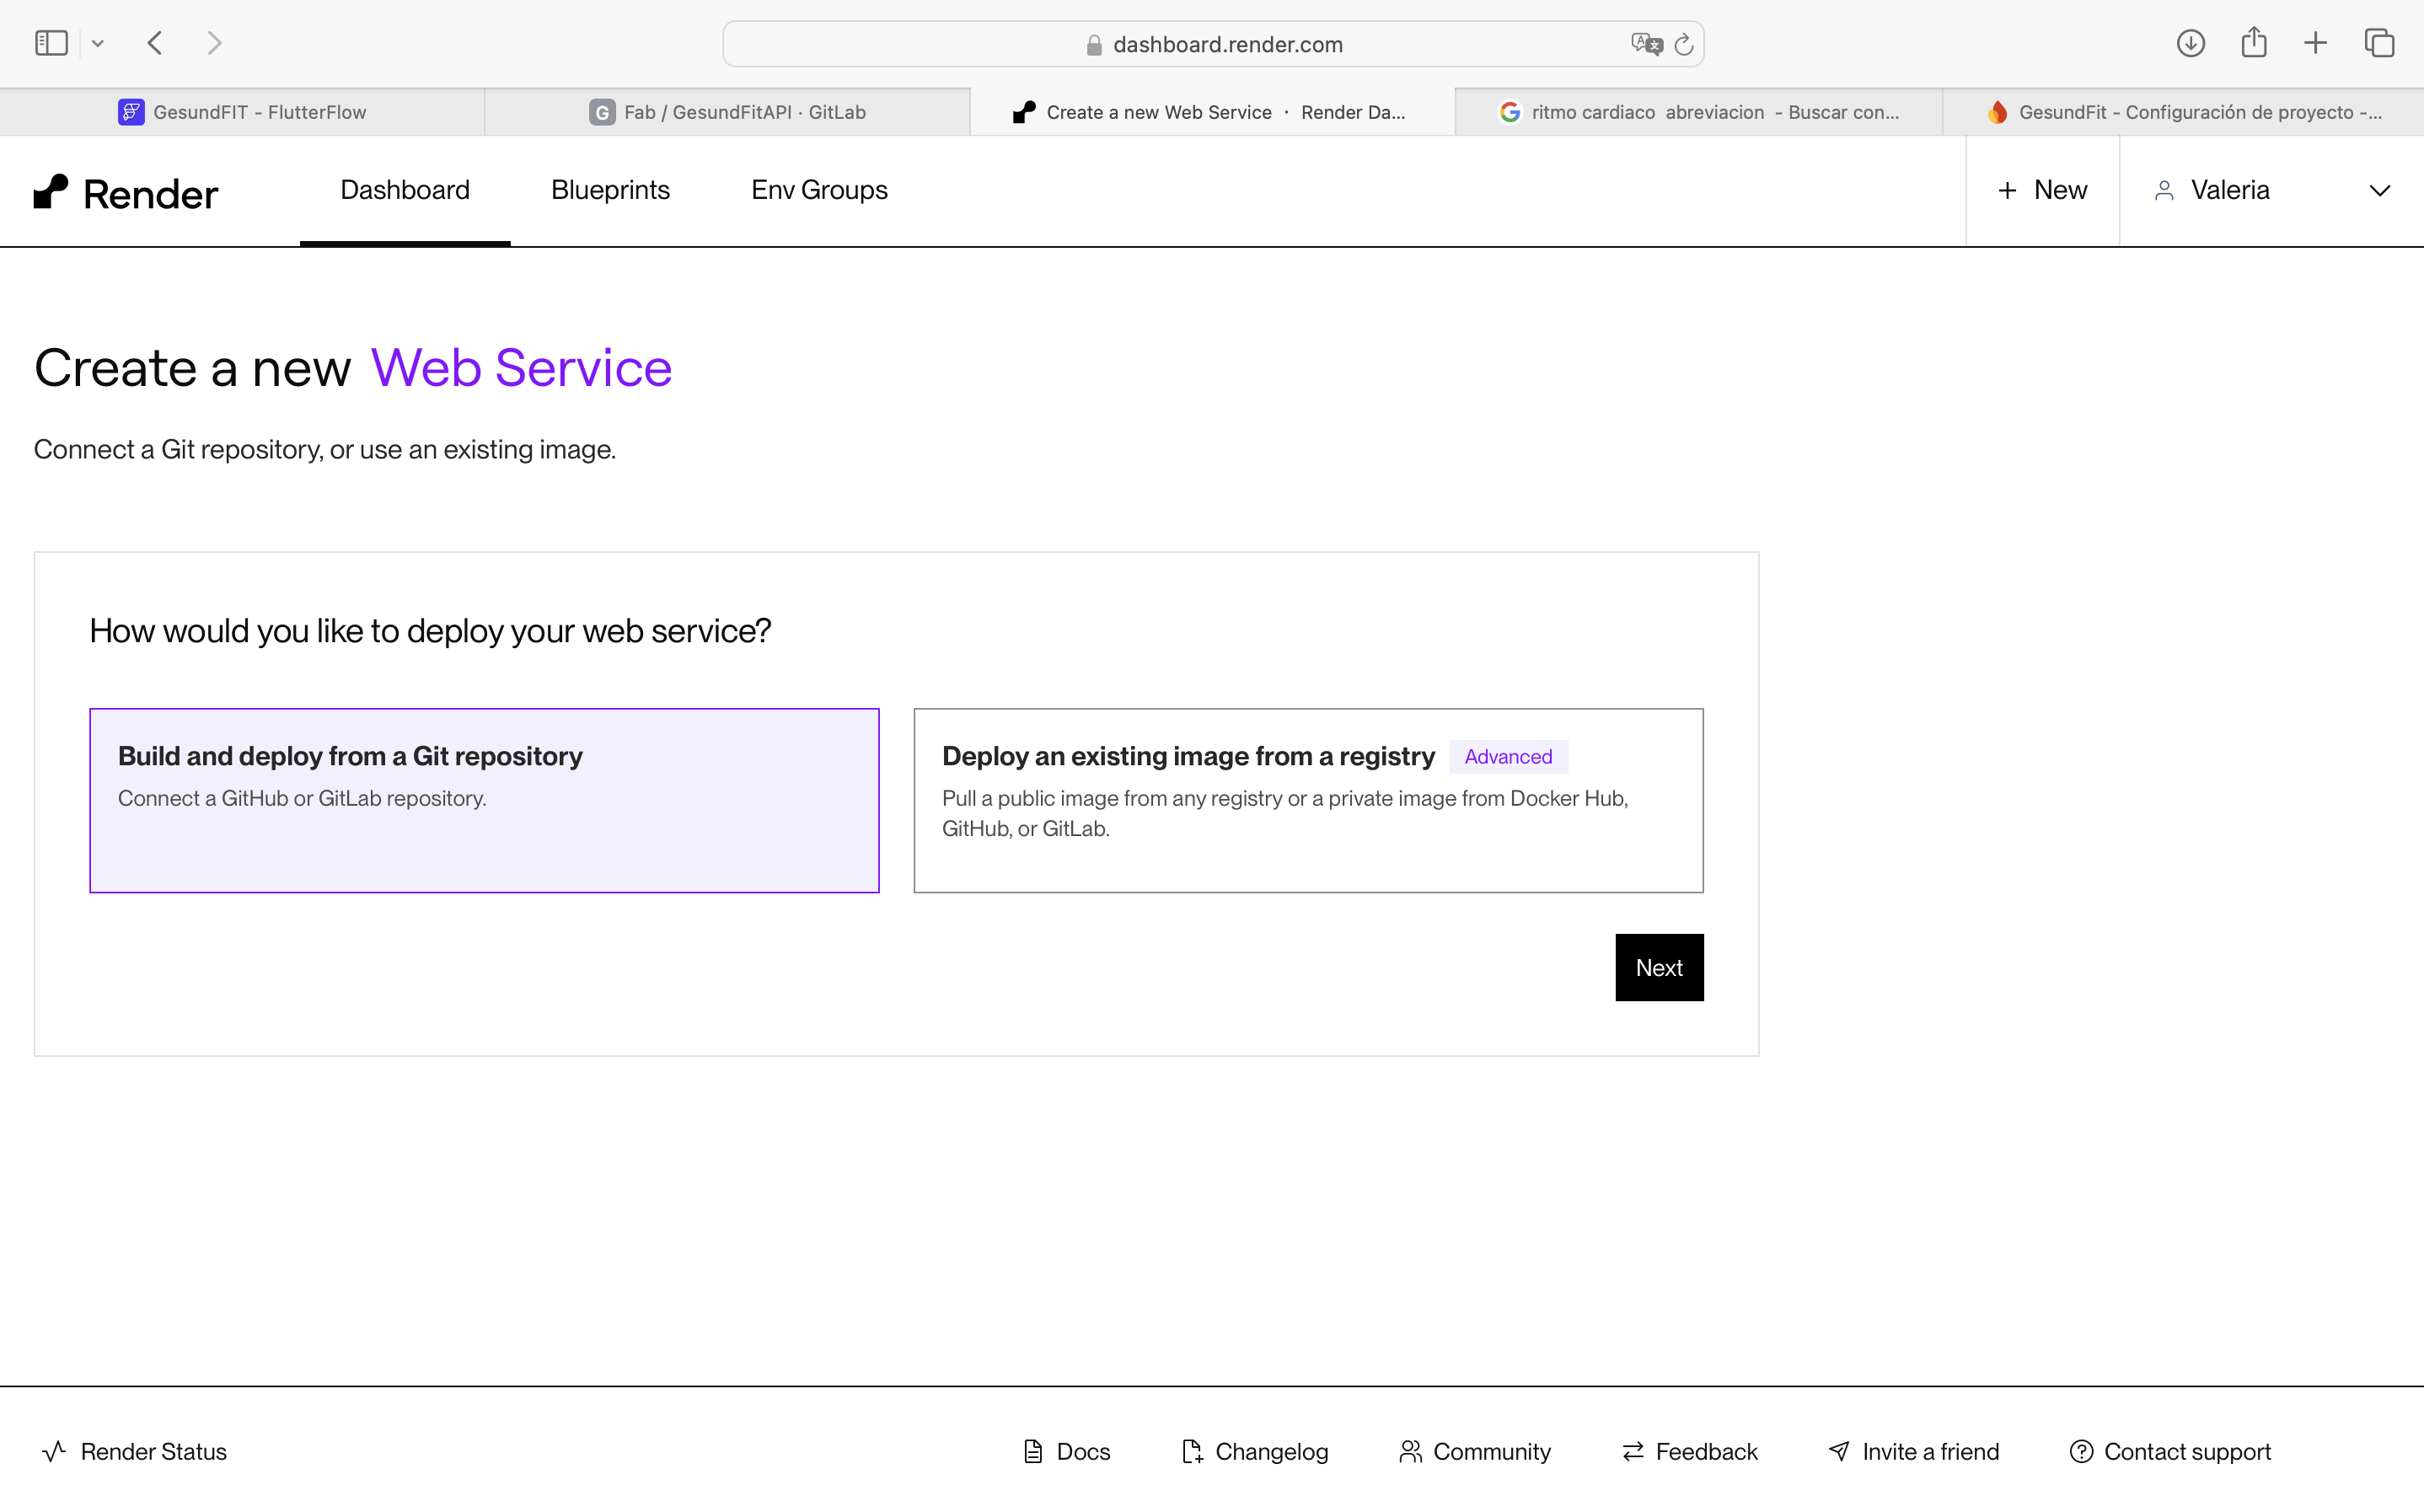
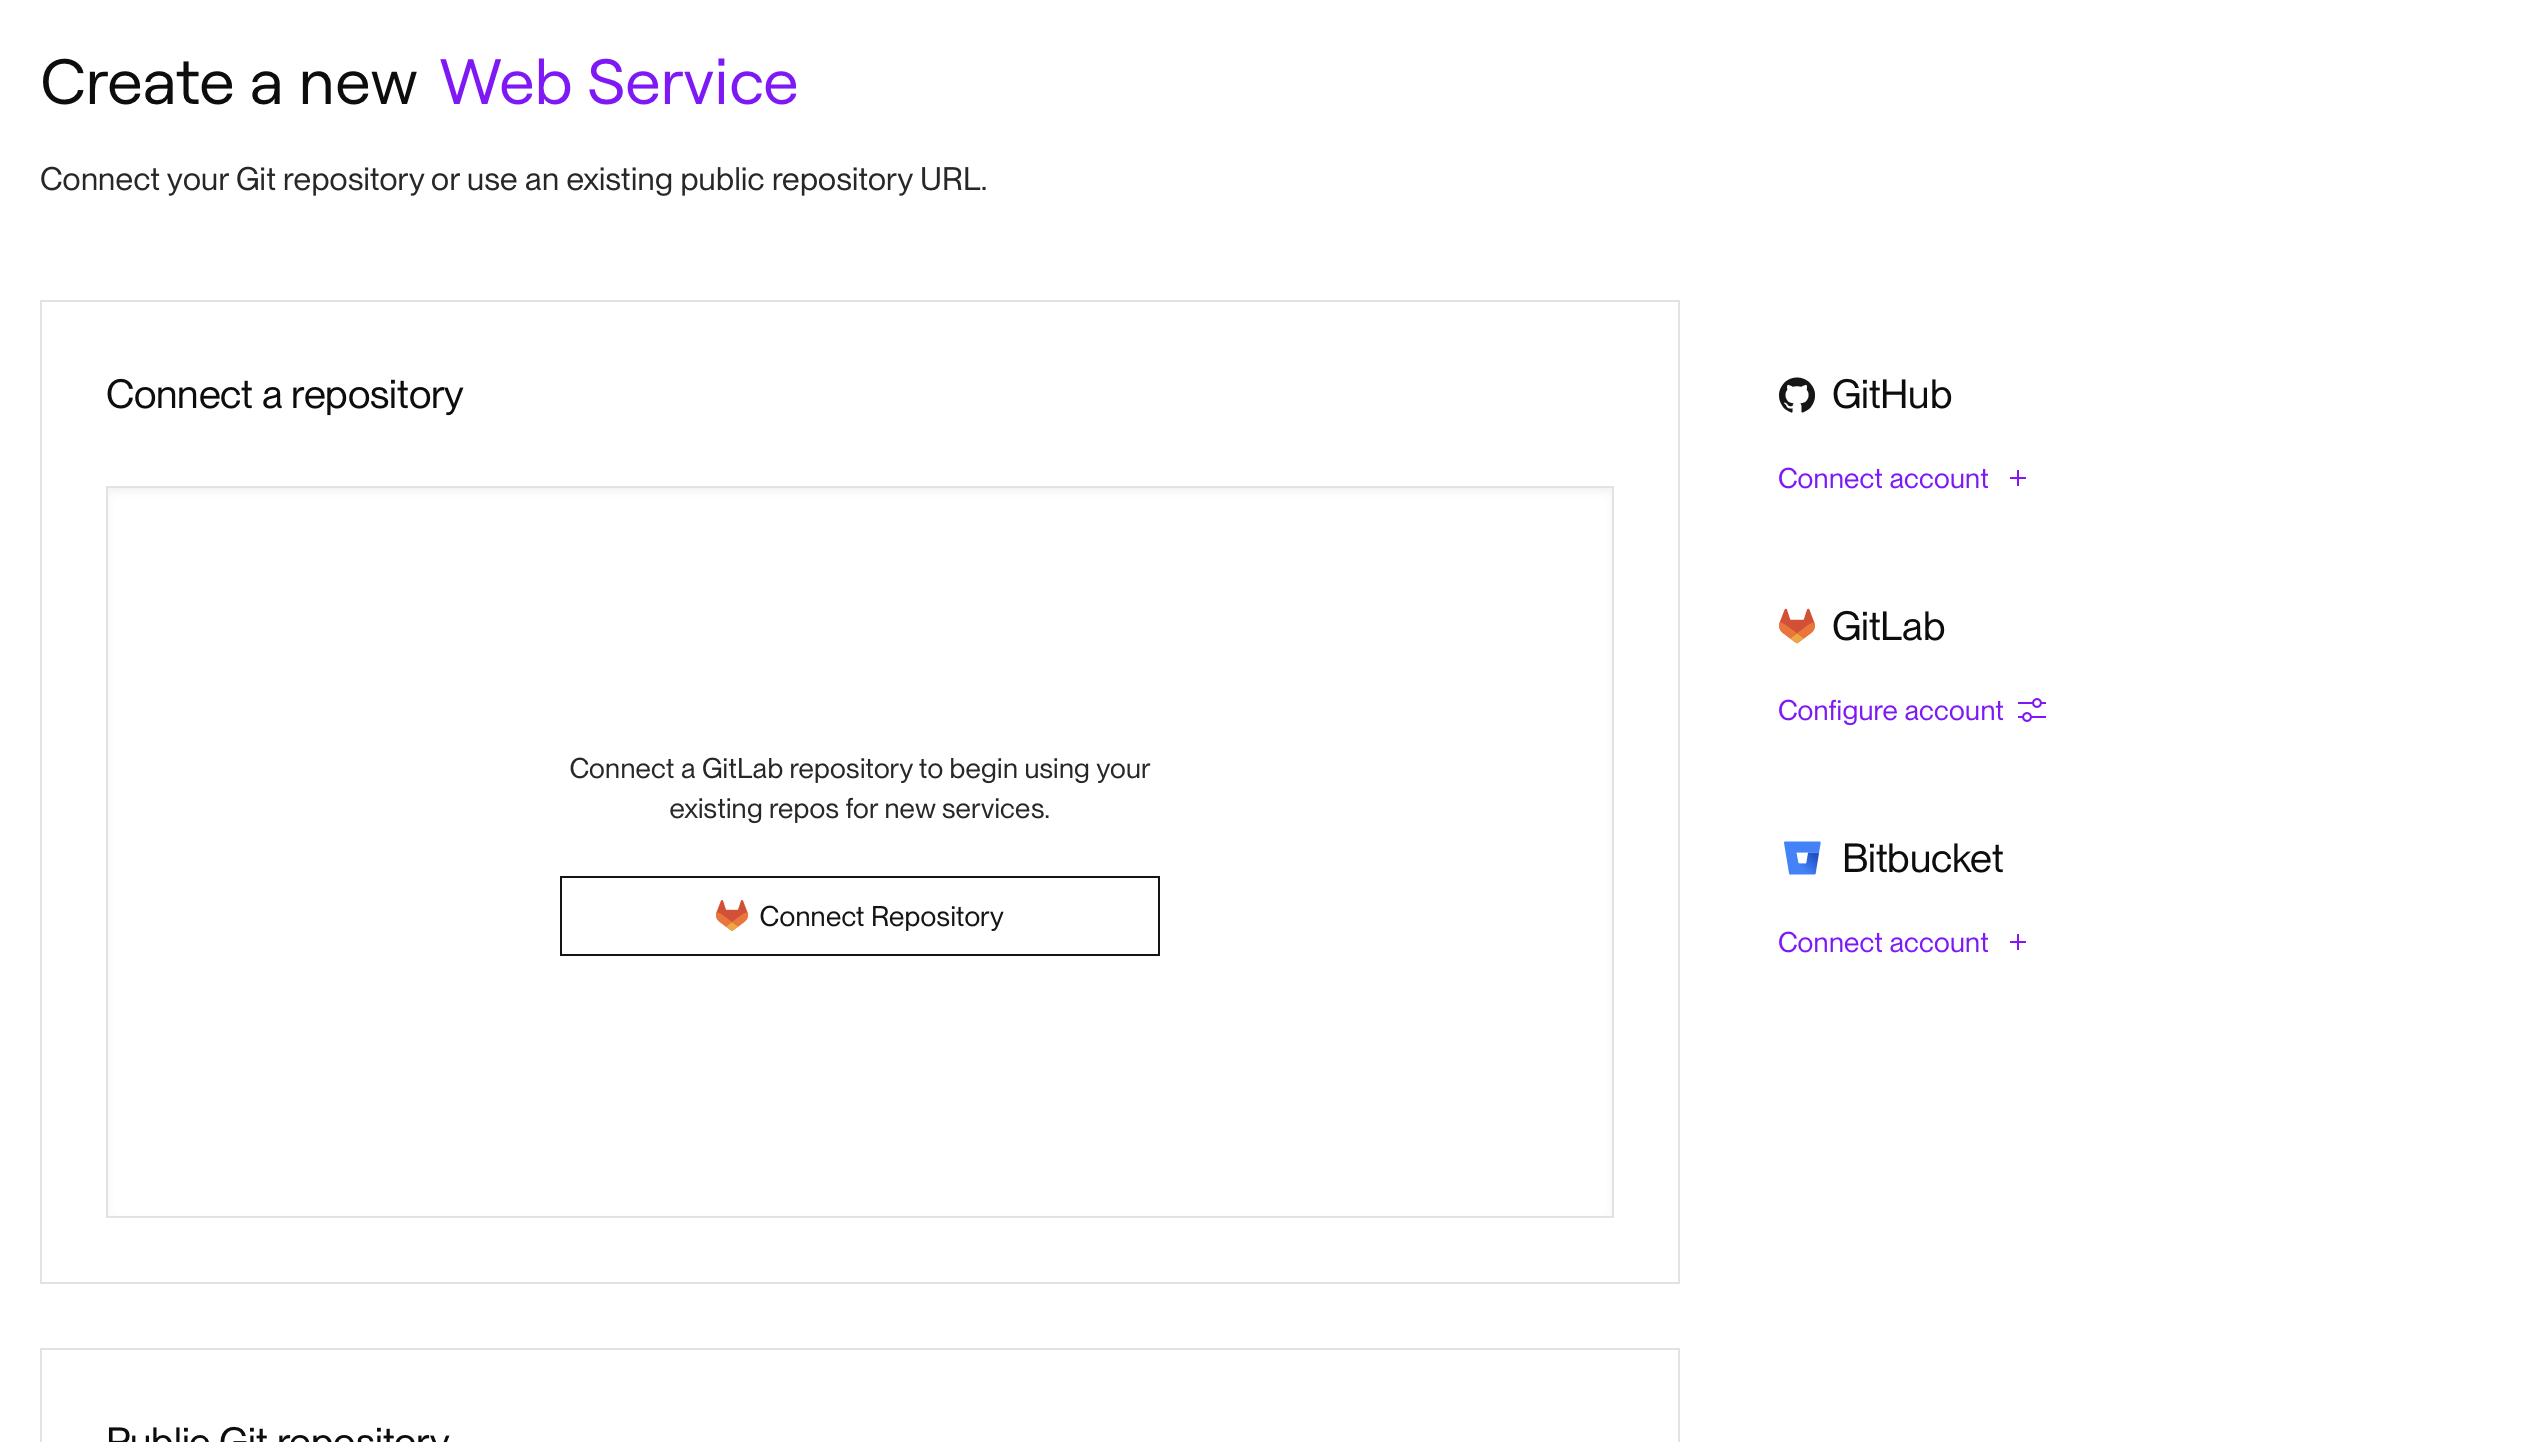
Step 3
And there, the only available option should appear.
Step 4
Right there, we will find the "Add from env." option that we will need to create this connection between the databases and the app.
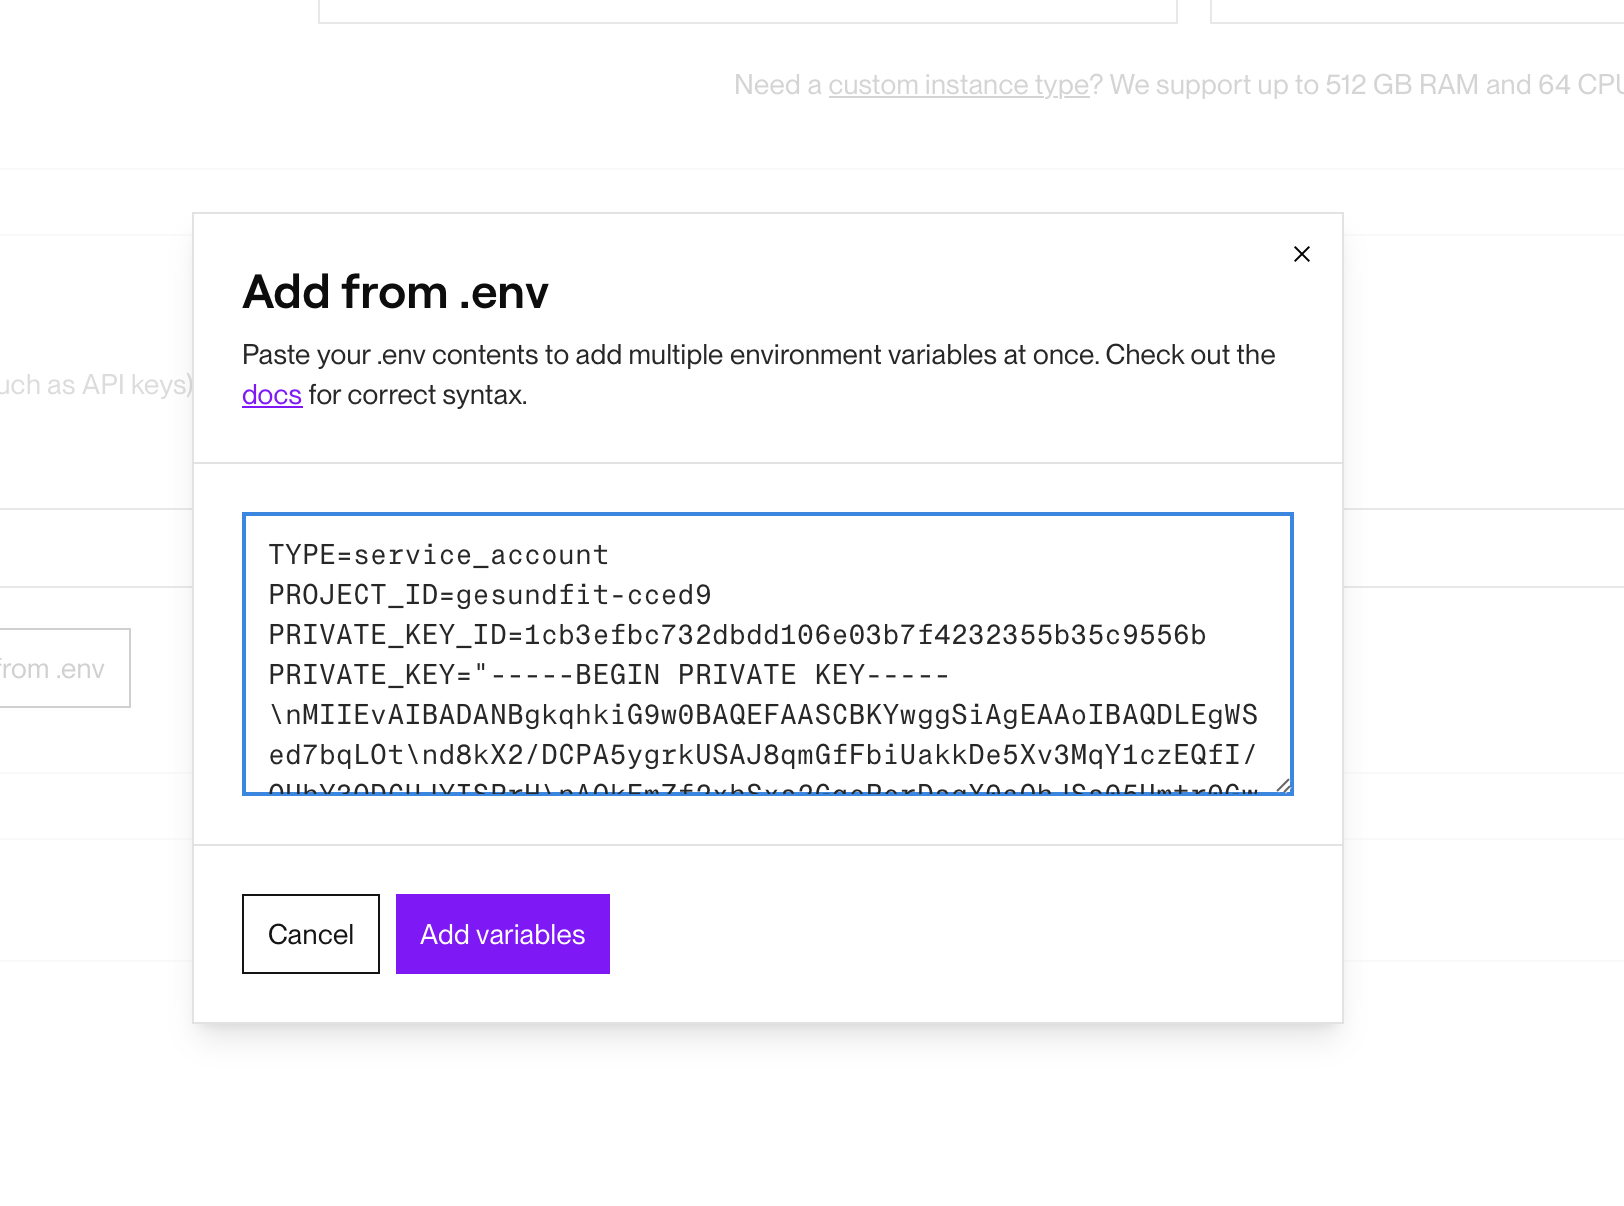
Step 5
Here we will observe the live activity of the database running with the app and with Xiao's information.
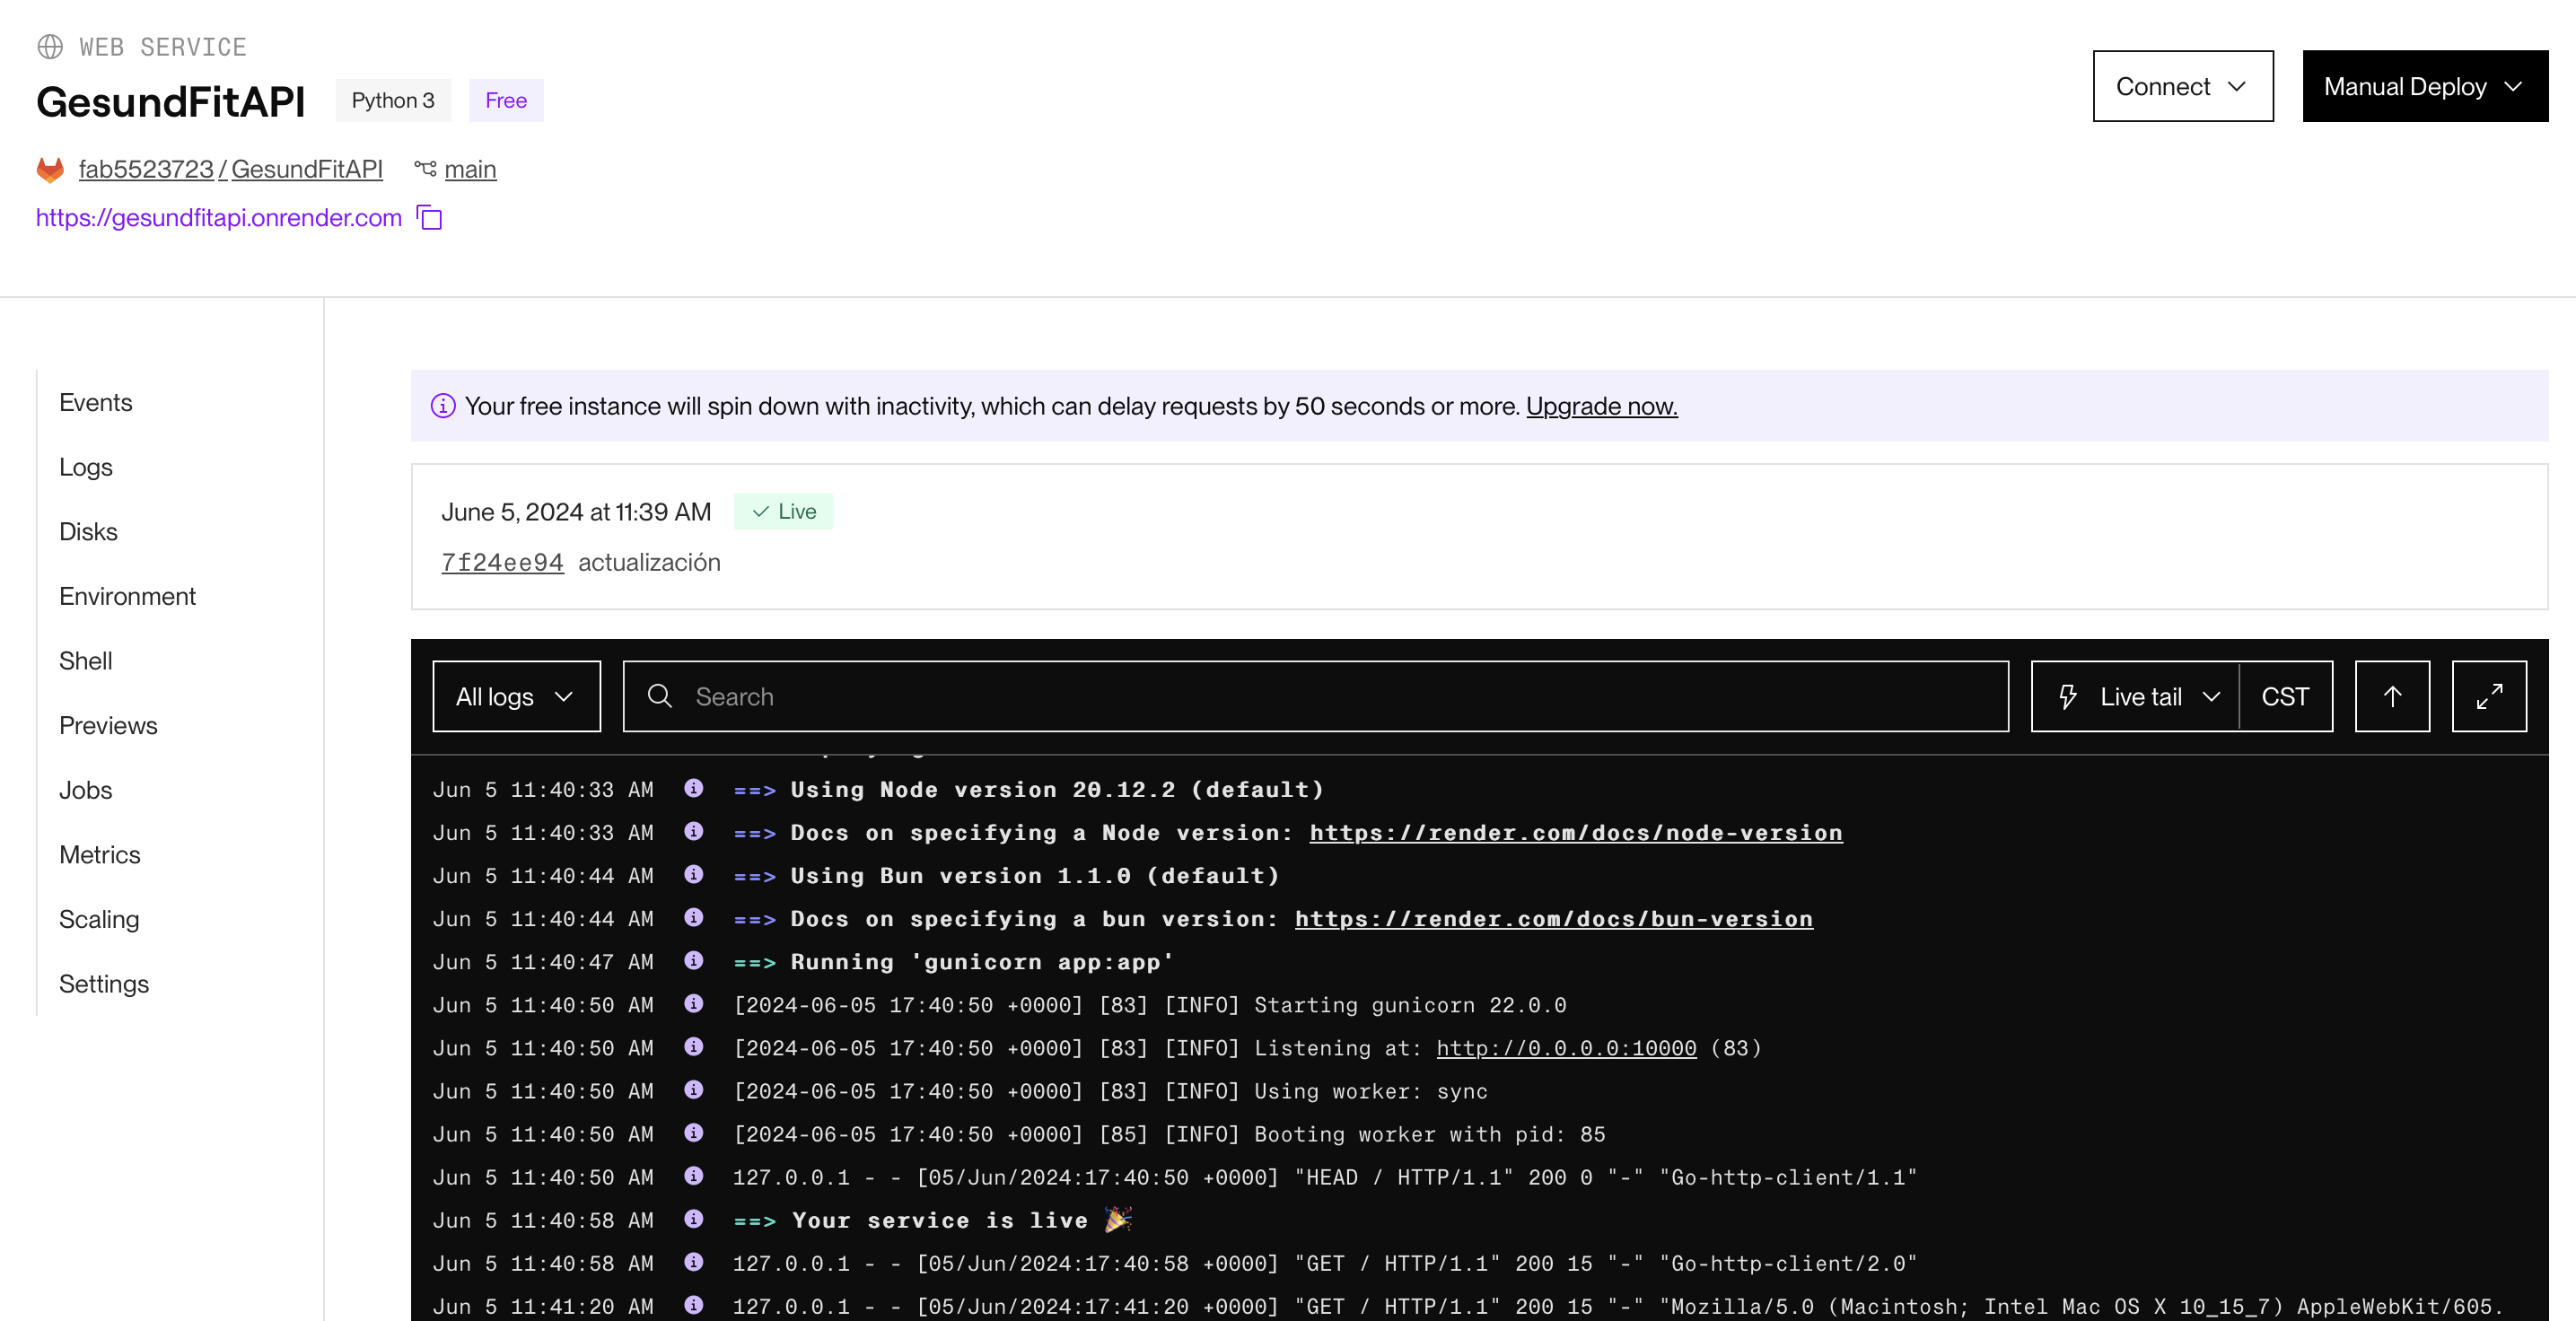
FINAL RESULT
Here its the final result with the SmartBand, the sensors,the app and the datebase.
External desing
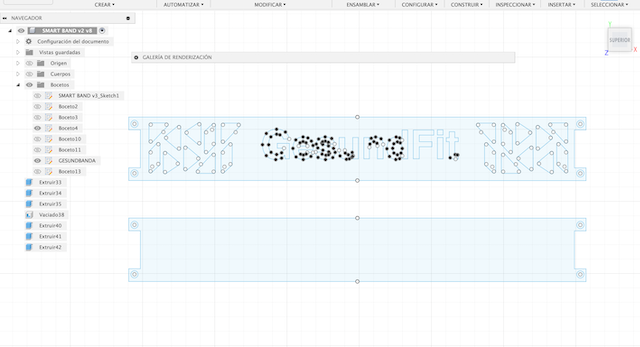
3D Case Modelling
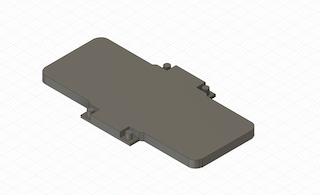
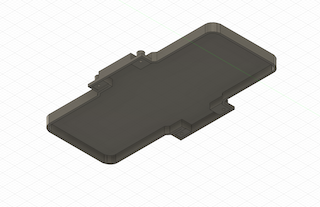
We used Fusion 360 to design the smart band case.
Step 1: Case Design
Tool Used: Fusion 360
We utilized Fusion 360 to design the smart band case.
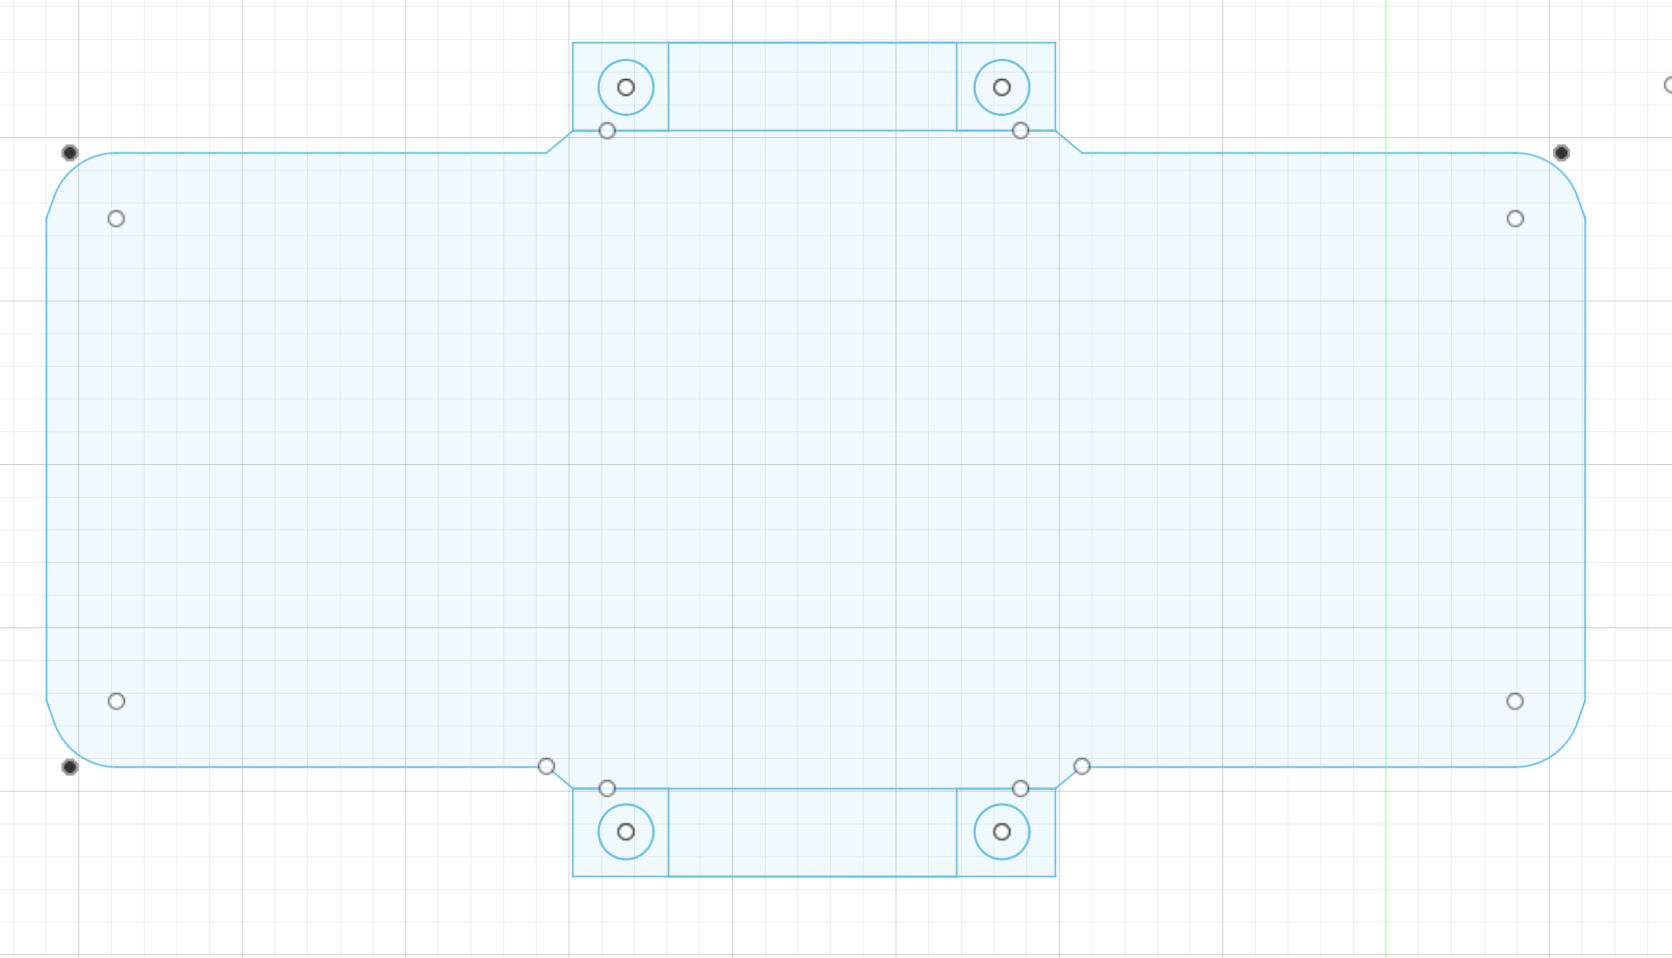
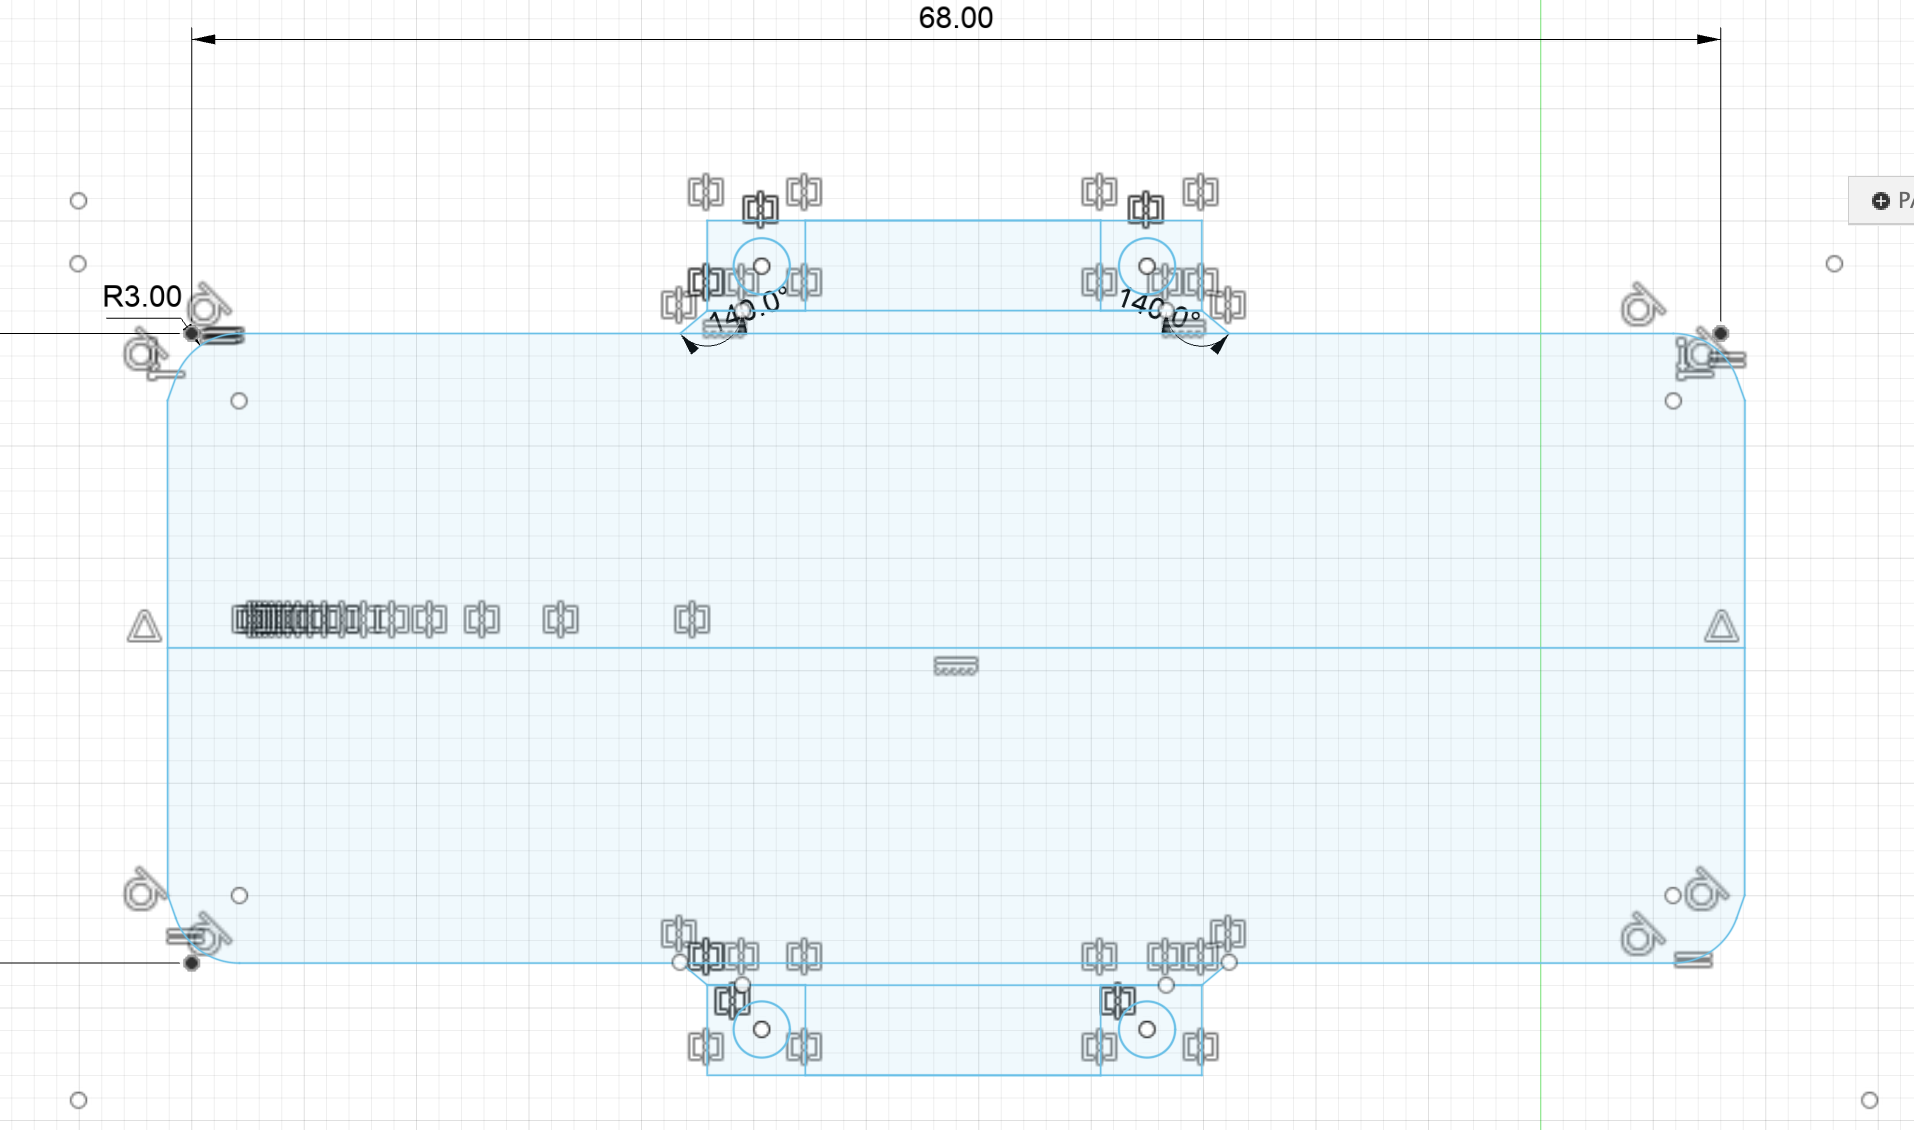
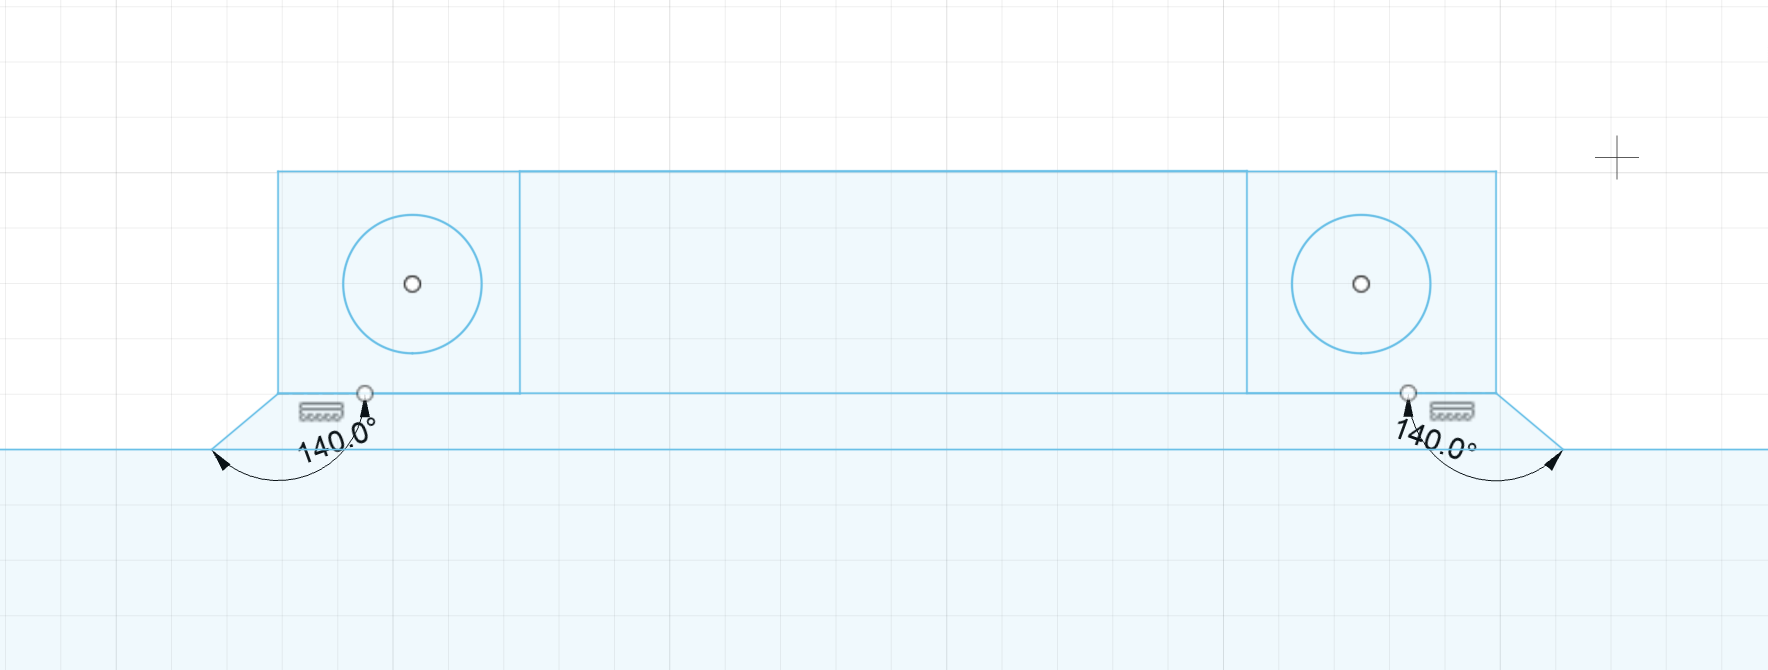
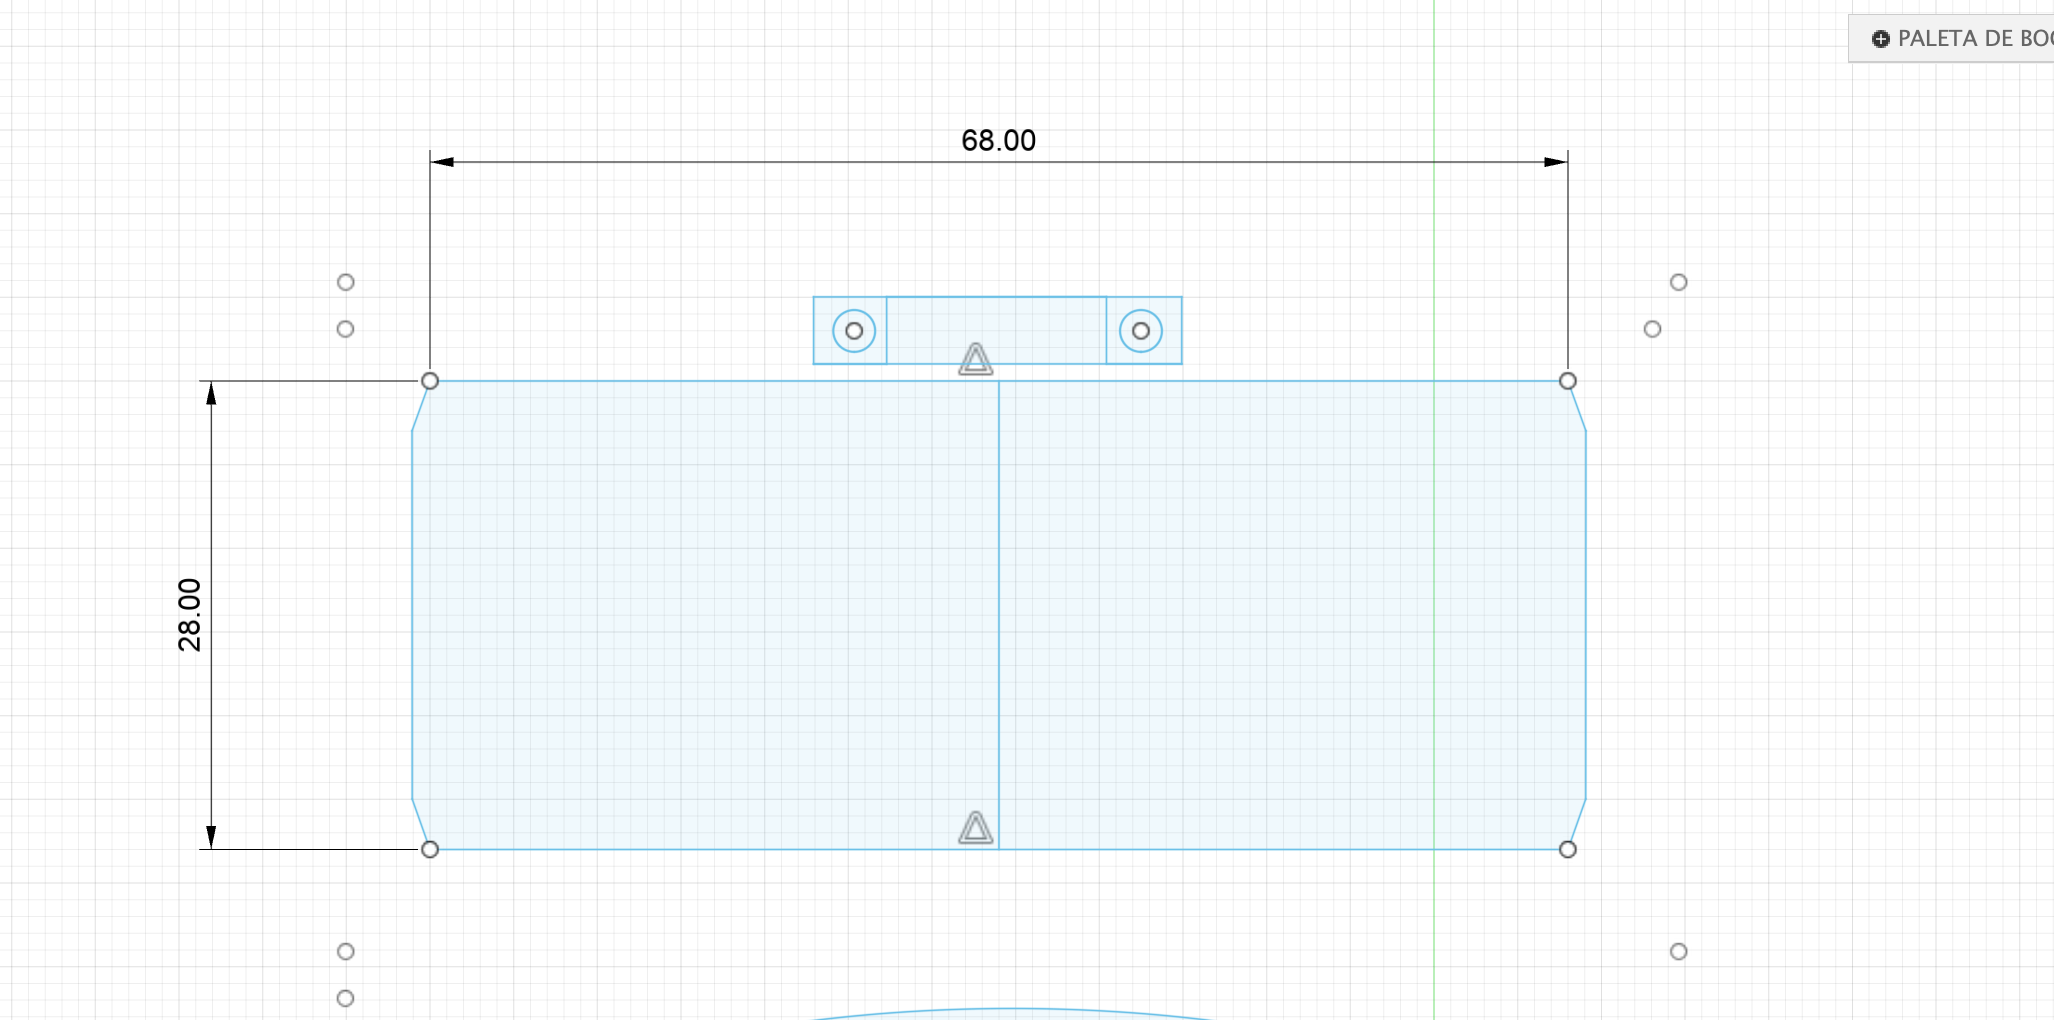
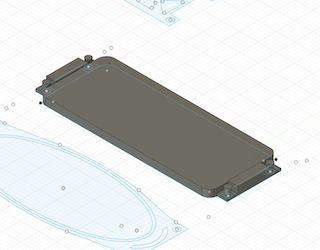
Step 2: Case Design Division
We divided the case design into two parts to facilitate PCB insertion.
This design choice allows the sensor to be exposed for direct skin contact, while safeguarding other components.
Step 3: Exporting to STL for 3D Printing
Exporting to STL for 3D Printing
We exported the design to STL format from Fusion 360 to prepare it for 3D printing.
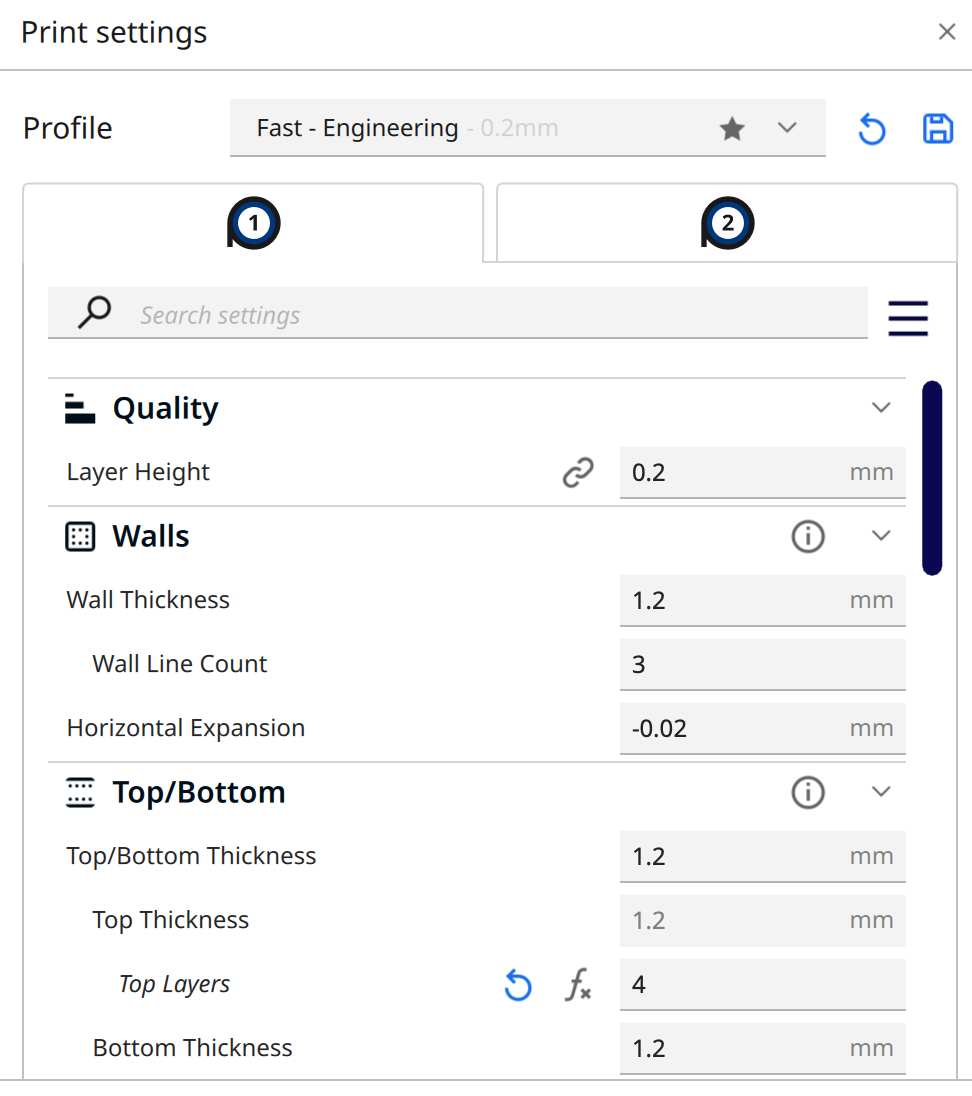
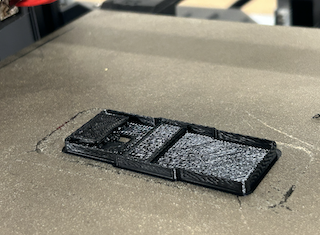
Step 4: Slicing and Material Settings
Slicing in Ultimaker Cura and Material Parameter Adjustment
We used Ultimaker Cura to slice the model.
We adjusted the material parameters for the TPU filament that was used.
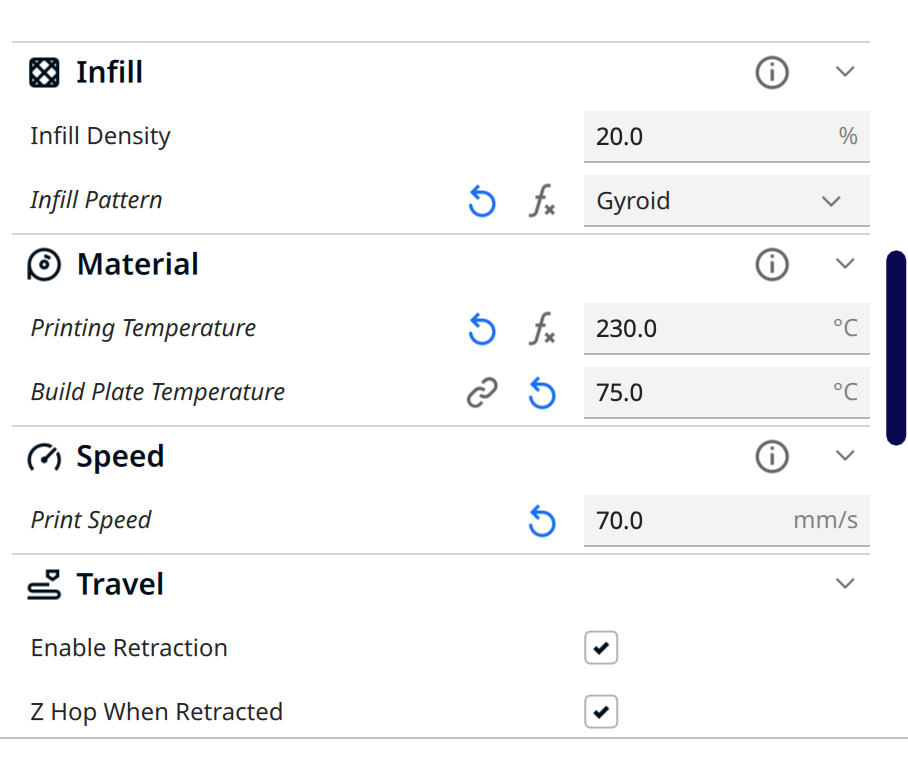
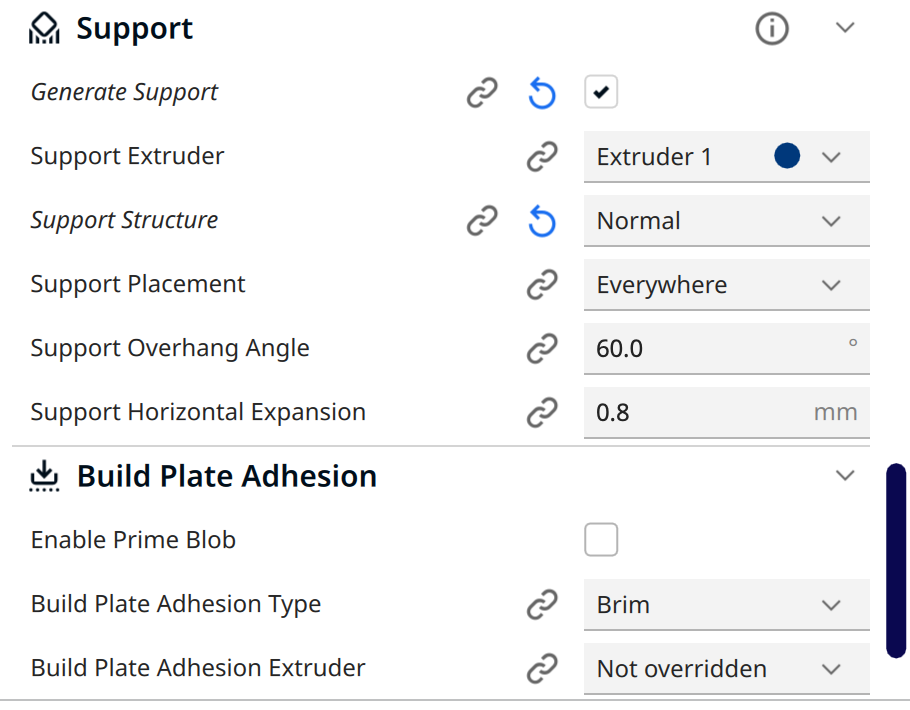
The same for both parts of the smartband case.
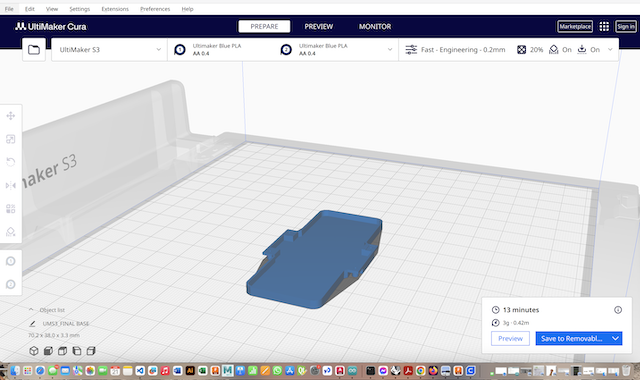
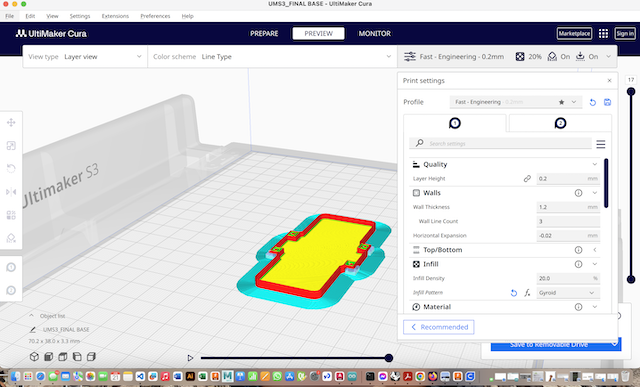
And printing them without problems.
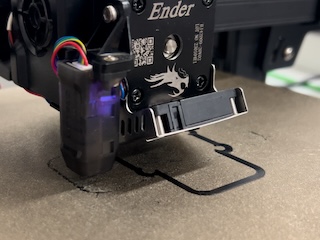
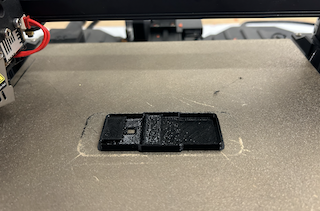 More 3D Print Process
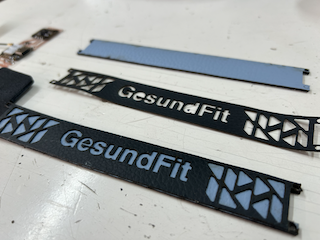
Designing Smart Band Straps
We will now proceed with designing the straps for the smart band.
Step 1: Designing Straps in Fusion 360
Tool Used: Fusion 360
We designed the straps using Fusion 360, ensuring ergonomic comfort and durability.
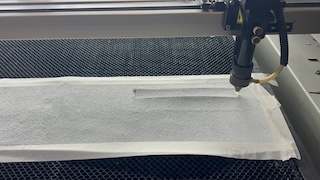
Step 2: Exporting to DXF for Laser Cutting
We exported the strap designs to DXF format from Fusion 360 to facilitate laser cutting.
Step 3: Using Faux Leather Material
We utilized faux leather material for the straps to achieve the desired aesthetics and durability.
Step 4: Adjusting SmartCarve Parameters
We adjusted the SmartCarve parameters to cut the faux leather without causing burn marks.
Final result
I glued the leather strips with Resitol 5000 to prevent them from coming loose.
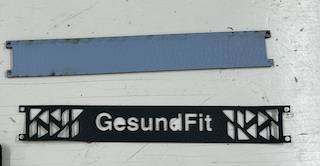 More Laser cutting Process