Week_11: Input Devices
There are different kind of signals that can be detected by the microcontroller, this signals are Inputs and can be digital (either on or off) or analogic, which tend to have values between 1 and 1080 (Depending on the microcontroller and software).
Examples of digital inputs are simple buttons which trigger a current flow that then is detected and interpreted. On the other hand we have analogic signals like different values on resistance when using variable resistors, with this one can
program a rotary encoder that knows the position of the turn based on this change in resistance.
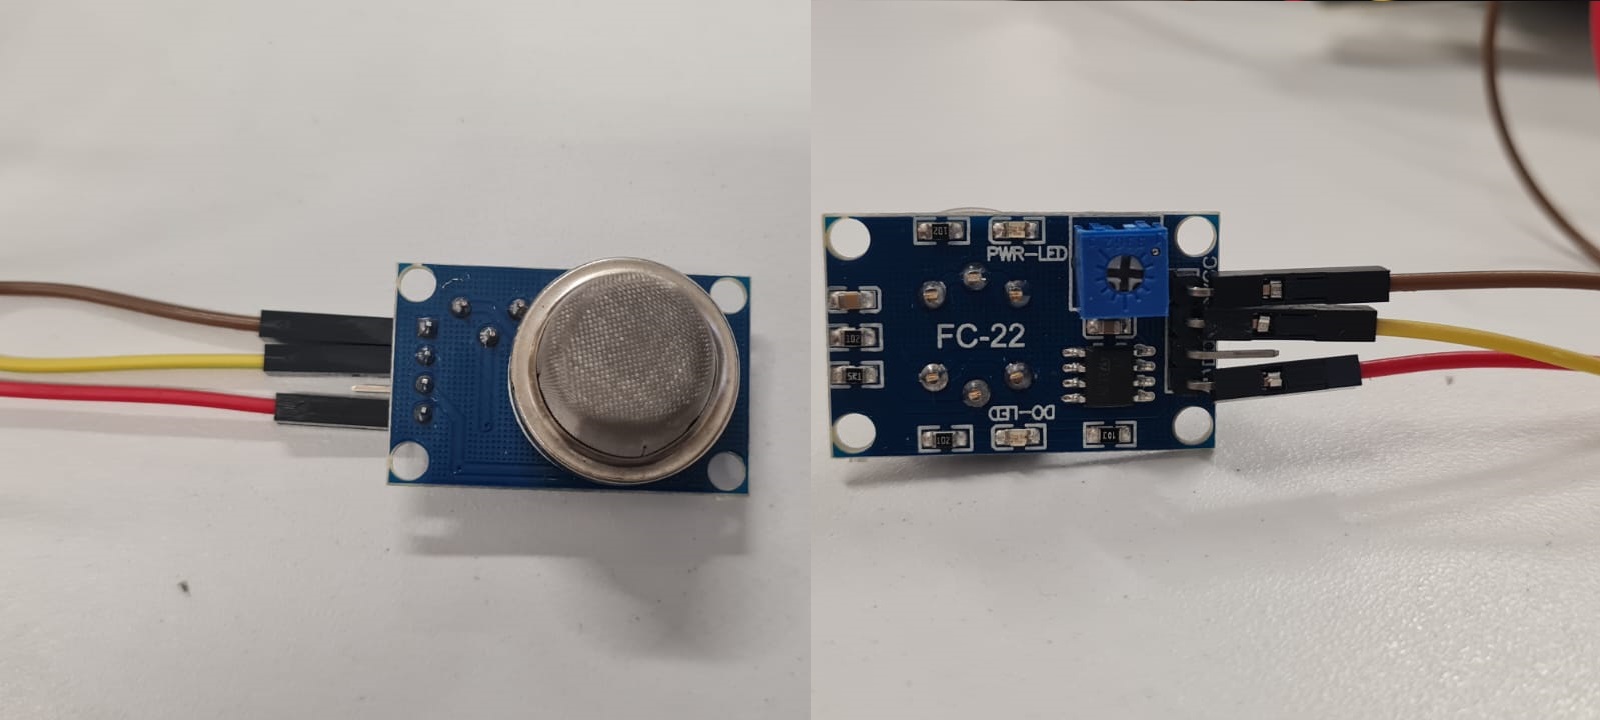
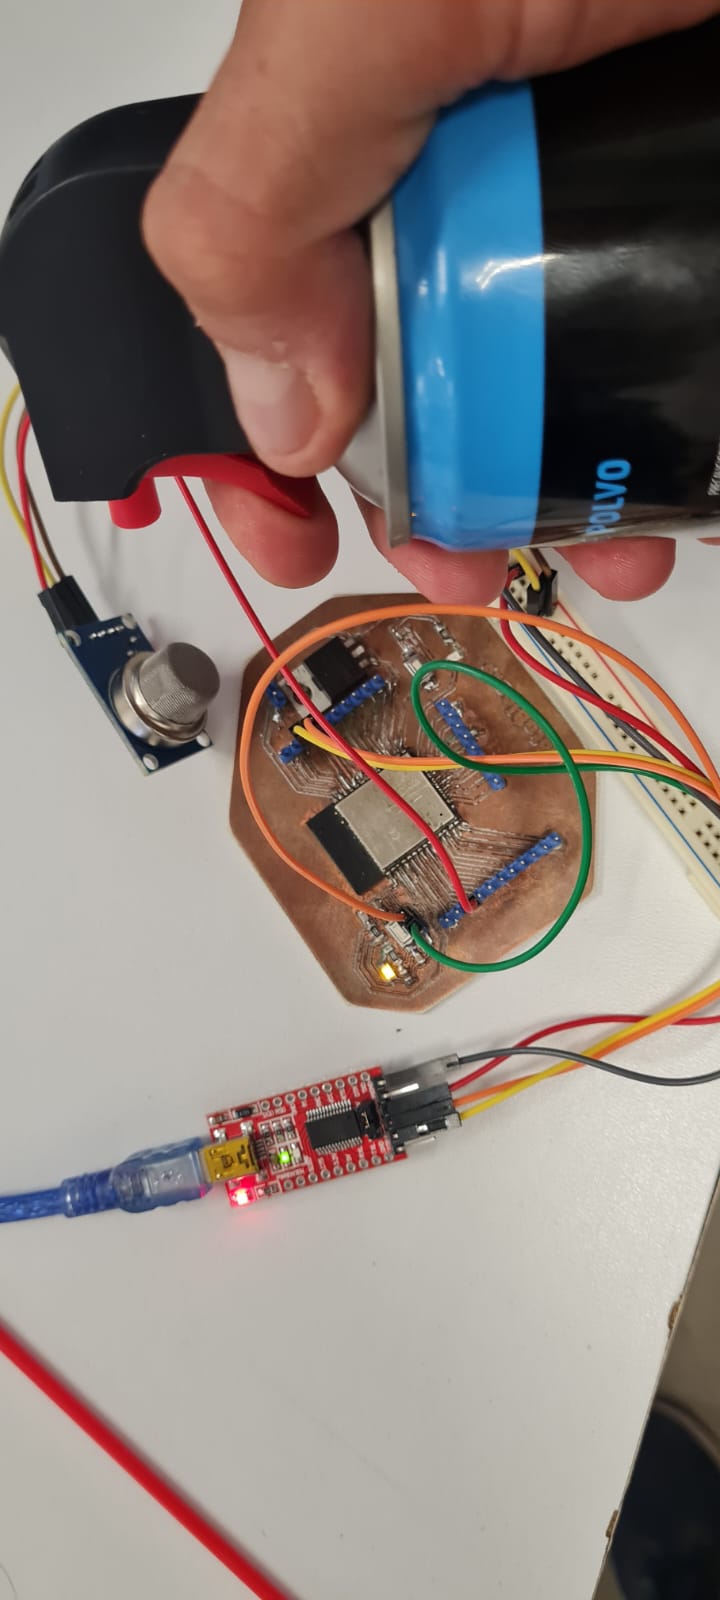
For this exercise I will be using a FC-22 (MQ2) flamable gases sensor which is a bit related to my final project of air quality sensibilization sculpture. The first part was to read the
datasheet, which provided me with the pinout and possible data that goes into the Arduino IDE. The sensor apparently can give either digital and analogic readings through the pins. And the ESP32 module I designed and built from Week 8.
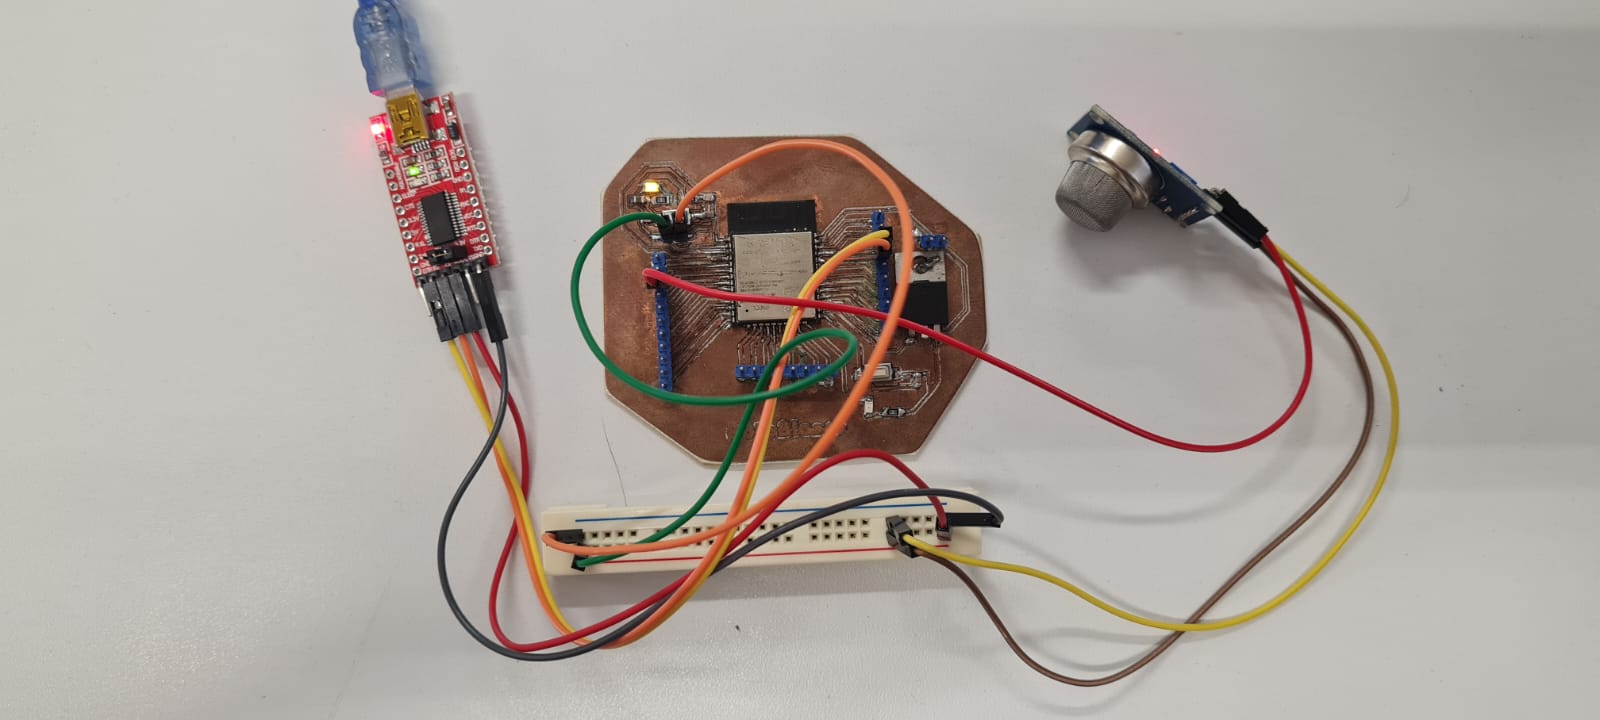
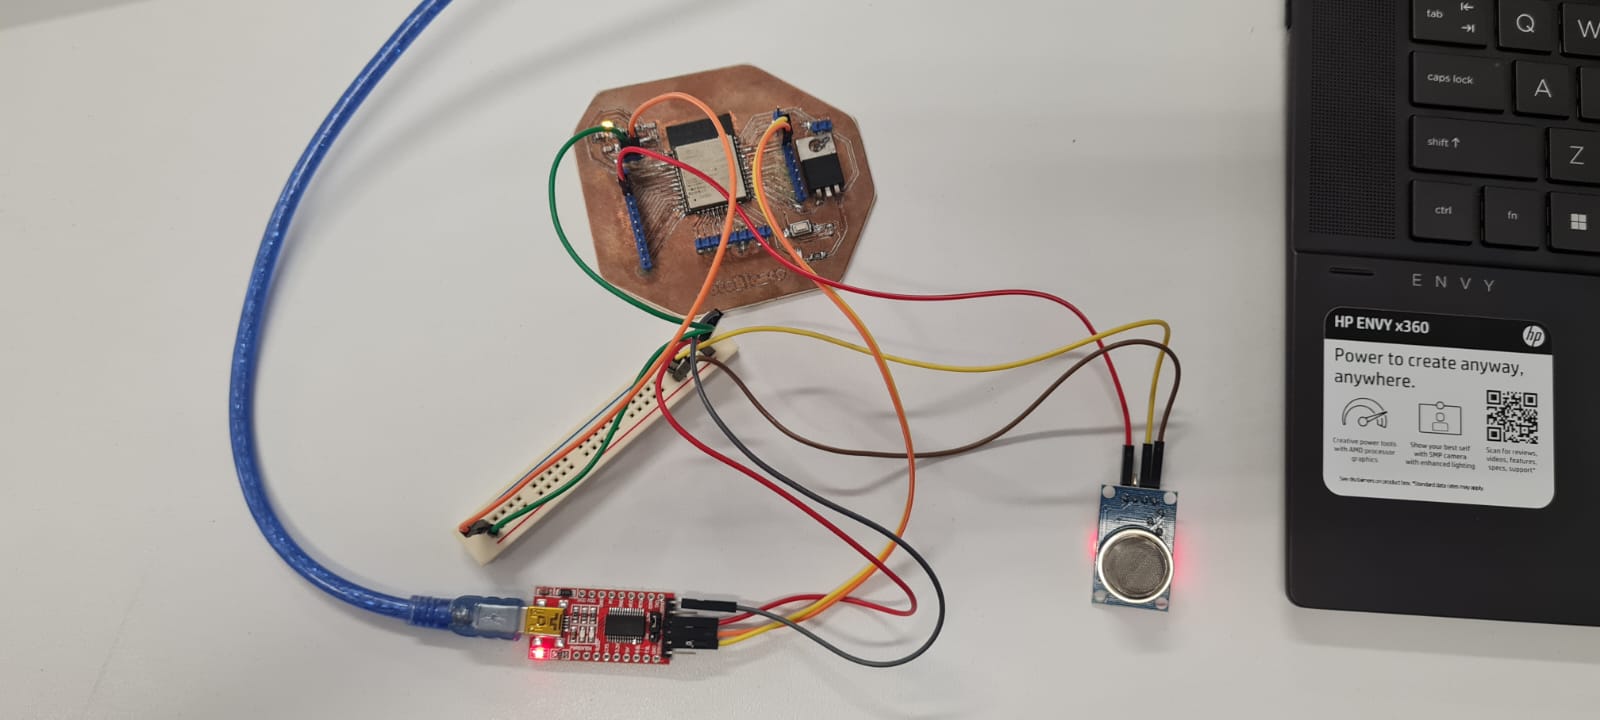
 In this case I will be using the analog data to plot it in a graph and check the differences in the air and gases, because it can give a more accurate reading, as the digital input can only be a number between 0 and 1023. The analog output pin from the sensor goes straight into one of the analog input pins in the ESP32 I designed, Ground and Voltage go connected using a protoboard strip
(This design problem will be solved in the next iteration of the circuit board, as I only have 1 GND and 1 Vcc pins respectively). This kind of sensor can give values between 300 and 10,000 ppm, so I used the Map tool in Arduino for it to convert it from 0-1023 to 300-10,000, for example for ovens it can be useful to have a minimum value
to shut down the valve, or in the case of the Final Project, it could be used to map the particles around the sculpture for it to react.
In this case I will be using the analog data to plot it in a graph and check the differences in the air and gases, because it can give a more accurate reading, as the digital input can only be a number between 0 and 1023. The analog output pin from the sensor goes straight into one of the analog input pins in the ESP32 I designed, Ground and Voltage go connected using a protoboard strip
(This design problem will be solved in the next iteration of the circuit board, as I only have 1 GND and 1 Vcc pins respectively). This kind of sensor can give values between 300 and 10,000 ppm, so I used the Map tool in Arduino for it to convert it from 0-1023 to 300-10,000, for example for ovens it can be useful to have a minimum value
to shut down the valve, or in the case of the Final Project, it could be used to map the particles around the sculpture for it to react.
And the code was fairly simple to find online, which is:
float gasPin = A6;  //GAS sensor output pin to ESP32 Analog Pin 6, which is the overall pin 34
void setup() {
Serial.begin(9600);  //Initialize serial port - 9600 bps
}
void loop() {
analogRead(gasPin);
gasPin = map(gasPin, 0, 1023, 300, 10000);    //This part converts the analog reading into ppm from the sensor
 Serial.println(gasPin);  //This command reads the readings from the sensor
delay(100);                                     // this command prints said reading every .1 seconds, and starts again with another reading.
}
This gives us as a result a graph. The sensitivity of the sensor can be modified by using the potentiometer that's included in the module. The first image is with the default sensitivity, and the other one is corrected which gave me better and more consistent readings. I used one can of duster gas for this experiment.
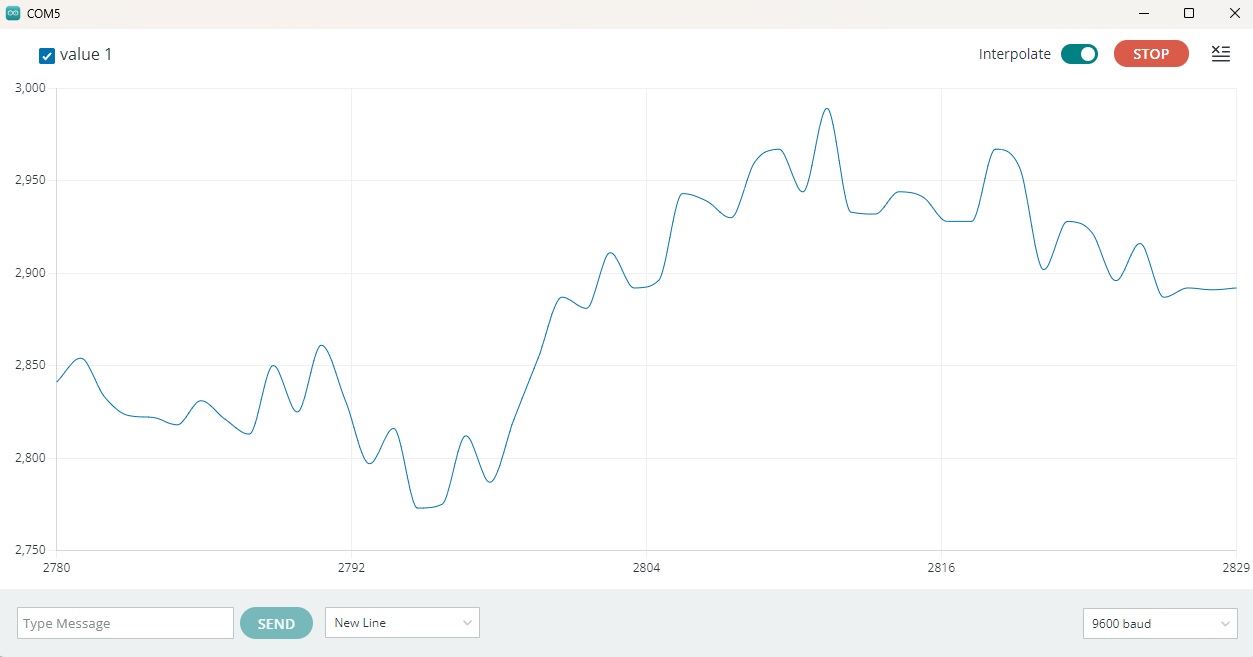
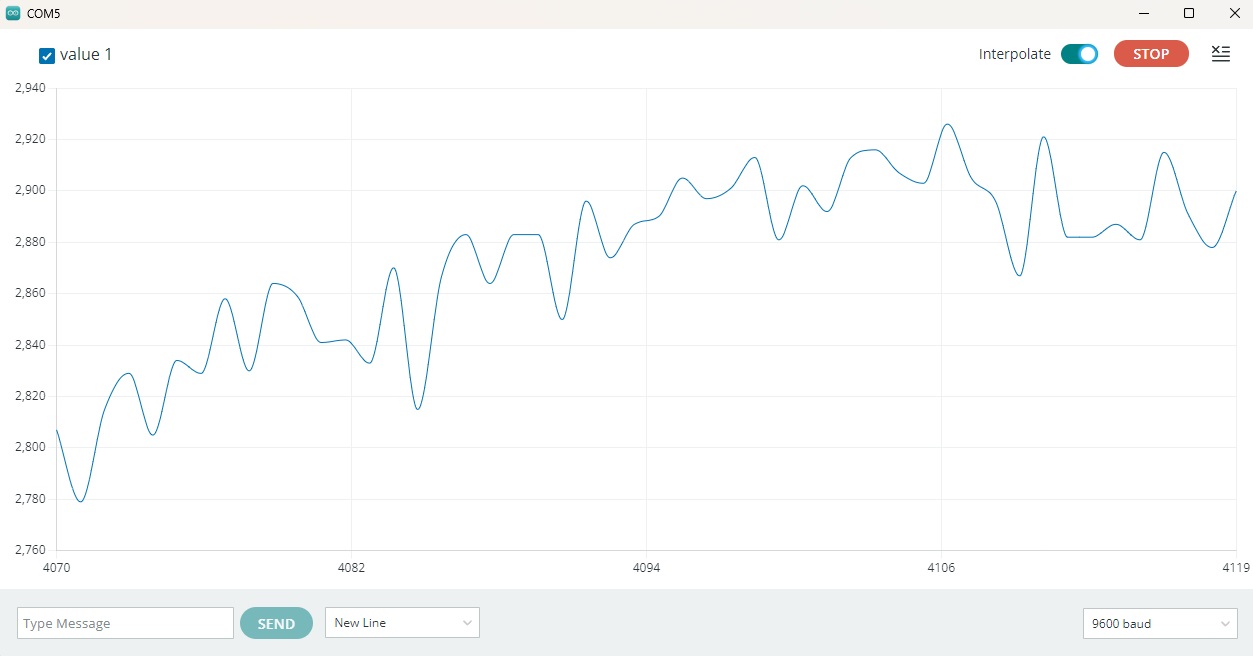
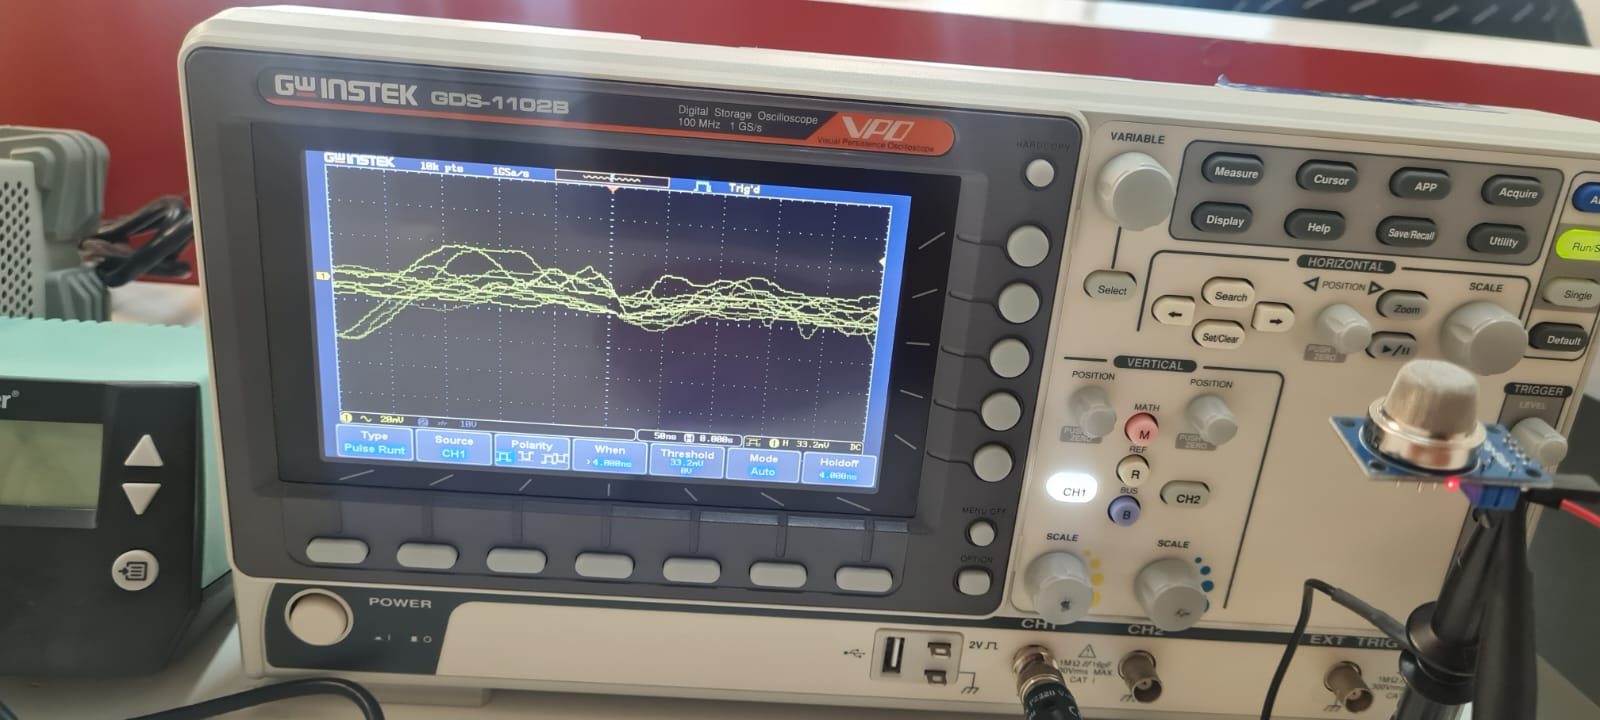
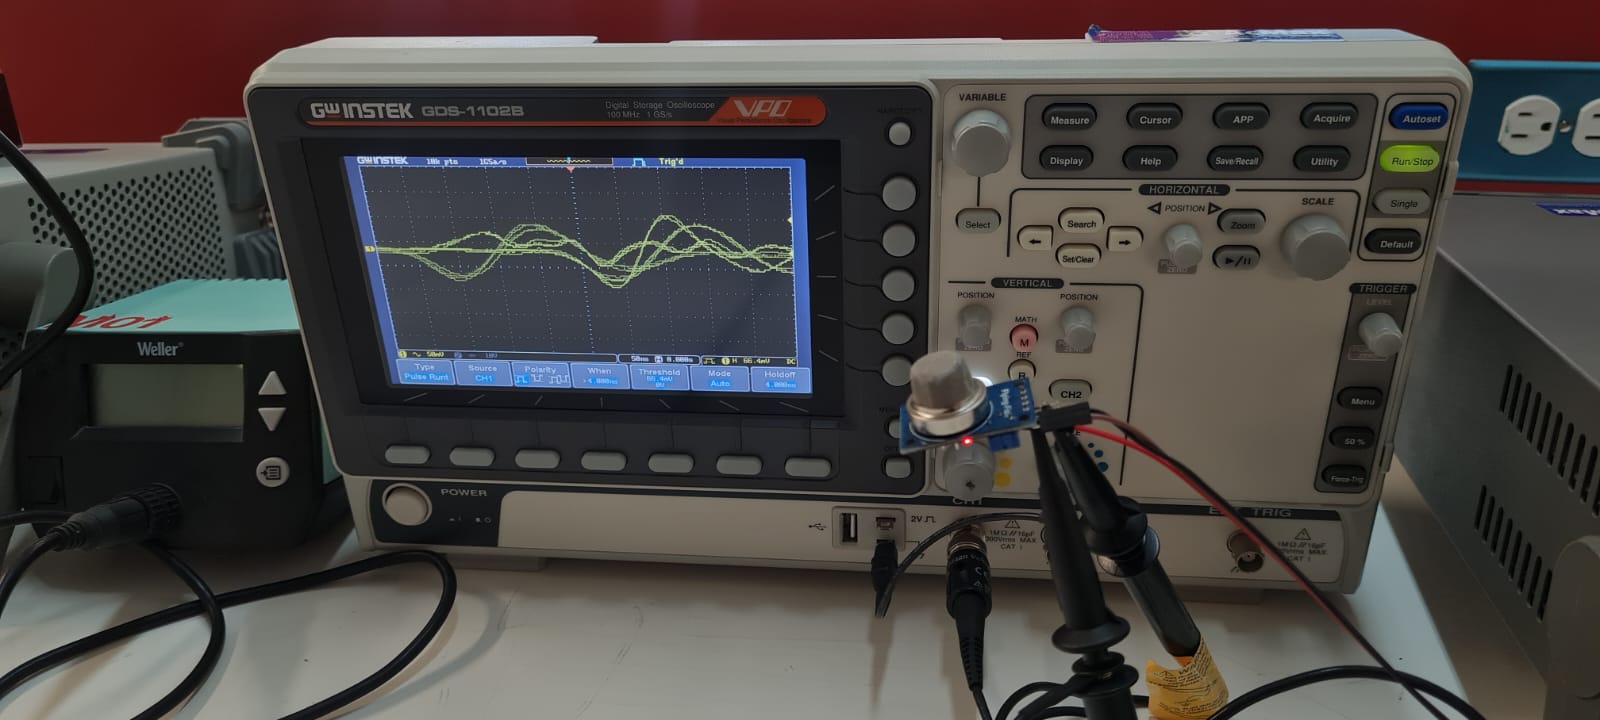
This graph is showing us a peak of about 250ppm everytime the can is sprayed on it, and also reacts with breathing with a spike of around 60ppm. And over here I connected the circuit to a oscilloscope for comparing this kind of signals. The first one has a bit of noise but it's without any kind of particles or gases applied to it, the second one is the result of blowing into the sensor, as we can see the disruption is similar to the one on the Arduino plotter.
The sensor was connected to the Board I designed and built on week 8 on the Pin number 34 using Dupont cables. The oscilloscope part was a bit trickier as the signal is very small. I connected the Analog Output from the sensor to one terminal of the Oscilloscope, I powered the sensor with the ESP32 Vcc+ and GND pins, and connected the common GND to the other terminal in the Oscilloscope. At first I tweaked the knobs for the vertical and horizontal scales until I found a recognizable wave. Did some tests by blowing into the sensor to see if the wave/graph changed and it didn't work. So I played around with the values some more until I got a reaction from the wave projected, and comparing it to the one on the serial plotter on the Ardiuno IDE it made sense, as the sensor gives back a change in voltage from 0v to 5v depending on the ammount of particles and the gas detected.
I have included the Arduino code and the datasheet for the sensor in the Downloadables website. See you next week!