00 Week :: PRINCIPLES AND PRACTICES
Our first assignment is to think and sketch the genesis of our final project. Quite a challenge!
SINOPSIS
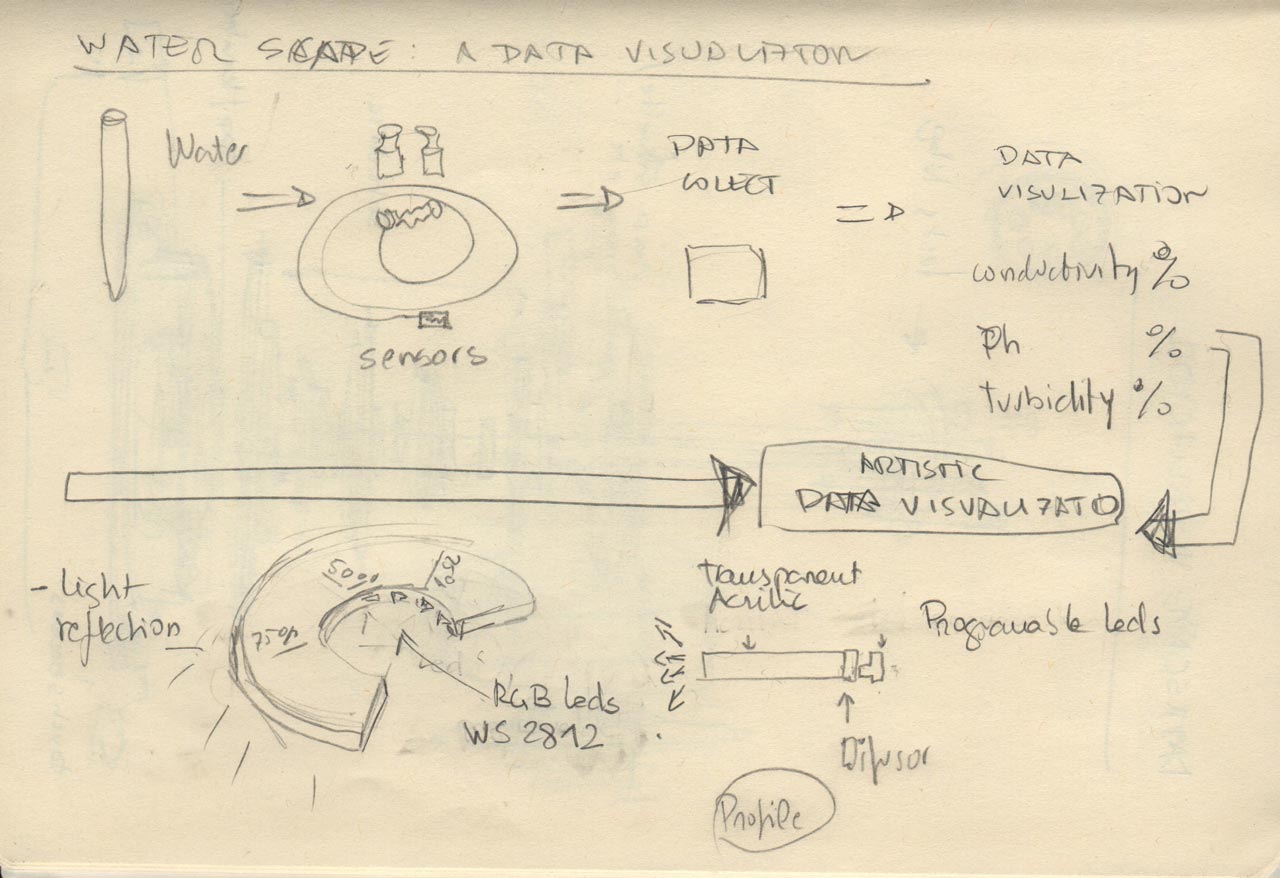
What is Waterscape?
Waterscape:: a Data Visualizator is a device that allows you to test the quality of water for human consumption; analyzing, by the use of sensors, its physical, chemical and biological characteristics; to translate the resulting data into an artistic visualization in the form of light ring graphs.
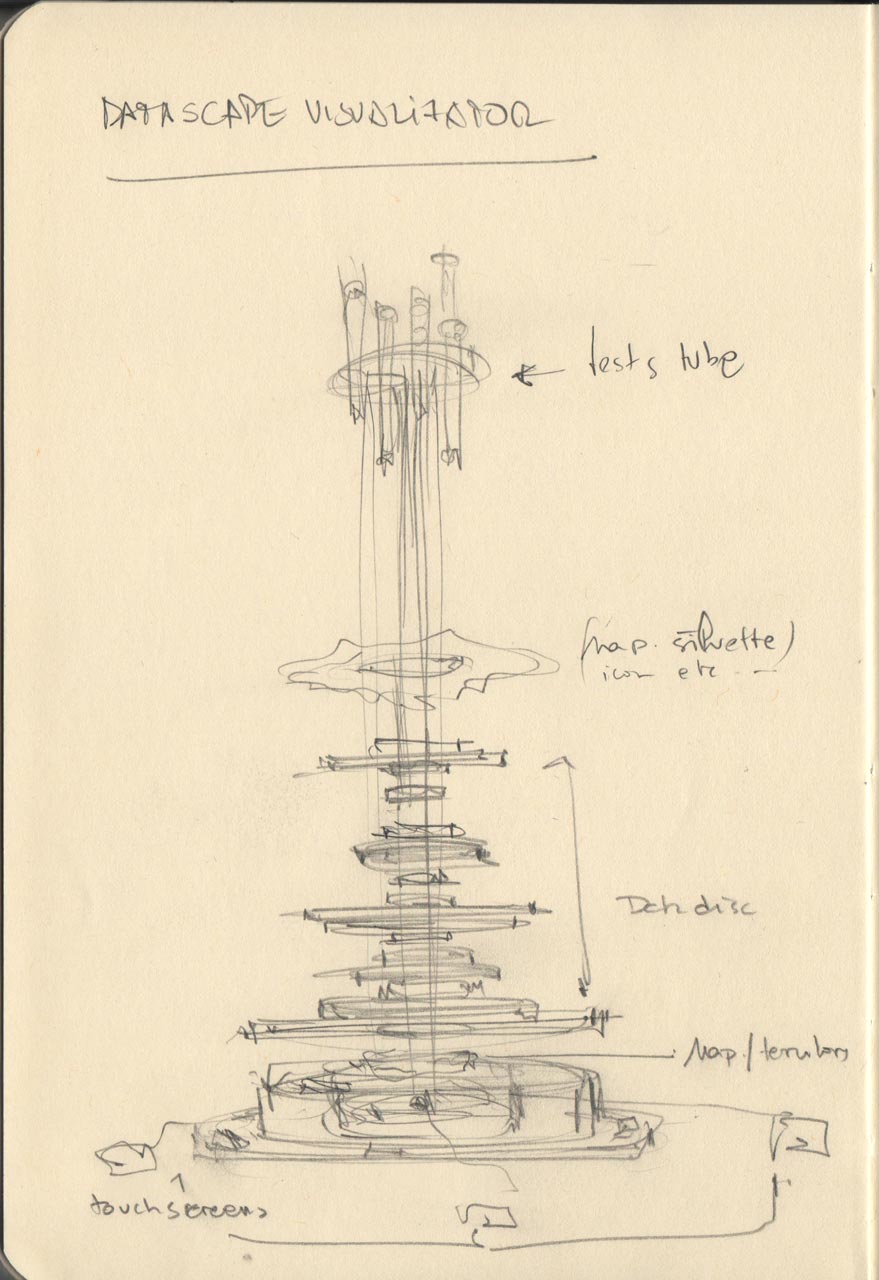
How does Waterscape work?
The water quality will be analyzed by the use of sensors of conductivity, Ph, turbidity, etc… The resulting data will be interpreted in percentage terms, and will be translated into lines of light, by means of RGB Leds WS2812 programmable with arduino system or similar. The strip of Leds will be located in the inner part of each transparent methacrylate ring and its reflection will cause a line of light on the outer edge of the circular ring. The set of all the rings will form a sculptural landscape of light that will indicate the level of potability of the analyzed water.
CONCEPT
I am fascinated by data. They are like indecipherable codes that allow us to tell any narrative. We live immersed in data, we ourselves are data. Being able to visualize these data in an effective and attractive way allows us to understand the complexity of the world around us.
Art, because of its enormous capacity for abstraction and for producing metaphors and associations, is a very effective tool capable of contributing unique values to this new language of data visualization.
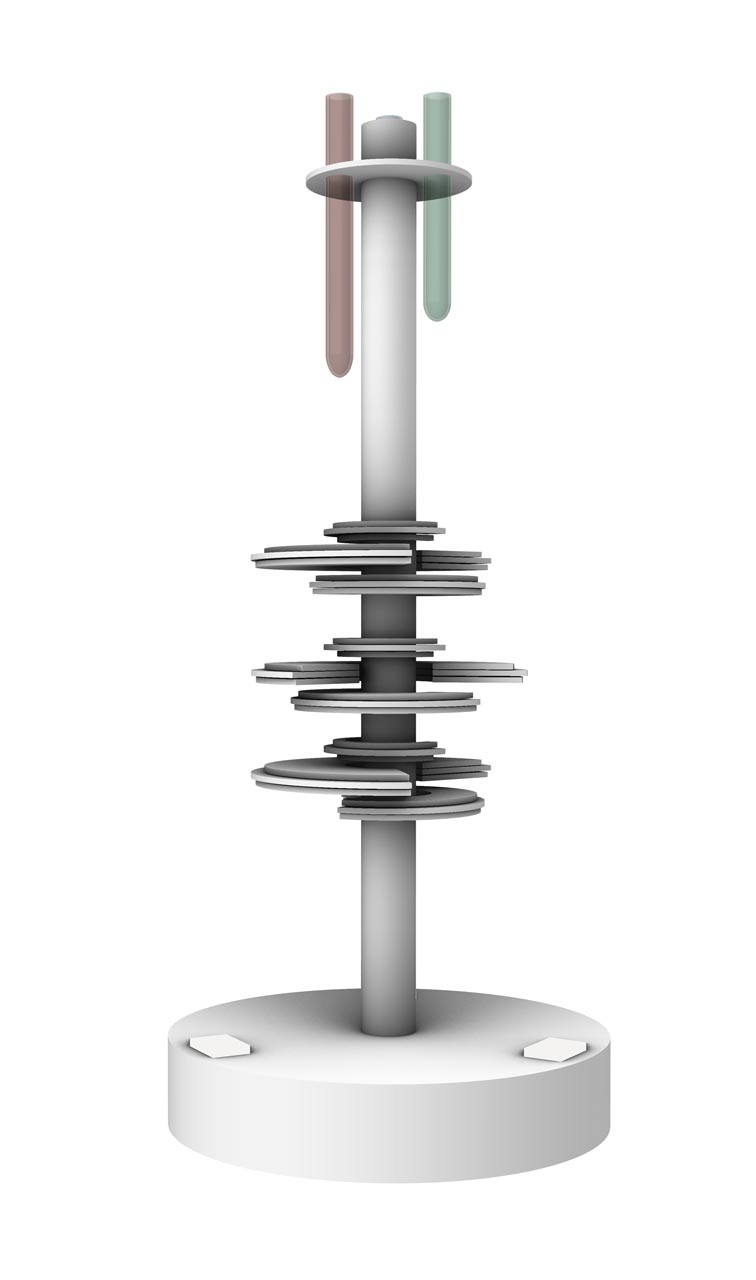
FORMALIZATION
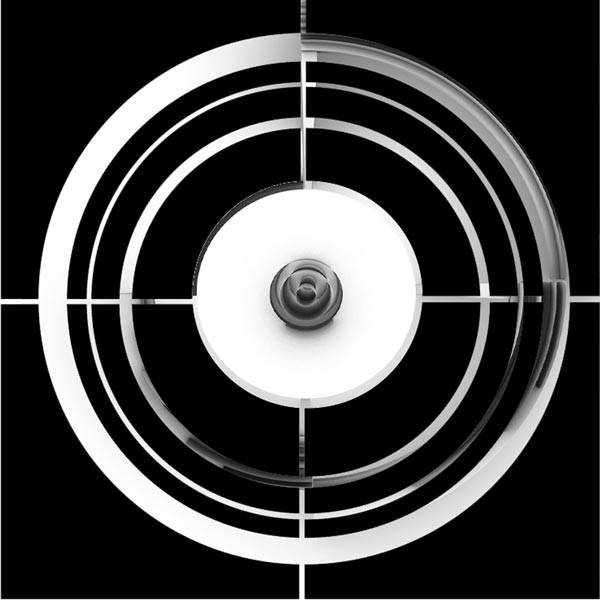
My final project aims to be a three-dimensional data visualizer, a matrix artifact, which takes as a starting point the circular ring graphs, to generate sculptural and modular data landscape that allows to translate different parameters of water quality in an abstract sculptural device.
I will use light, sensors and touch screens that react to the data provided in the programming. A sculptural translator that turns numbers into abstract landscapes through light, movement and dynamic shapes.
And... this is the first render!
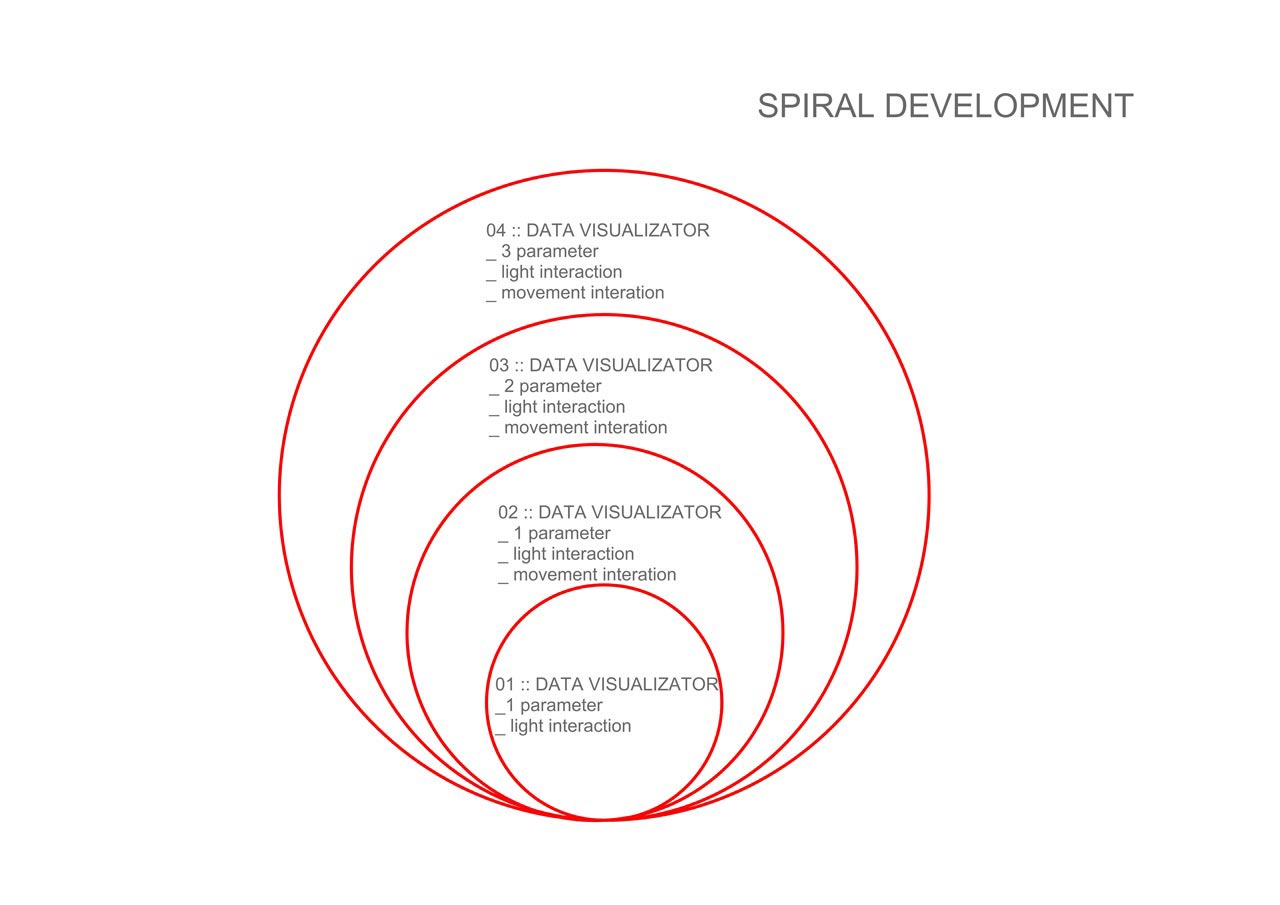
METHODOLOGY
In the FabAcademy we use the Spiral Develompent methodology. It is important to identify the different levels of difficulty of your project and reach them in a progressive learning process.
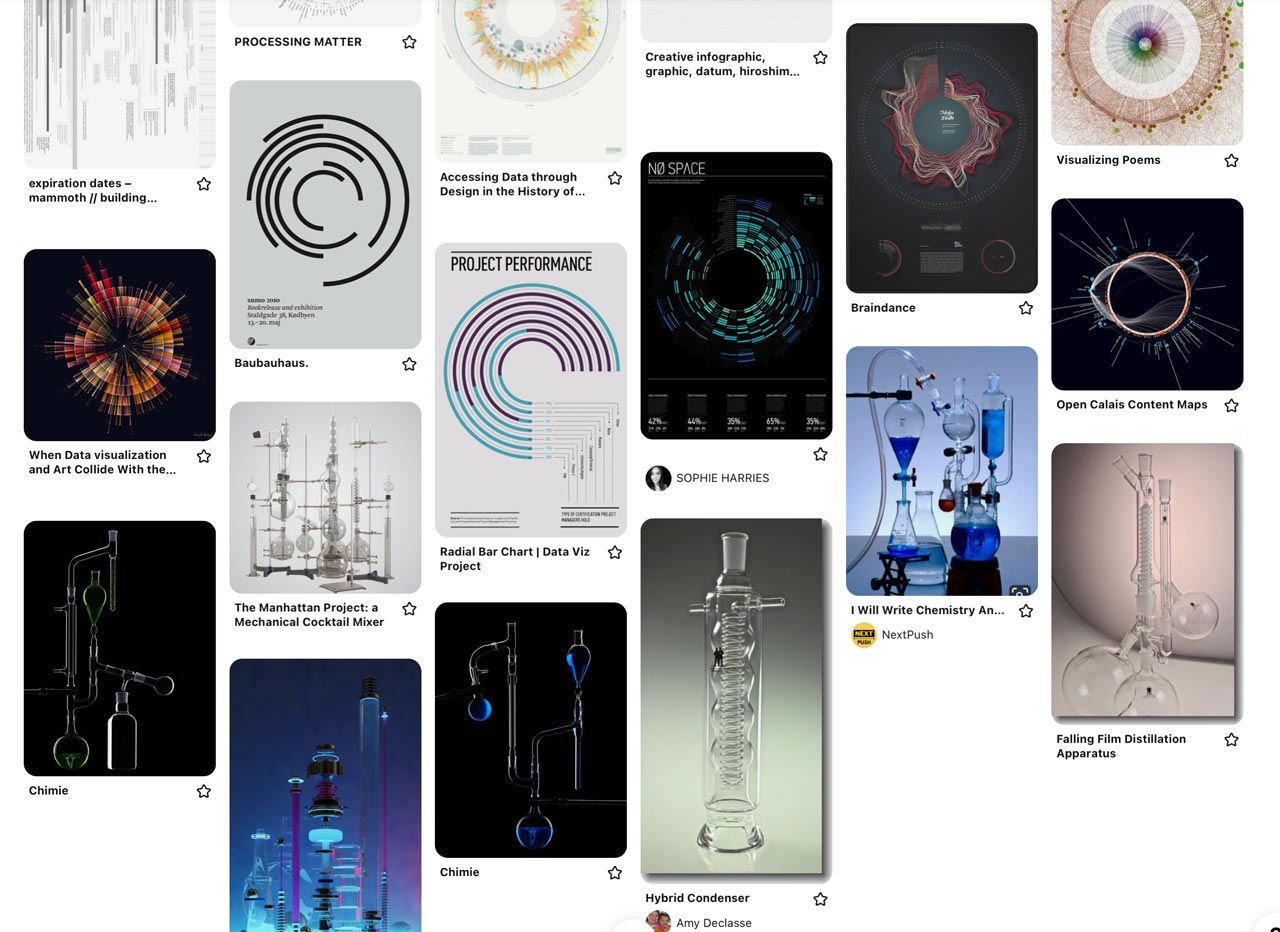
VISUAL REFERENCES
When I start a project I like to do a visual brainstorming, generate a moodboard of reference images that serve as an inspirational element for the formalization of the idea I intend to express.
Pinterest is a good image bank. In this link you can see the Esther Pizarro´s folder I have created for this purpose.