Week 12 Output Devices
Welcome to this page about output devices! In the summary below, you can jump directly to topics.
Summary
After electronics design and production, embedded programming and input devices, we move on to output devices this week. Examples of output devices include motors, all kinds of LED systems, displays, speakers and many other things.
Assignments
Group project:
- Measure the power consumption of an output device
- Document your work (in a group or individually)
Individual project:
- Add an output device to a microcontroller board you’ve designed and program it to do something
Learning outcomes:
- Demonstrate workflows used in sensing something with input device(s) and MCU board
Project management
This week’s planning:
| Spiral | Tasks | Time |
|---|---|---|
| 1 | Group assignment | 4 hours |
| 2 | Design PCB schematics | 14 hours |
| 3 | Mill PCB board | 2 hours |
| 4 | Soldering PCB board | 1 hour |
| 5 | Programming the board | 16 hours |
| 6 | Researching data sheets | 8 hours |
| 7 | Documentation | 8 hours |
Let’s get started!
This week’s results
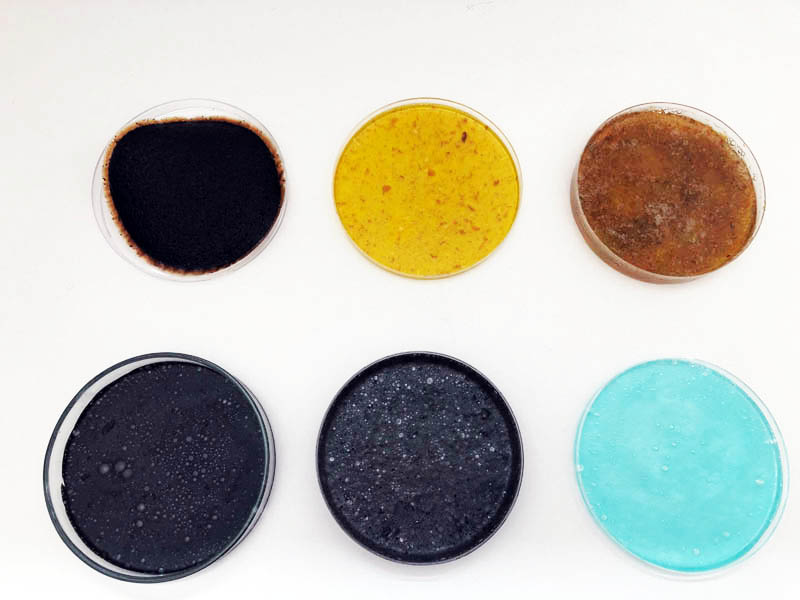
Carbon2Color is an output device that measures atmospheric carbon dioxide and visualizes this with LEDs, on an OLED display and/or on a NeoPixel ring. Here are the results of this week:
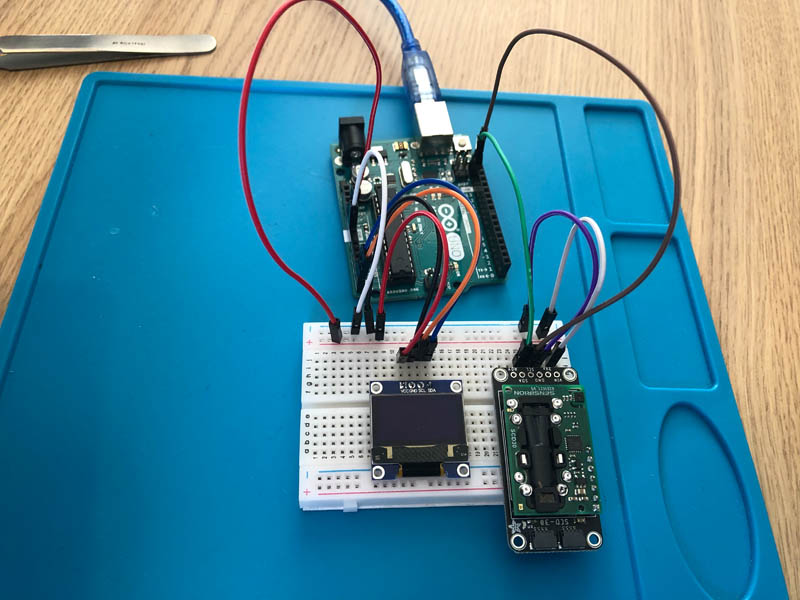
OLED display connected to my board over I2C.
Showing CO2 levels in ppm on OLED display.
First spiral: if data arrives, blink blue LED.
Blink red-yellow-green LED.
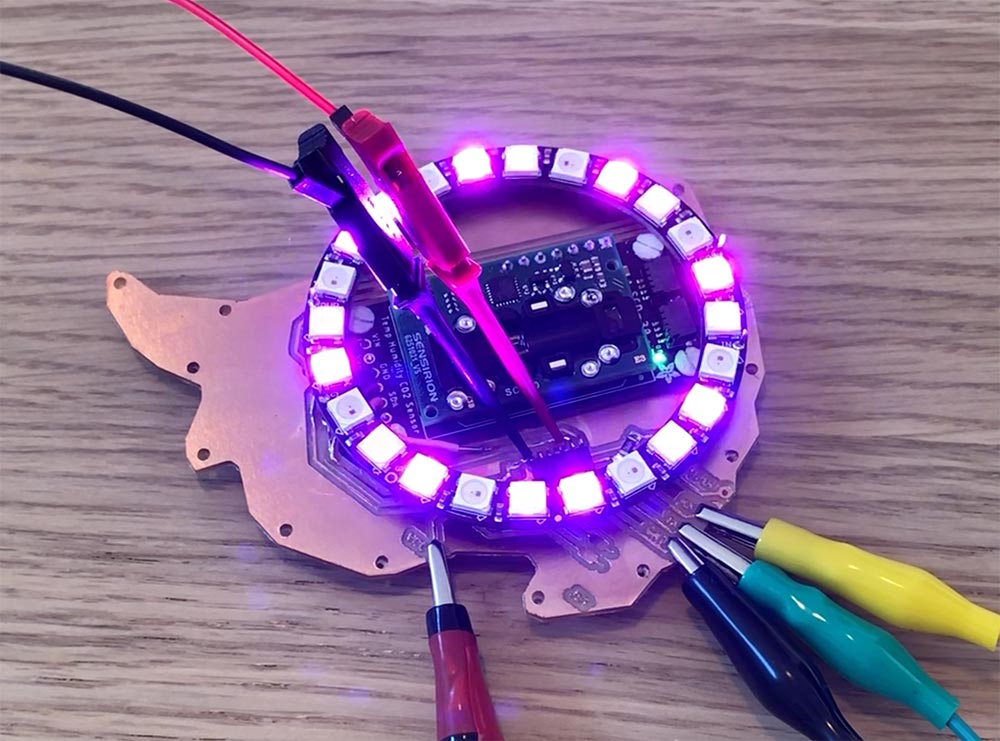
NeoPixel ring.
Carbon2Color working system: a CO2 level below 700ppm lights up the green LED, values in between 700-1000ppm turn on the orange LED, and above 1000ppm lights up the red LED.
Group assignment
Measure the power consumption of an output device. For example:
- NeoPixels
- Stepper motor
- ESP32 in deep sleep mode
- Boards from previous weeks
Power is measured in Watts; Power = Current x Voltage or P = IV
- In series
- Parallel
Analogy to water tank in this Sparkfun tutorial about Voltage, Current, Resistance and Ohm’s law.
- Water amount = Charge (Coulombs)
- Pressure = Voltage
- Water flow = Current (Ampere)
- Hose Width = Resistance
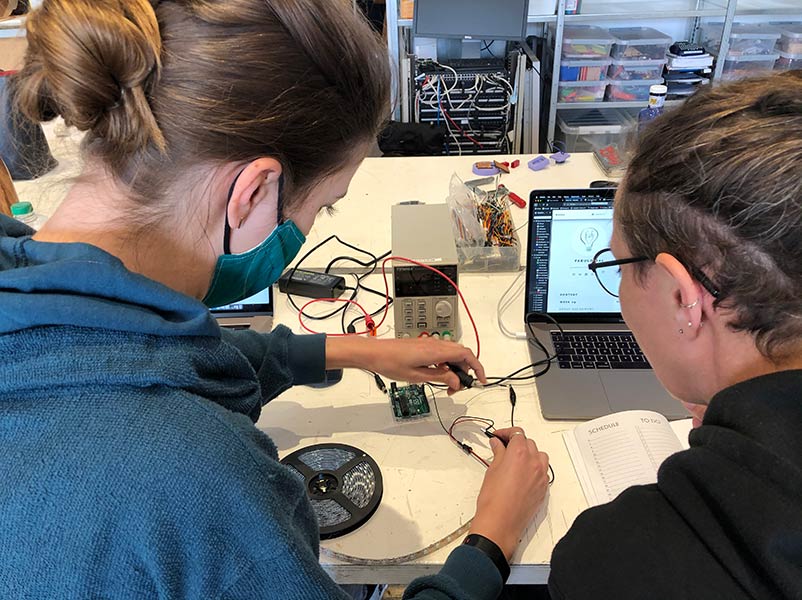
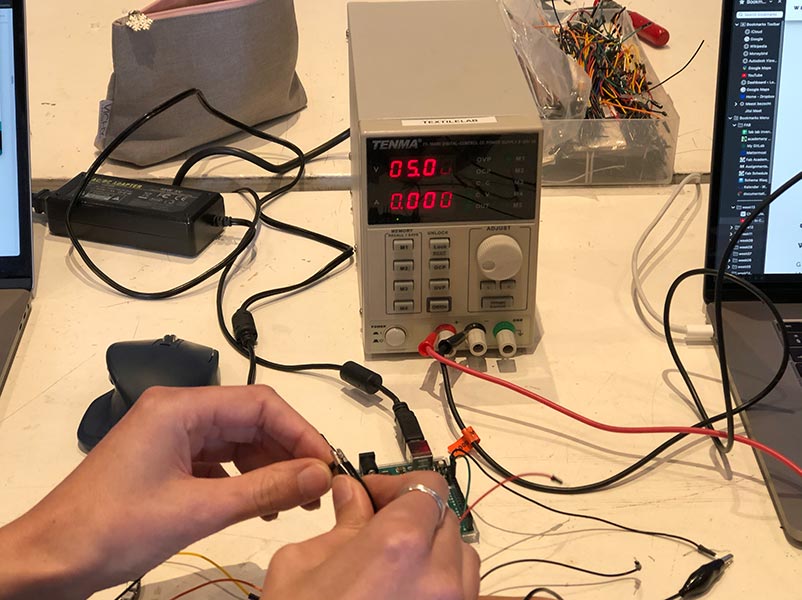
Power supply LED neopixel & led wire
Nadieh and Loes measured the Amperes of the LED NeoPixel wire.
Measurements for different types of light.
| Color | Volts | Ampere |
|---|---|---|
| White (Set) | 5 V | 0.8 A |
| White (Used) | 4.11 V | 0.8 A |
| Blue (Set) | 5 V | 0.8 A |
| Blue (Used) | 5 V | |
| Red (Set) | 5 V | 0.8 A |
| Red (Used) | 5 V | |
| Green (Set) | 5 V | 0.8 A |
| Green (Used) | 5 V |
Meanwhile I looked up the specs of the power supply. The one we have at Waag is the Tenma bench power supply (product link), the data sheet and the operating instructions. It is showing Voltage and Ampere. Its maximum Output Voltage is 30V and its maximum Output Current is 3A.
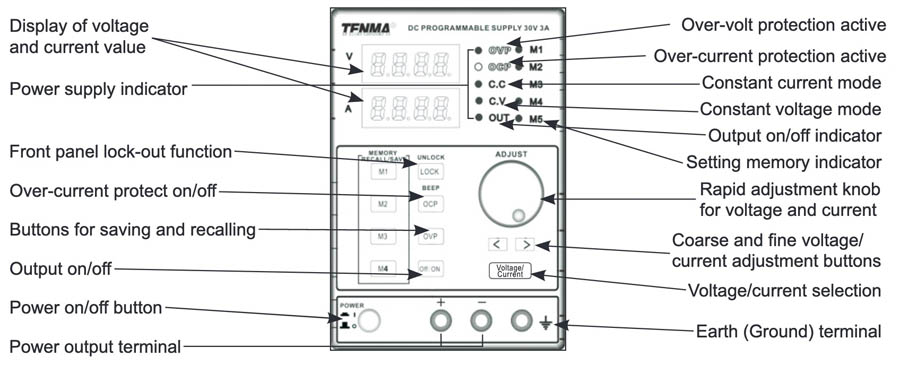
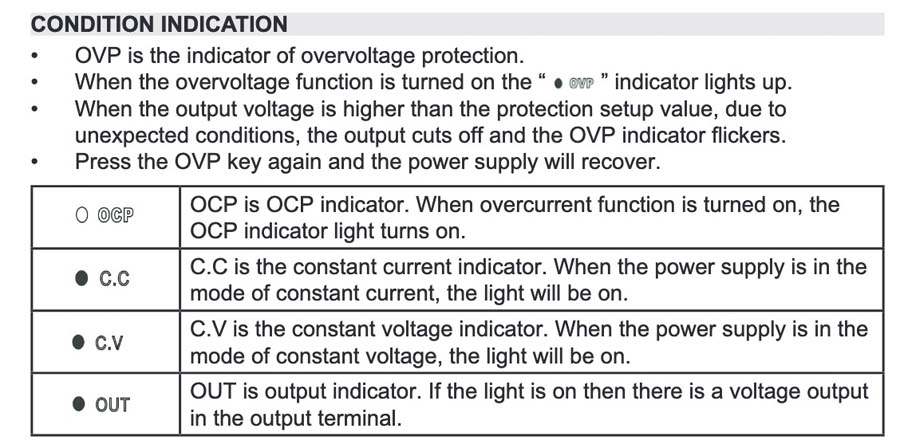
OVP is the indicator of overvoltage protection.
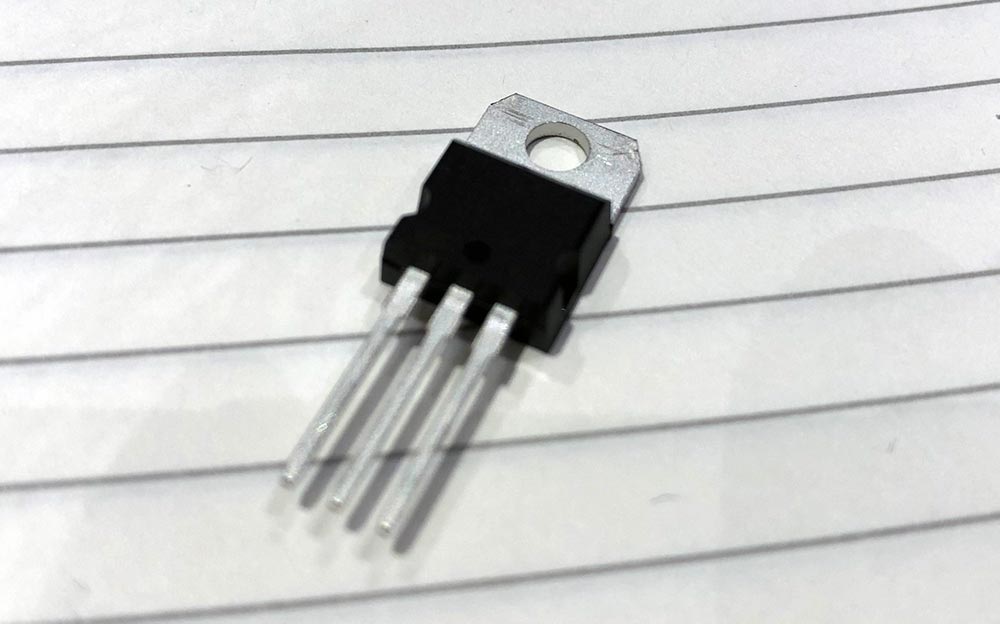
Voltage regulator
A voltage regulator is a system designed to automatically maintain a constant voltage (wikipedia). Voltage regulator to adjust voltage of 12V motor.
Example: ESP32 led dimmer circuit with alexa
Documentation: https://iotcircuithub.com/esp32-pwm-led-dimmer/
Level shifters
Adapter for 220V - 12V
Prototyping output devices with Arduino
My objective of this week is to create a modular environmental sensing system that matches at least two output devices to one or more input devices. The focus will be on visualizing environmental data in a variety of ways. For example, on a display, with LEDs, sound and/or movement.
Therefore, the reconfigurability of the board is important to me. Primarily because the device then becomes multifunctional. This saves material and is better for three principles of the circular economy: reduce, reuse and recycle. This ‘sensing hub’ is inspired on the Adrianino developed by Adrián Torres of FabLab León. He was also not satisfied with making a board for each sensor or actuator.
The input device I’m focussing on is a CO2 sensor, the Adafruit SCD-30 - NDIR CO2 Temperature and Humidity Sensor. Possible outputs to explore this week include:
- OLED display
- Neopixel LED ring
- Sound
- Stepper motor
Inspiration from a similar project: RGB Matrix Portal Room CO2 Monitor. The different types of output devices may require other options for power supplies, because they have other voltages. This adds complexity to this task. The spirals for prototyping on an Arduino are:
- Spiral 1: Test CO2 sensor
- Spiral 2: Test OLED display
- Spiral 3: Test NeoPixel ring
- Spiral 4: Arduino prototyping with OLED and CO2: read out CO2 levels on OLED display (10.30 am-14.30 pm = 2,5 hours)
- Spiral 5: Add NeoPixel ring to Arduino setup and visualize CO2 levels in colors (1-3 pm = 2 hours)
- Spiral 6: Add Stepper Motor to Arduino setup and actuate movement based on CO2 levels
After that, I can move on to define the design rules for KiCad design, mill it, solder it, program it.
CO2 sensor
Adafruit has a very nice guide for this sensor. The download page provides many resources and the data sheet provides detailed information about the sensor itself. A guide on how to place and install the sensor can be found here.
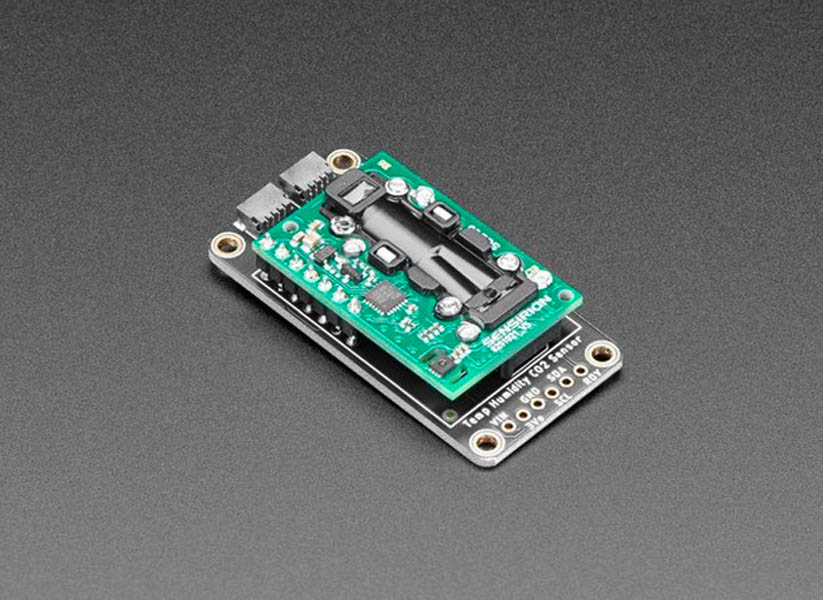
This NDIR CO2 sensor has 6 pins:
Power Pins
- VIN - this is the power pin. Since the sensor chip uses 3 VDC, we have included a voltage regulator on board that will take 3-5VDC and safely convert it down. To power the board, give it the same power as the logic level of your microcontroller - e.g. for a 5V microcontroller like Arduino, use 5V
- 3Vo - this is the 3.3V output from the voltage regulator, you can grab up to 100mA from this if you like
- GND - common ground for power and logic
I2C Logic Pins
- SCL - I2C clock pin, connect to your microcontroller I2C clock line. This pin is level shifted so you can use 3-5V logic, and there’s a 10K pullup on this pin.
- SDA - I2C data pin, connect to your microcontroller I2C data line. This pin is level shifted so you can use 3-5V logic, and there’s a 10K pullup on this pin.
- RST for reset.
And also STEMMA QT - These connectors allow you to connectors to dev boards with STEMMA QT connectors or to other things with various associated accessories.
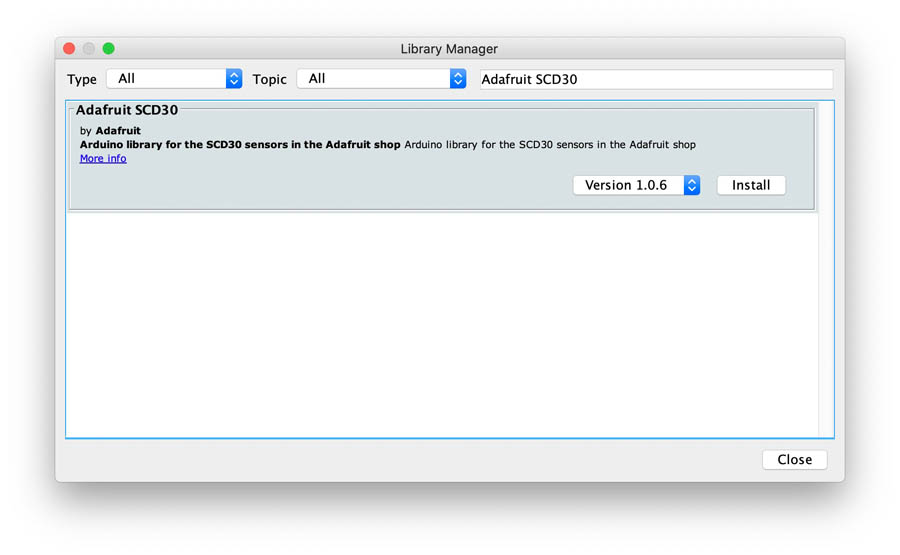
The first step is to install the library. To install, use the Arduino Library Manager and search for “Adafruit SCD30”.
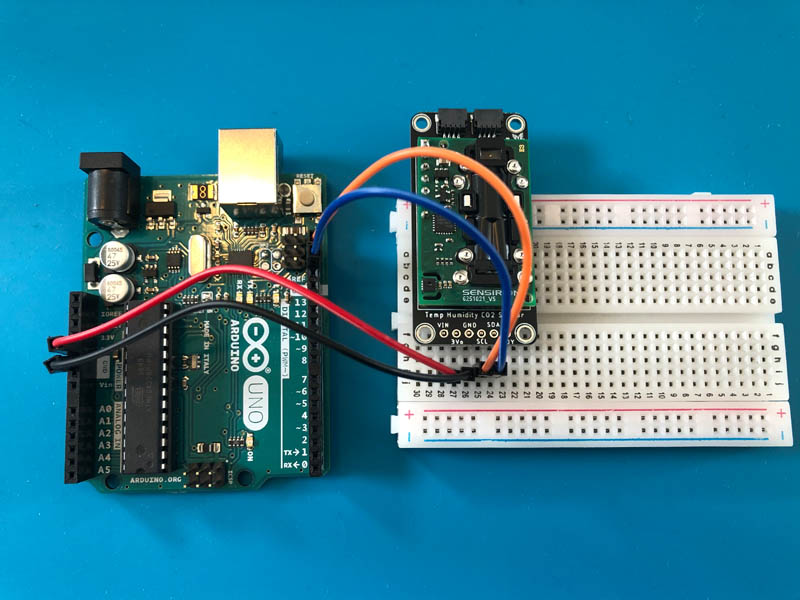
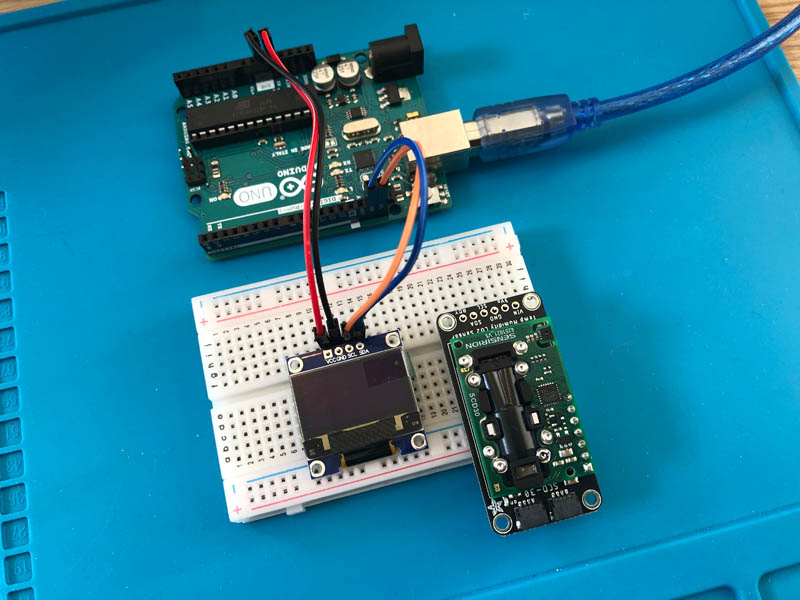
Connecting to Arduino should be done this way:
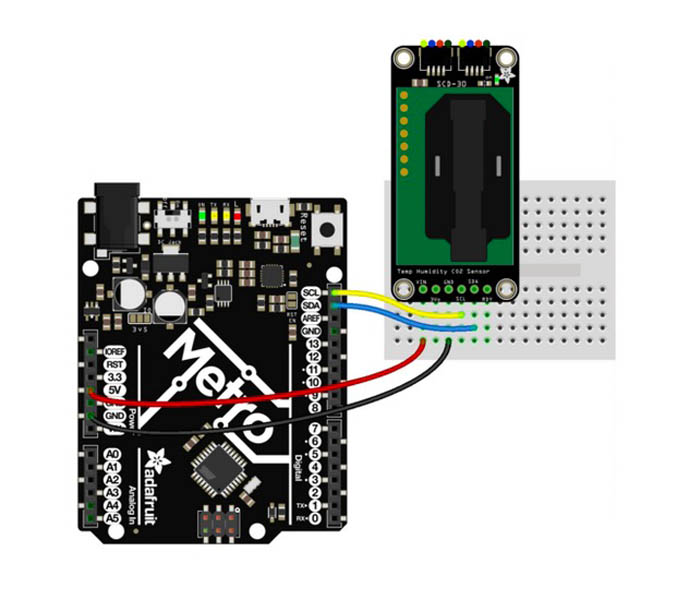
- Connect board VIN (red wire) to Arduino 5V if you are running a 5V board Arduino (Uno, etc.). If your board is 3V, connect to that instead.
- Connect board GND (black wire) to Arduino GND
- Connect board SCL (yellow wire) to Arduino SCL
- Connect board SDA (blue wire) to Arduino SDA
This is some additional information about the sensor from the data sheet.
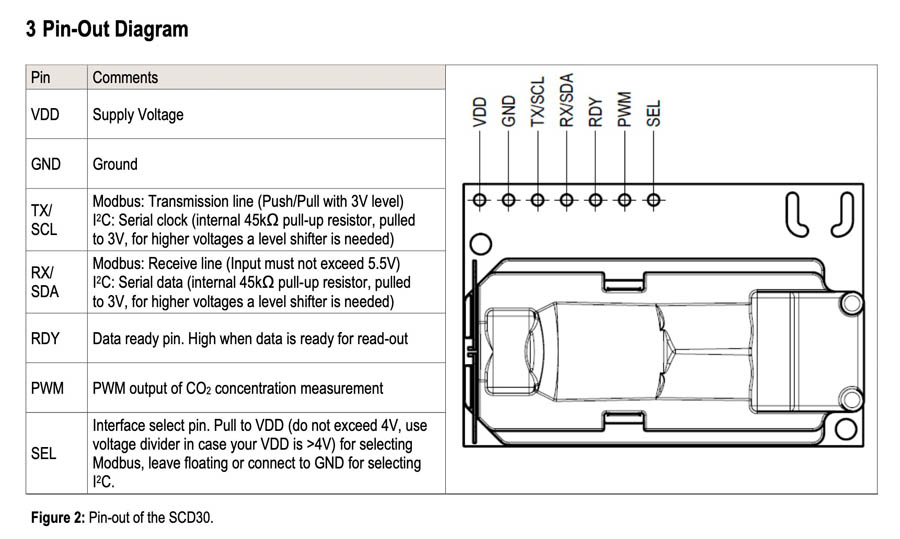
Photo of connected board:
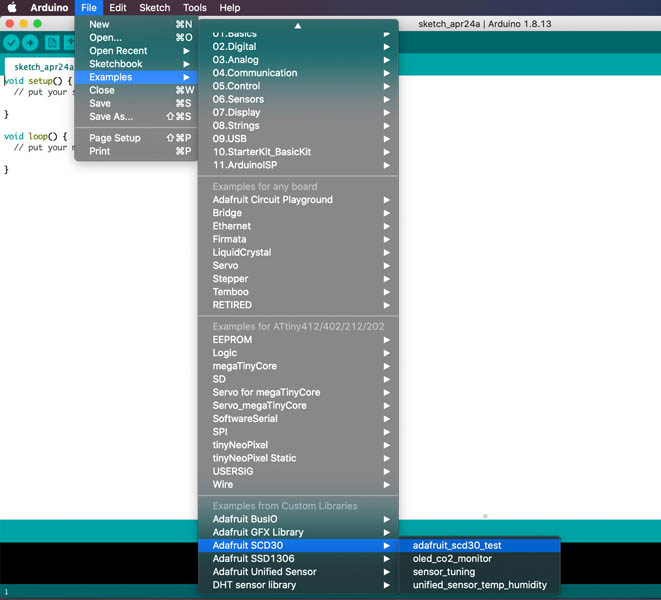
Open up File -> Examples -> Adafruit SCD30 -> adafruit_scd30_test
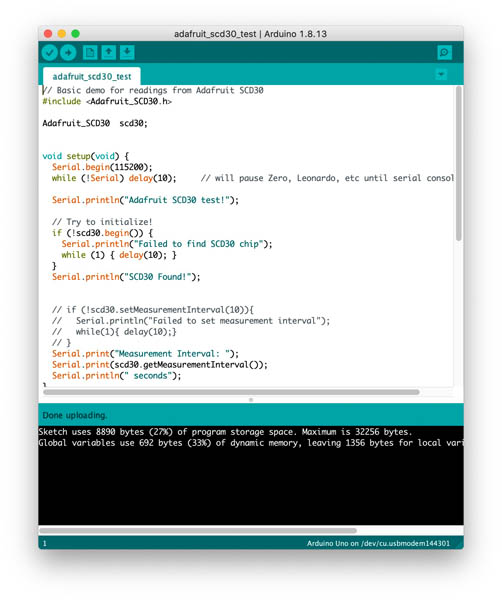
This is the code:
// Basic demo for readings from Adafruit SCD30
#include <Adafruit_SCD30.h>

Adafruit_SCD30  scd30;


void setup(void) {
  Serial.begin(115200);
  while (!Serial) delay(10);     // will pause Zero, Leonardo, etc until serial console opens

  Serial.println("Adafruit SCD30 test!");

  // Try to initialize!
  if (!scd30.begin()) {
    Serial.println("Failed to find SCD30 chip");
    while (1) { delay(10); }
  }
  Serial.println("SCD30 Found!");


  // if (!scd30.setMeasurementInterval(10)){
  //   Serial.println("Failed to set measurement interval");
  //   while(1){ delay(10);}
  // }
  Serial.print("Measurement Interval: ");
  Serial.print(scd30.getMeasurementInterval());
  Serial.println(" seconds");
}

void loop() {
  if (scd30.dataReady()){
    Serial.println("Data available!");

    if (!scd30.read()){ Serial.println("Error reading sensor data"); return; }

    Serial.print("Temperature: ");
    Serial.print(scd30.temperature);
    Serial.println(" degrees C");

    Serial.print("Relative Humidity: ");
    Serial.print(scd30.relative_humidity);
    Serial.println(" %");

    Serial.print("CO2: ");
    Serial.print(scd30.CO2, 3);
    Serial.println(" ppm");
    Serial.println("");
  } else {
    //Serial.println("No data");
  }

  delay(100);
}
After opening the demo file, upload to your Arduino wired up to the sensor.
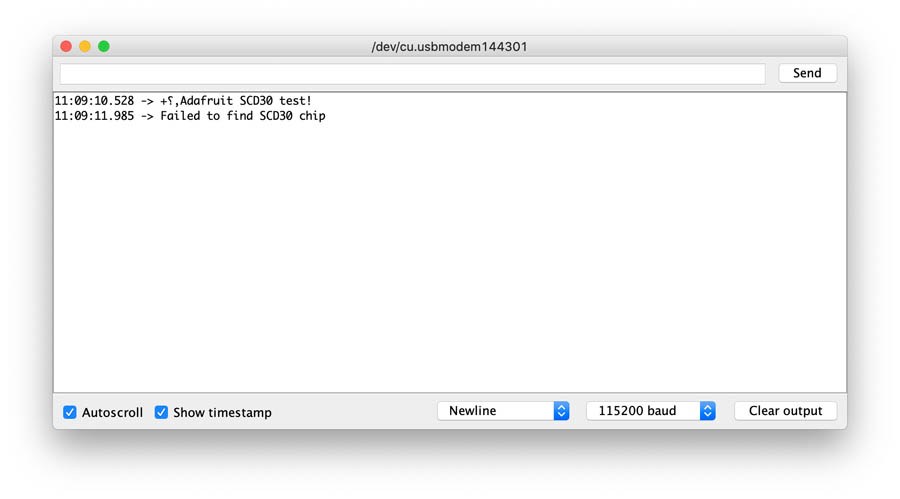
Once you upload the code, you will see the temperature, humidity and eCO2 data values being printed when you open the Serial Monitor (Tools->Serial Monitor) at 115200 baud. The first time failed, because the pins didn’t make a connection.
I held the pins it with my hand, and now they show results. In the video, you see how the orange LED in the sensor lights up.
In serial monitor, data is presented.
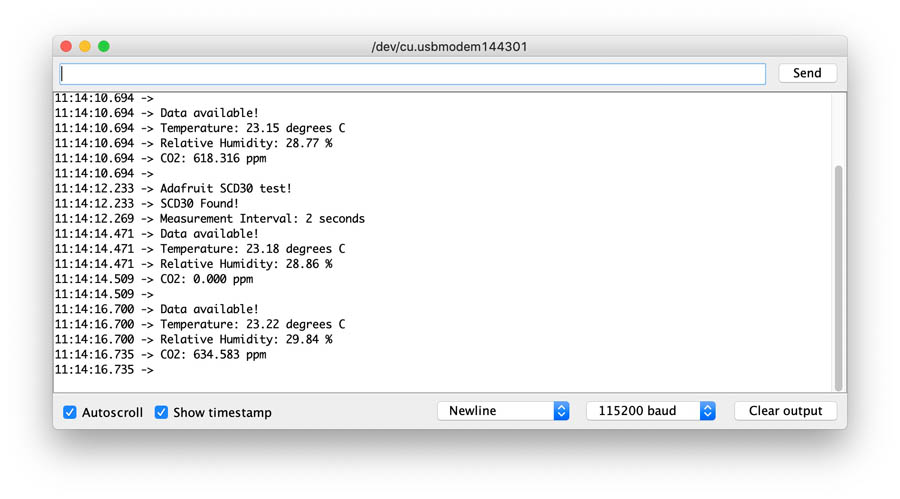
That works! I will solder the pins to the board, to make sure they connect. Next, let’s connect the OLED screen to the sensor.
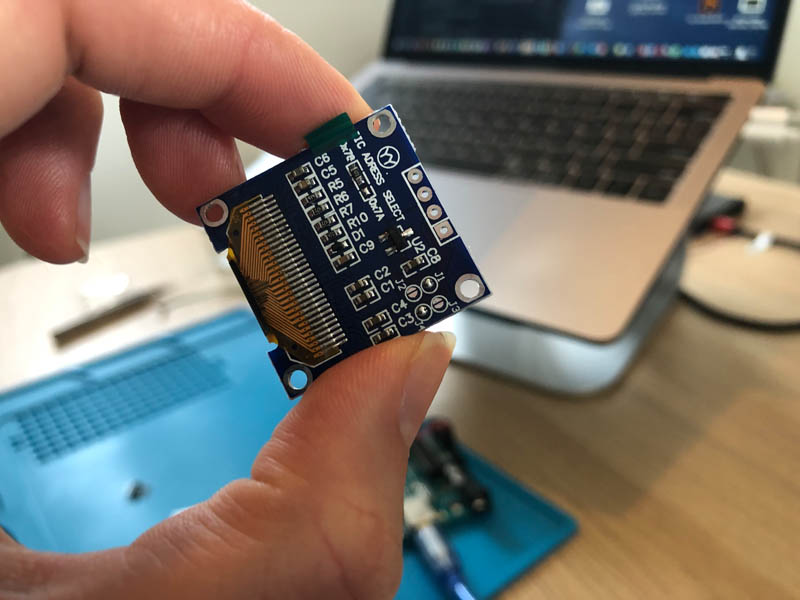
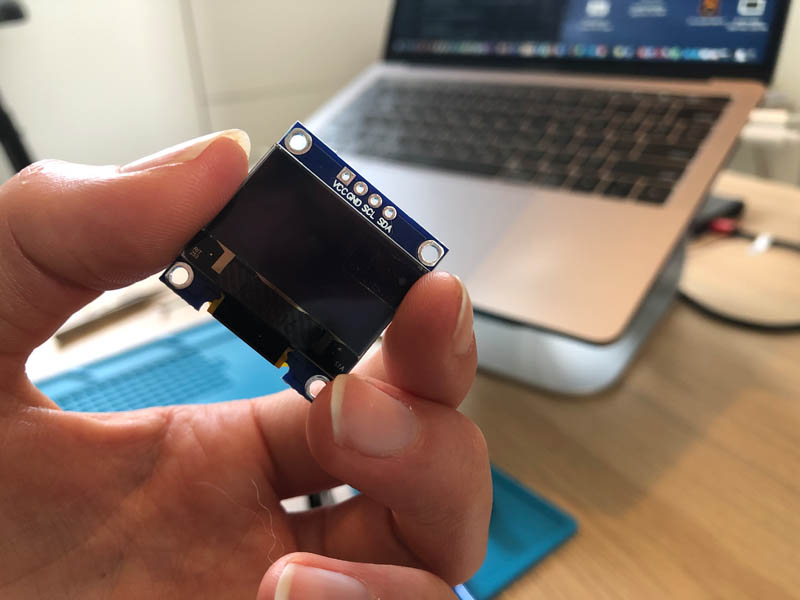
OLED display
The first spiral is to get an OLED working on an Arduino. The display has four pins: VCC, GND, SCL and SDA. I couldn’t find the exact data sheet on the Dutch Digikey website while searching for OLED 128x64 i2c ic spi mentioned on the box at Waag. This one from Amazon looks alike.
Here is a tutorial video for OLED Displays with Arduino - I2C & SPI OLEDs. This showed the following pinout:
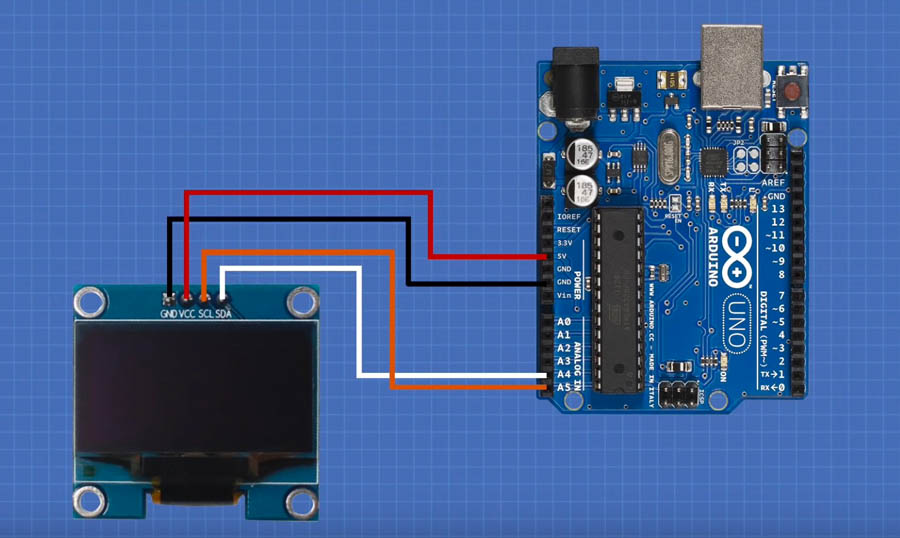
And this is how I wired it.
There is an SSD1306_128x64_i2c coding example in the Adafruit SSD1306 example library. When I loaded it, nothing happened. So the first thing I did is to check the hardware. Because this was my first time, I soldered the pins on the board with guidance of a How To - Solder Pin Headers to an Arduino Pro Mini tutorial. Next, I tried uploading the program again. The OLED still didn’t do a single thing. Based on the instruction video, I checked the Screen Address in the code and changed this: #define SCREEN_ADDRESS 0x3C instead of 0x3D. This worked!
NeoPixels
To visualize the CO2 values I’m planning to work with NeoPixels. This comes in many varieties, including strips, and single rings with individually addressable RGB LEDs. For this assignment, I’m going for the NeoPixel Ring - 24 x 5050 RGB LED with Integrated Drivers.
Each one has ~18mA constant current drive so the color will be very consistent even if the voltage varies
The Adafruit NeoPixel Überguide refers to Best Practices, with important instructions:
Before connecting NeoPixels to any large power source (DC “wall wart” or even a large battery), add a capacitor (1000 µF, 6.3V or higher) across the + and – terminals as shown above. The capacitor buffers sudden changes in the current drawn by the strip.
Let’s dive more into powering NeoPixels.
Estimating power requirements: Each individual NeoPixel draws up to 60 milliamps at maximum brightness white (red + green + blue). To estimate power supply needs, multiply the number of pixels by 20, then divide the result by 1,000 for the “rule of thumb” power supply rating in Amps. Or use 60 (instead of 20) if you want to guarantee an absolute margin of safety for all situations. For example: 60 NeoPixels × 20 mA ÷ 1,000 = 1.2 Amps minimum. 60 NeoPixels × 60 mA ÷ 1,000 = 3.6 Amps minimum. The choice of “overhead” in your power supply is up to you.
For the ring, this will be:
24 NeoPixels × 60 mA ÷ 1,000 = 1.44 Amps minimum
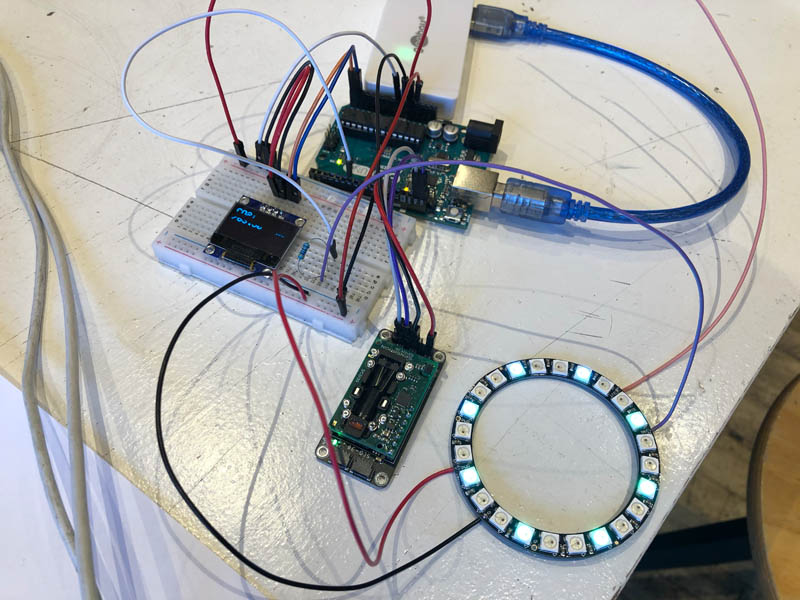
Start with installing the Adafruit NeoPixel library and wire it according to the example. Then load the Strandtest code. This works!
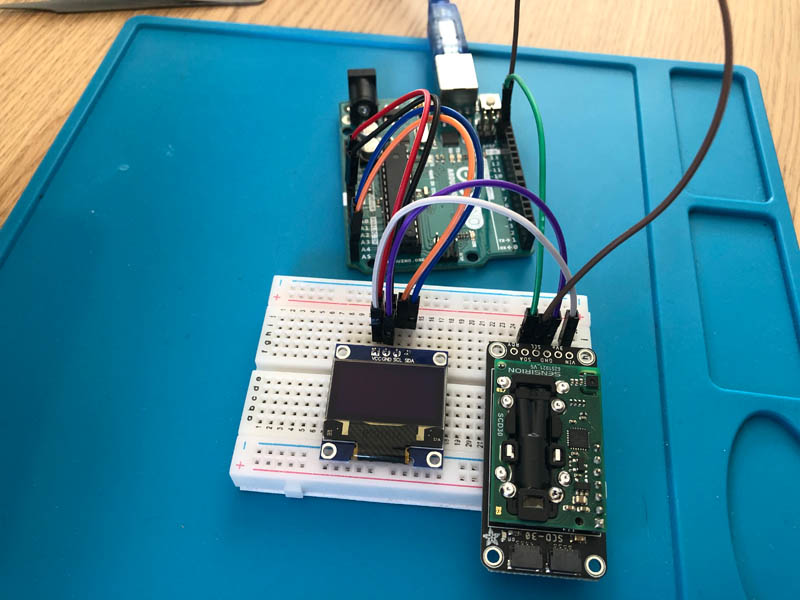
CO2 sensor on OLED display
Now let’s connect this OLED display to the CO2, temperature and humidity sensor. In the video, there is an example wiring scheme with a temperature and humidity sensor. Here, the sensor is connected in series with the display.
Wiring scheme.
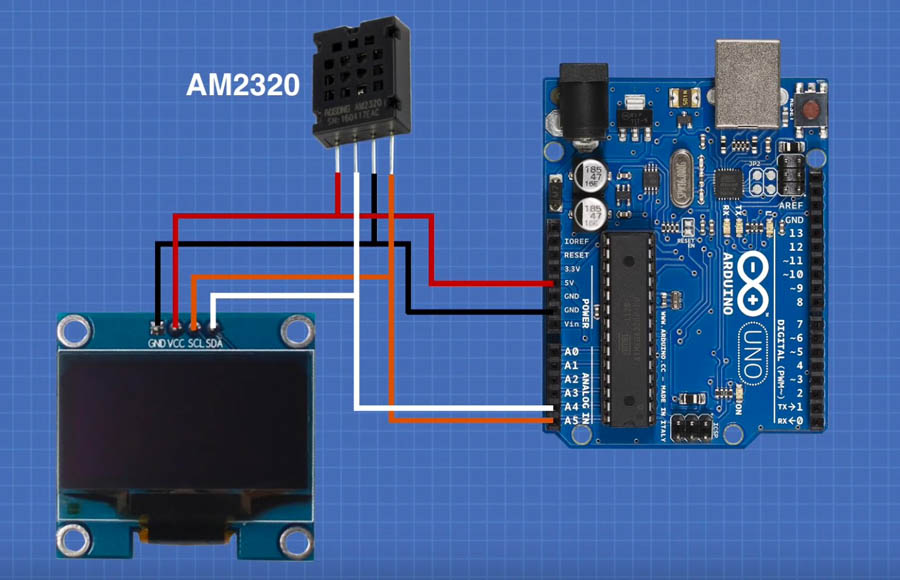
Two ways to wire:
There is a code example for this in the Adafruit SCD30 library (see below). This indicates that we need the Adafruit SSD1306 library. That was already installed during installation of SCD30.
Changes: Adafruit_SSD1306 display = Adafruit_SSD1306(128, 32, &Wire); to (128, 64, &Wire).
// A simple CO2 meter using the Adafruit SCD30 breakout and the Adafruit 128x32 OLEDs
#include <Adafruit_SCD30.h>
#include <Adafruit_SSD1306.h>

Adafruit_SCD30  scd30;
Adafruit_SSD1306 display = Adafruit_SSD1306(128, 32, &Wire);

void setup(void) {
  Serial.begin(115200);
  while (!Serial) delay(10);     // will pause Zero, Leonardo, etc until serial console opens

  Serial.println("SCD30 OLED CO2 meter!");

  // Try to initialize!
  if (!scd30.begin()) {
    Serial.println("Failed to find SCD30 chip");
    while (1) { delay(10); }
  }
  Serial.println("SCD30 Found!");


  // SSD1306_SWITCHCAPVCC = generate display voltage from 3.3V internally
  if(!display.begin(SSD1306_SWITCHCAPVCC, 0x3C)) { // Address 0x3C for 128x32
    Serial.println(F("SSD1306 allocation failed"));
    for(;;); // Don't proceed, loop forever
  }

  if (!scd30.setMeasurementInterval(2)){
    Serial.println("Failed to set measurement interval");
    while(1) {delay(10);}
  }
  Serial.print("Measurement Interval: ");
  Serial.print(scd30.getMeasurementInterval());
  Serial.println(" seconds");

  display.display();
  delay(500); // Pause for half second

  display.setTextSize(2);
  display.setTextColor(WHITE);
  display.setRotation(0);
}


void loop() {
  if (scd30.dataReady()) {
    display.clearDisplay();
    display.setCursor(0,0);
    display.setTextSize(2);

    Serial.println("Data available!");

    if (!scd30.read()){
      Serial.println("Error reading sensor data");
      display.println("READ ERR");
      display.display();
      return;
    }

    Serial.print("CO2: ");
    Serial.print(scd30.CO2, 3);
    Serial.println(" ppm");
    Serial.println("");

    display.println("CO2:");
    display.print(scd30.CO2, 2);

    display.setTextSize(1);

    display.setCursor(100, 20);
    display.println(" ppm");
    display.display();
  }

  delay(100);
}
And the working program.
First spiral done!
Animations on OLED display
Here is a cool tutorial video to define bitmaps on screen video.
PCB design and fabrication
With a clear end-goal in mind, of creating the possibility to connect at least two different output devices to visualize the data of one input device, we can now reverse-engineer the board.
Design requirements
The following components should be on the board:
- Button
- LED
- UPDI (programming)
- FTDI or other way (power)
- SCL - CO2 sensor
- SDA - CO2 sensor
- SCL - Display OLED
- SDA - Display OLED
- NeoPixel - IN
- GND
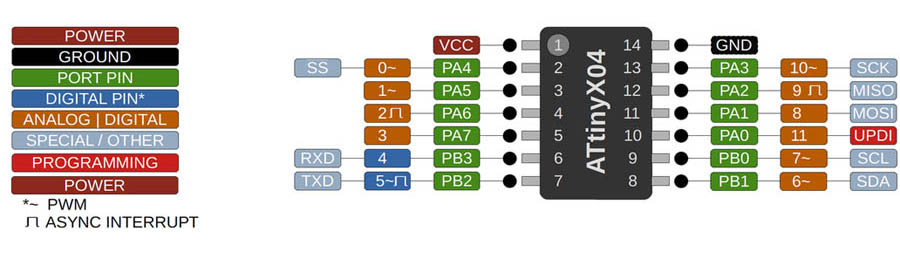
This means that there are not enough pins on an ATtiny412. I will use an ATtiny1614 instead. This is the pinout:
Power supply requirements:
- laptop
- battery (portable)
- 220 volts with adapter (round pin)
For many wearable projects we recommend a lithium-polymer battery. These deliver 3.7 Volts — perfect for directly feeding low-power microcontrollers such as the Adafruit Flora, yet enough voltage to run a short length of NeoPixels.
Output
- NeoPixels: 5V 1.44 amps
- CO2 sensor: 5V or 3.3V
- OLED display: 5V
- Sound:
- Stepper motor: 12V
Global Open Time
Questions for Global Open Time:
- Power supply: 2 options: 12V, 5V, 3V
- Connection of CO2 sensor: Stemma QT connectors or pins soldering? How to do this on the arduino? Pins don’t connect.
- Type of microcontroller, ATTiny412 or ATtiny1614.
One input (possible to do 2), 3 outputs (OLED display, LED ring - more with NeoPixel Flora, stepper motor).
Power supply requirements:
- laptop
- battery (portable)
- 220 volts with adapter (round pin)
Power supply
Antti Rytilahti to Everyone (4:11 PM): I suggest usb for powering. Can be powered from laptop, portable power bank or wall outlet via phone charger. As if your device acted like a cell phone in charging. You plug the usb-a connector to power adapter or power bank and micro/mini/c connector to phone, or in this case your device.
Walter Lenigan to Everyone (4:38 PM) USB-C could be the better option Nicole. You could deliver more power.
Antti Rytilahti to Everyone (4:41 PM) Great Scott has YouTube video about usb-c, quite technical video though, but maybe it has some useful ideas you could utilize with help from instructors.
Pablo Fab Lab Leon to Everyone (4:42 PM) @Antti As i understand, USB connector just carry 5V isnt it? Just to keep in mind in case you use motors :)
Antti Rytilahti to Everyone (4:42 PM) https://www.youtube.com/watch?v=OwAZqJ4wpJg @Pablo, mostly yes. Unless power adapter or power bank uses USB Power Delivery that can provide up to 20 volts and 5 Amps. With anything related to USB-C I would recommend to use modules. Even with just the connector.
Antti Rytilahti to Everyone (4:47 PM) https://www.digikey.fi/product-detail/fi/adafruit-industries-llc/4090/1528-2873-ND/9951930
About batteries:
- Adafruit tutorial on batteries
- Adafruit on powering neopixels
- Lithium ion polymer for wearable https://www.adafruit.com/product/328
I2C During the session Adrian mentioned that it is not possible to add both the CO2 sensor and the OLED to the ATtiny board. The reason is that both rely on IC2 communication and there is only place for one I2C connection on the ATtiny. On Arduino, this works because the SCL and SDA of the OLED can be added to analog pins A4 and A5. Apparently this is not possible on the ATtiny. That’s a major setback!
A way to move around this is to create a master/secondary or teacher/student board configuration. Adrian showed an example of a I2C serial bus board on the page for next week’s assignment on Networking and Communications. He also made a drawing of the concept, see below.
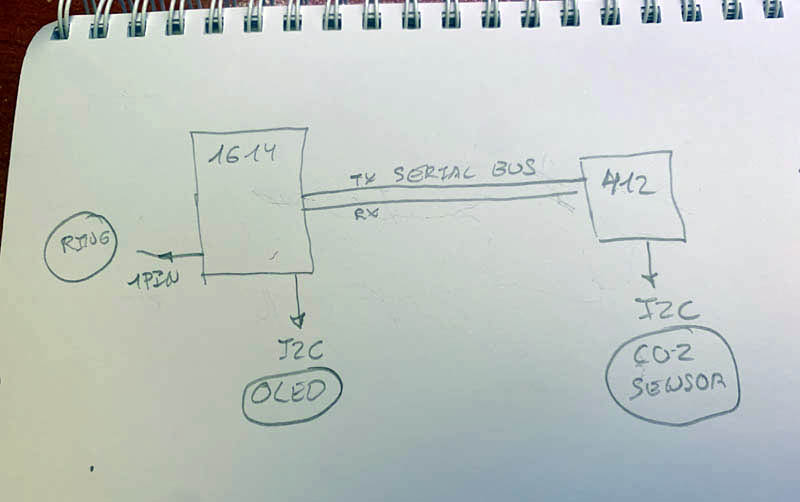
It was great to get a brief introduction, this will certainly make next week’s lecture and project a bit easier to understand. After a nice walk in nature I decided to make a version of the Adrianino board for this week, and connect the CO2 sensor with the neopixel ring on this. Perhaps I’ll make a 12V connection instead of 9V, for a future motor. Then do the I2C connection of the two devices next week. To get started, this is a Sparkfun tutorial on I2C.
KiCad Design
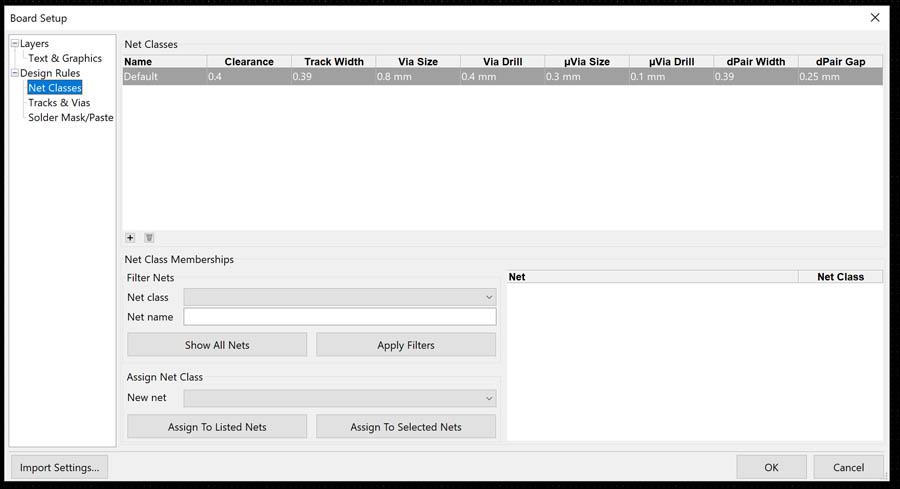
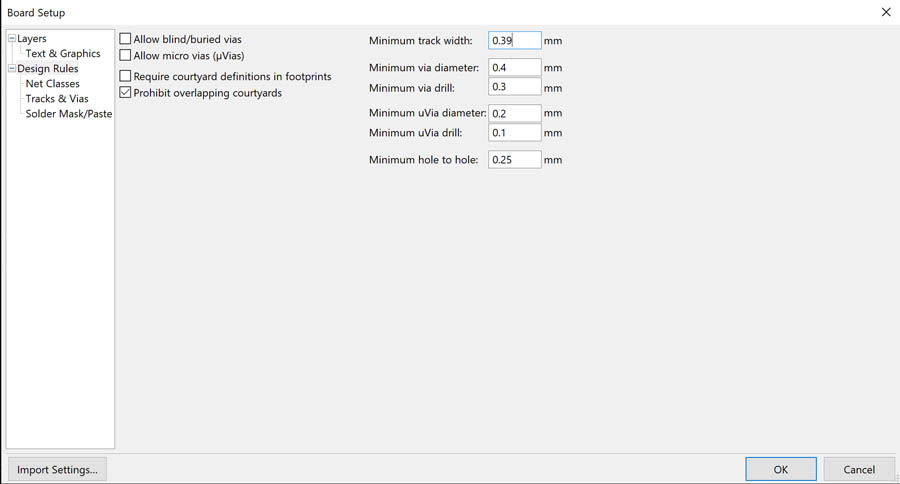
After the session, I made the schematics of my board in KiCad. First, start with the design rules of the Net Classes.
And also set the Design Rules.
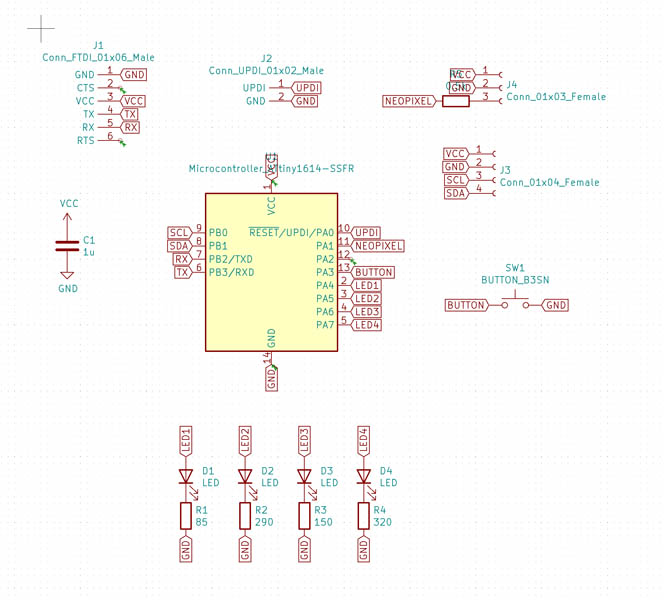
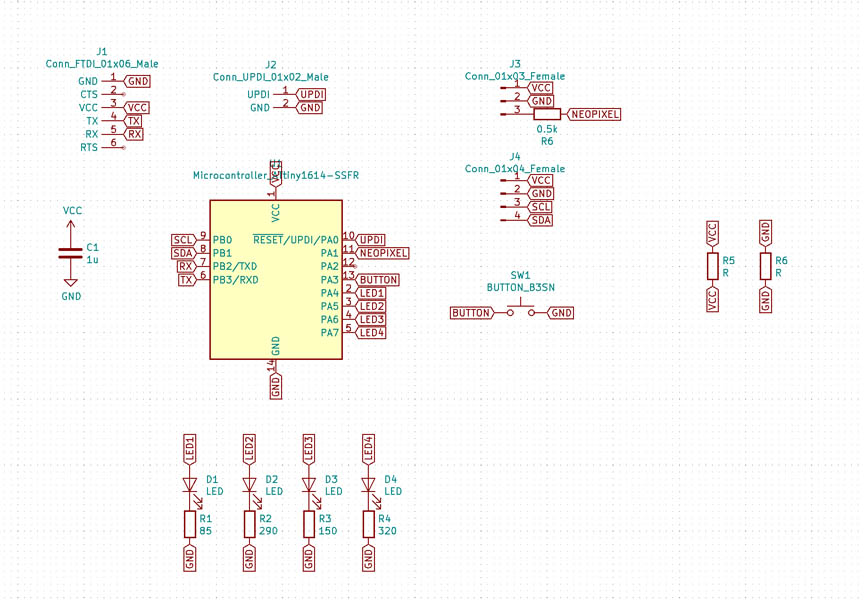
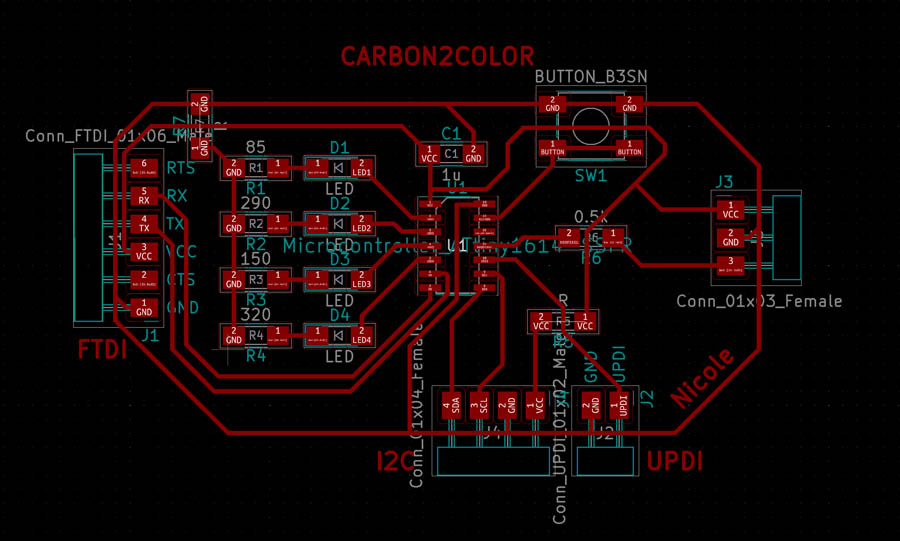
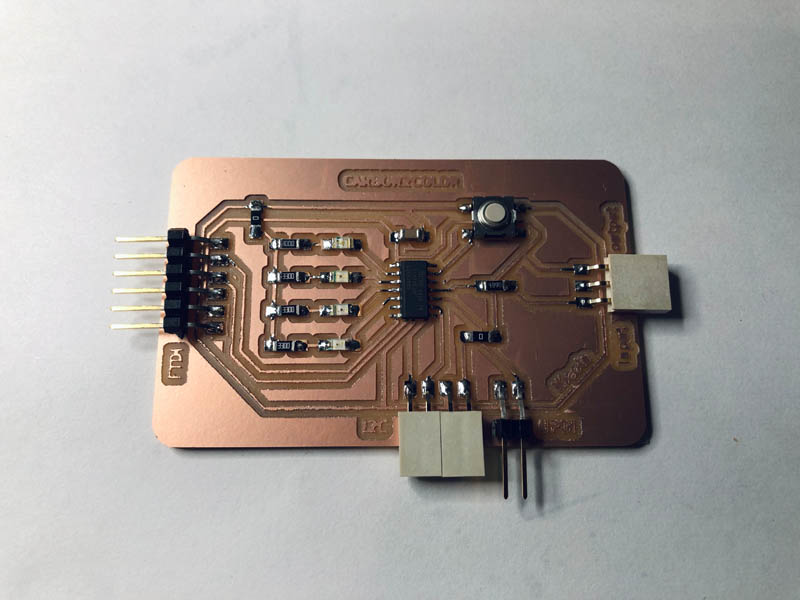
The design of the schematics. I added four LEDs to indicate the CO2 levels on the board.
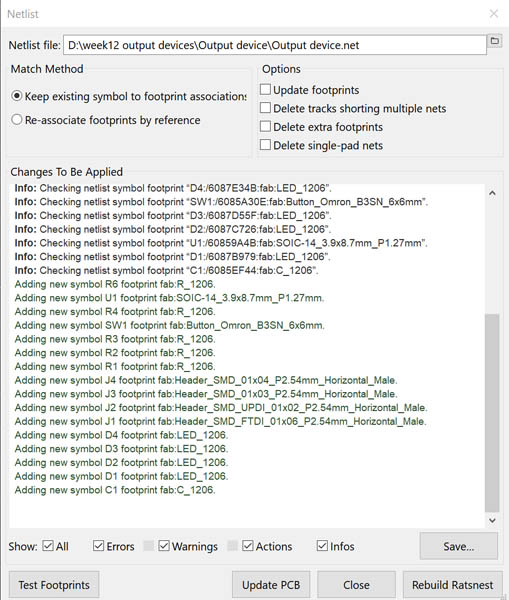
On Monday morning, I checked this and discussed the process with Henk. All was well, so I moved on to the next step: the ratsnest. Unfortunately some footprints were not recognized.
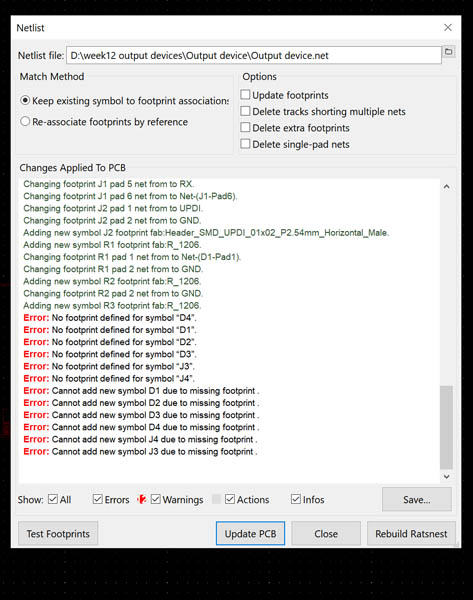
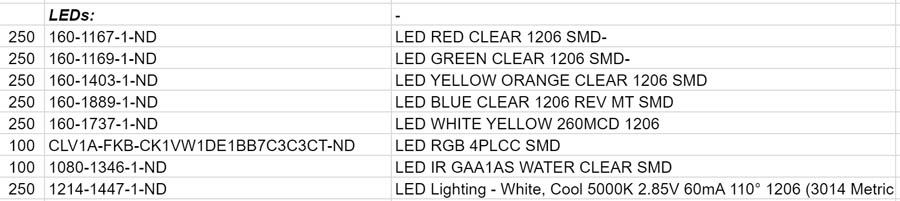
It turned out that some LEDs were missing, and the female connectors.
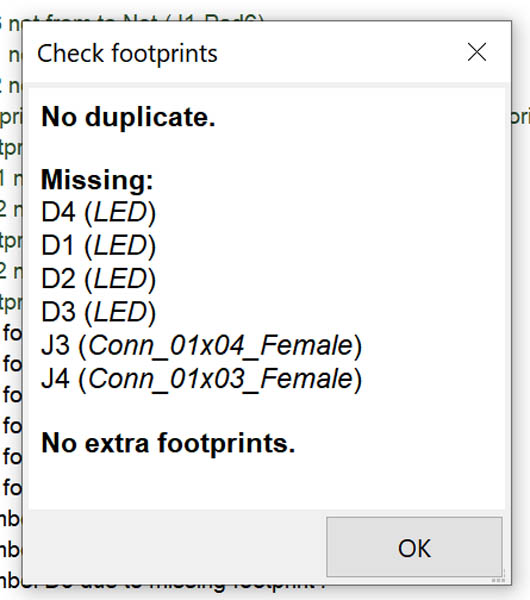
I looked up the numbers in the Fab Inventory. Relinking them instead of the standard LED from the standard library worked.
Then the two female connectors still couldn’t be assigned.
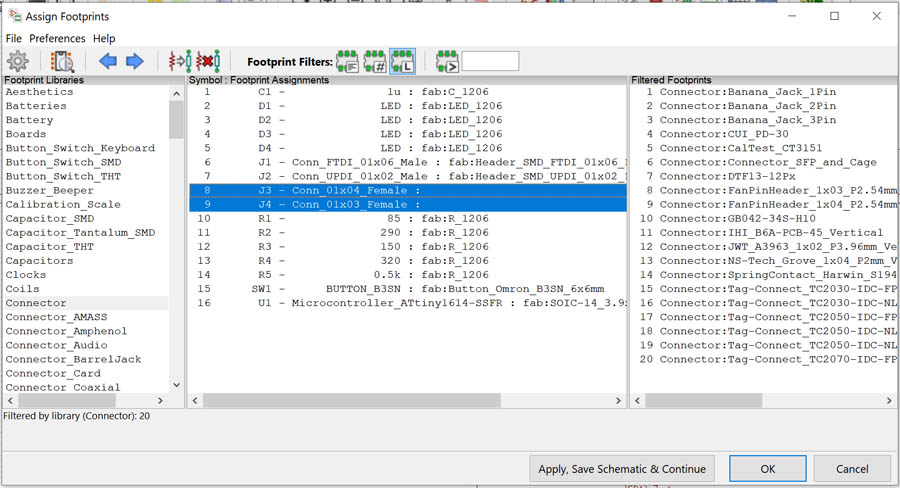
Since the male/female connectors create the same trace on the pcb, I decided to insert the male connector from the fab inventory.
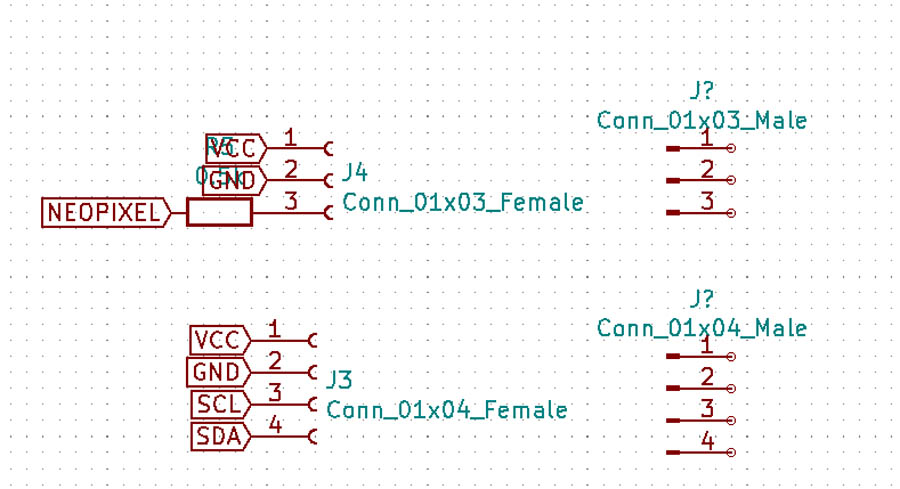
This is with the flags reconnected.
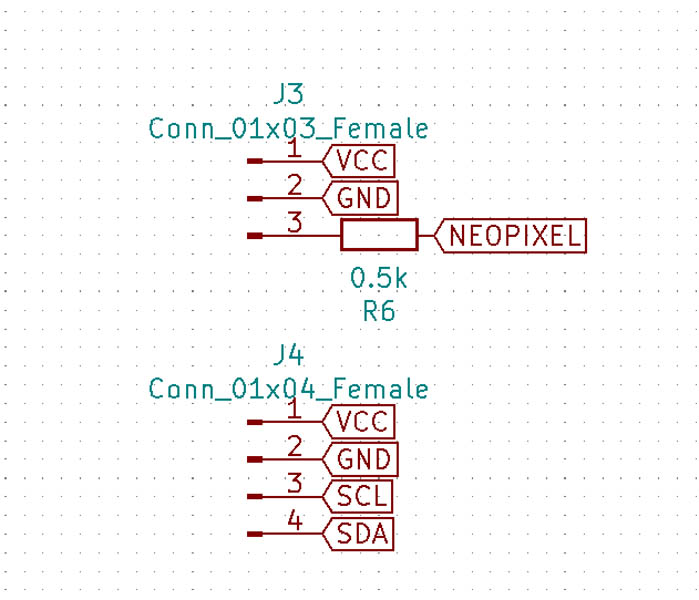
Now it all works.
The final Eeschema design. Four LEDs are included: a blue one for testing the board, and yellow-orange-red ones for indicating ranges of CO2 levels.
Exporting this to PCB Layout for routing the components.
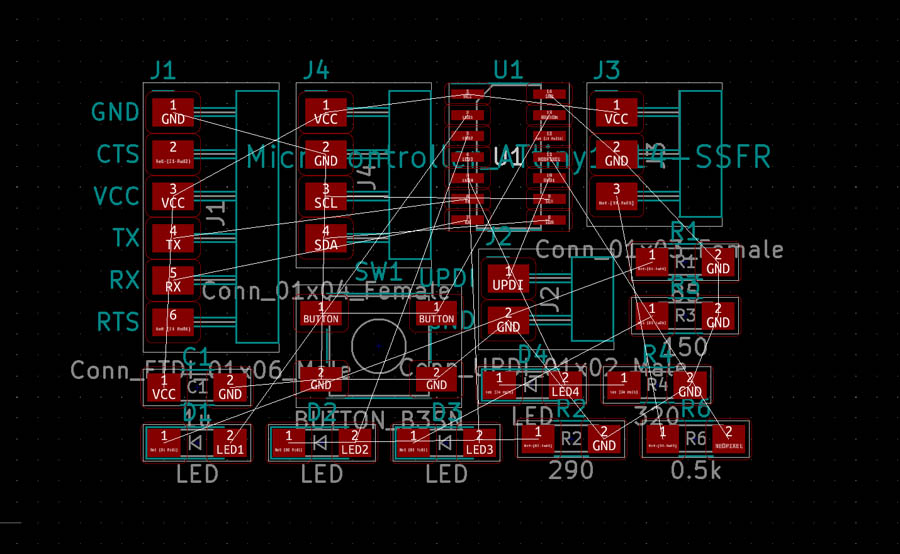
I learned something cool this week: it is possible to make bridges with resistors that have a 0 value.
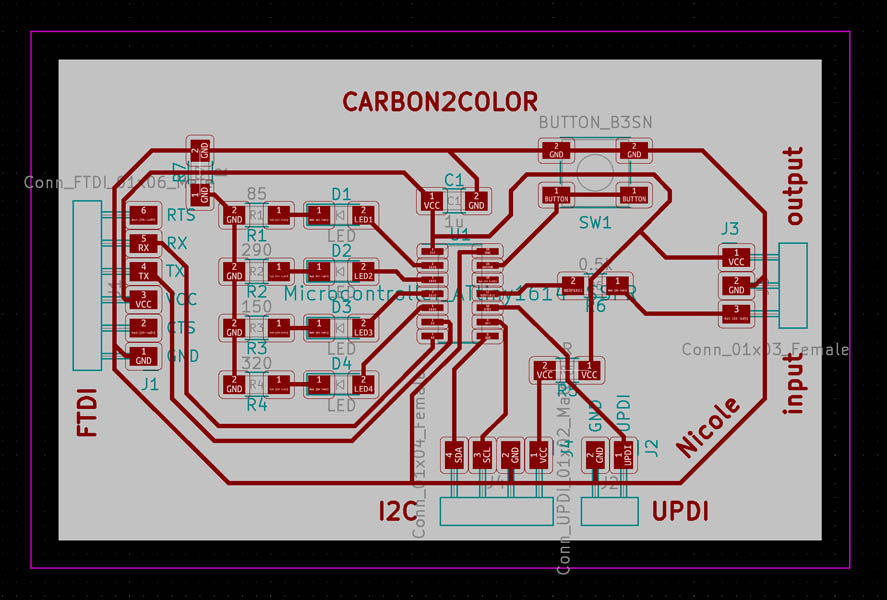
Final wiring in the PCB Layout.
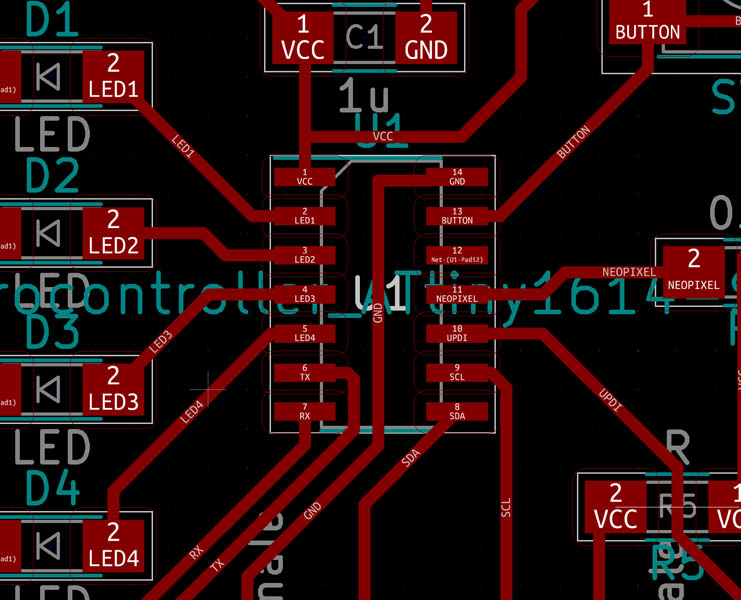
A close-up of the ATtiny1614.
Adding the outline and a margin before exporting the .svg.
Illustrator
In Illustrator, post-process the .svg files to 1000 dpi .png files. I added round corners to the interior with Effect > Stylize > Round Corners.

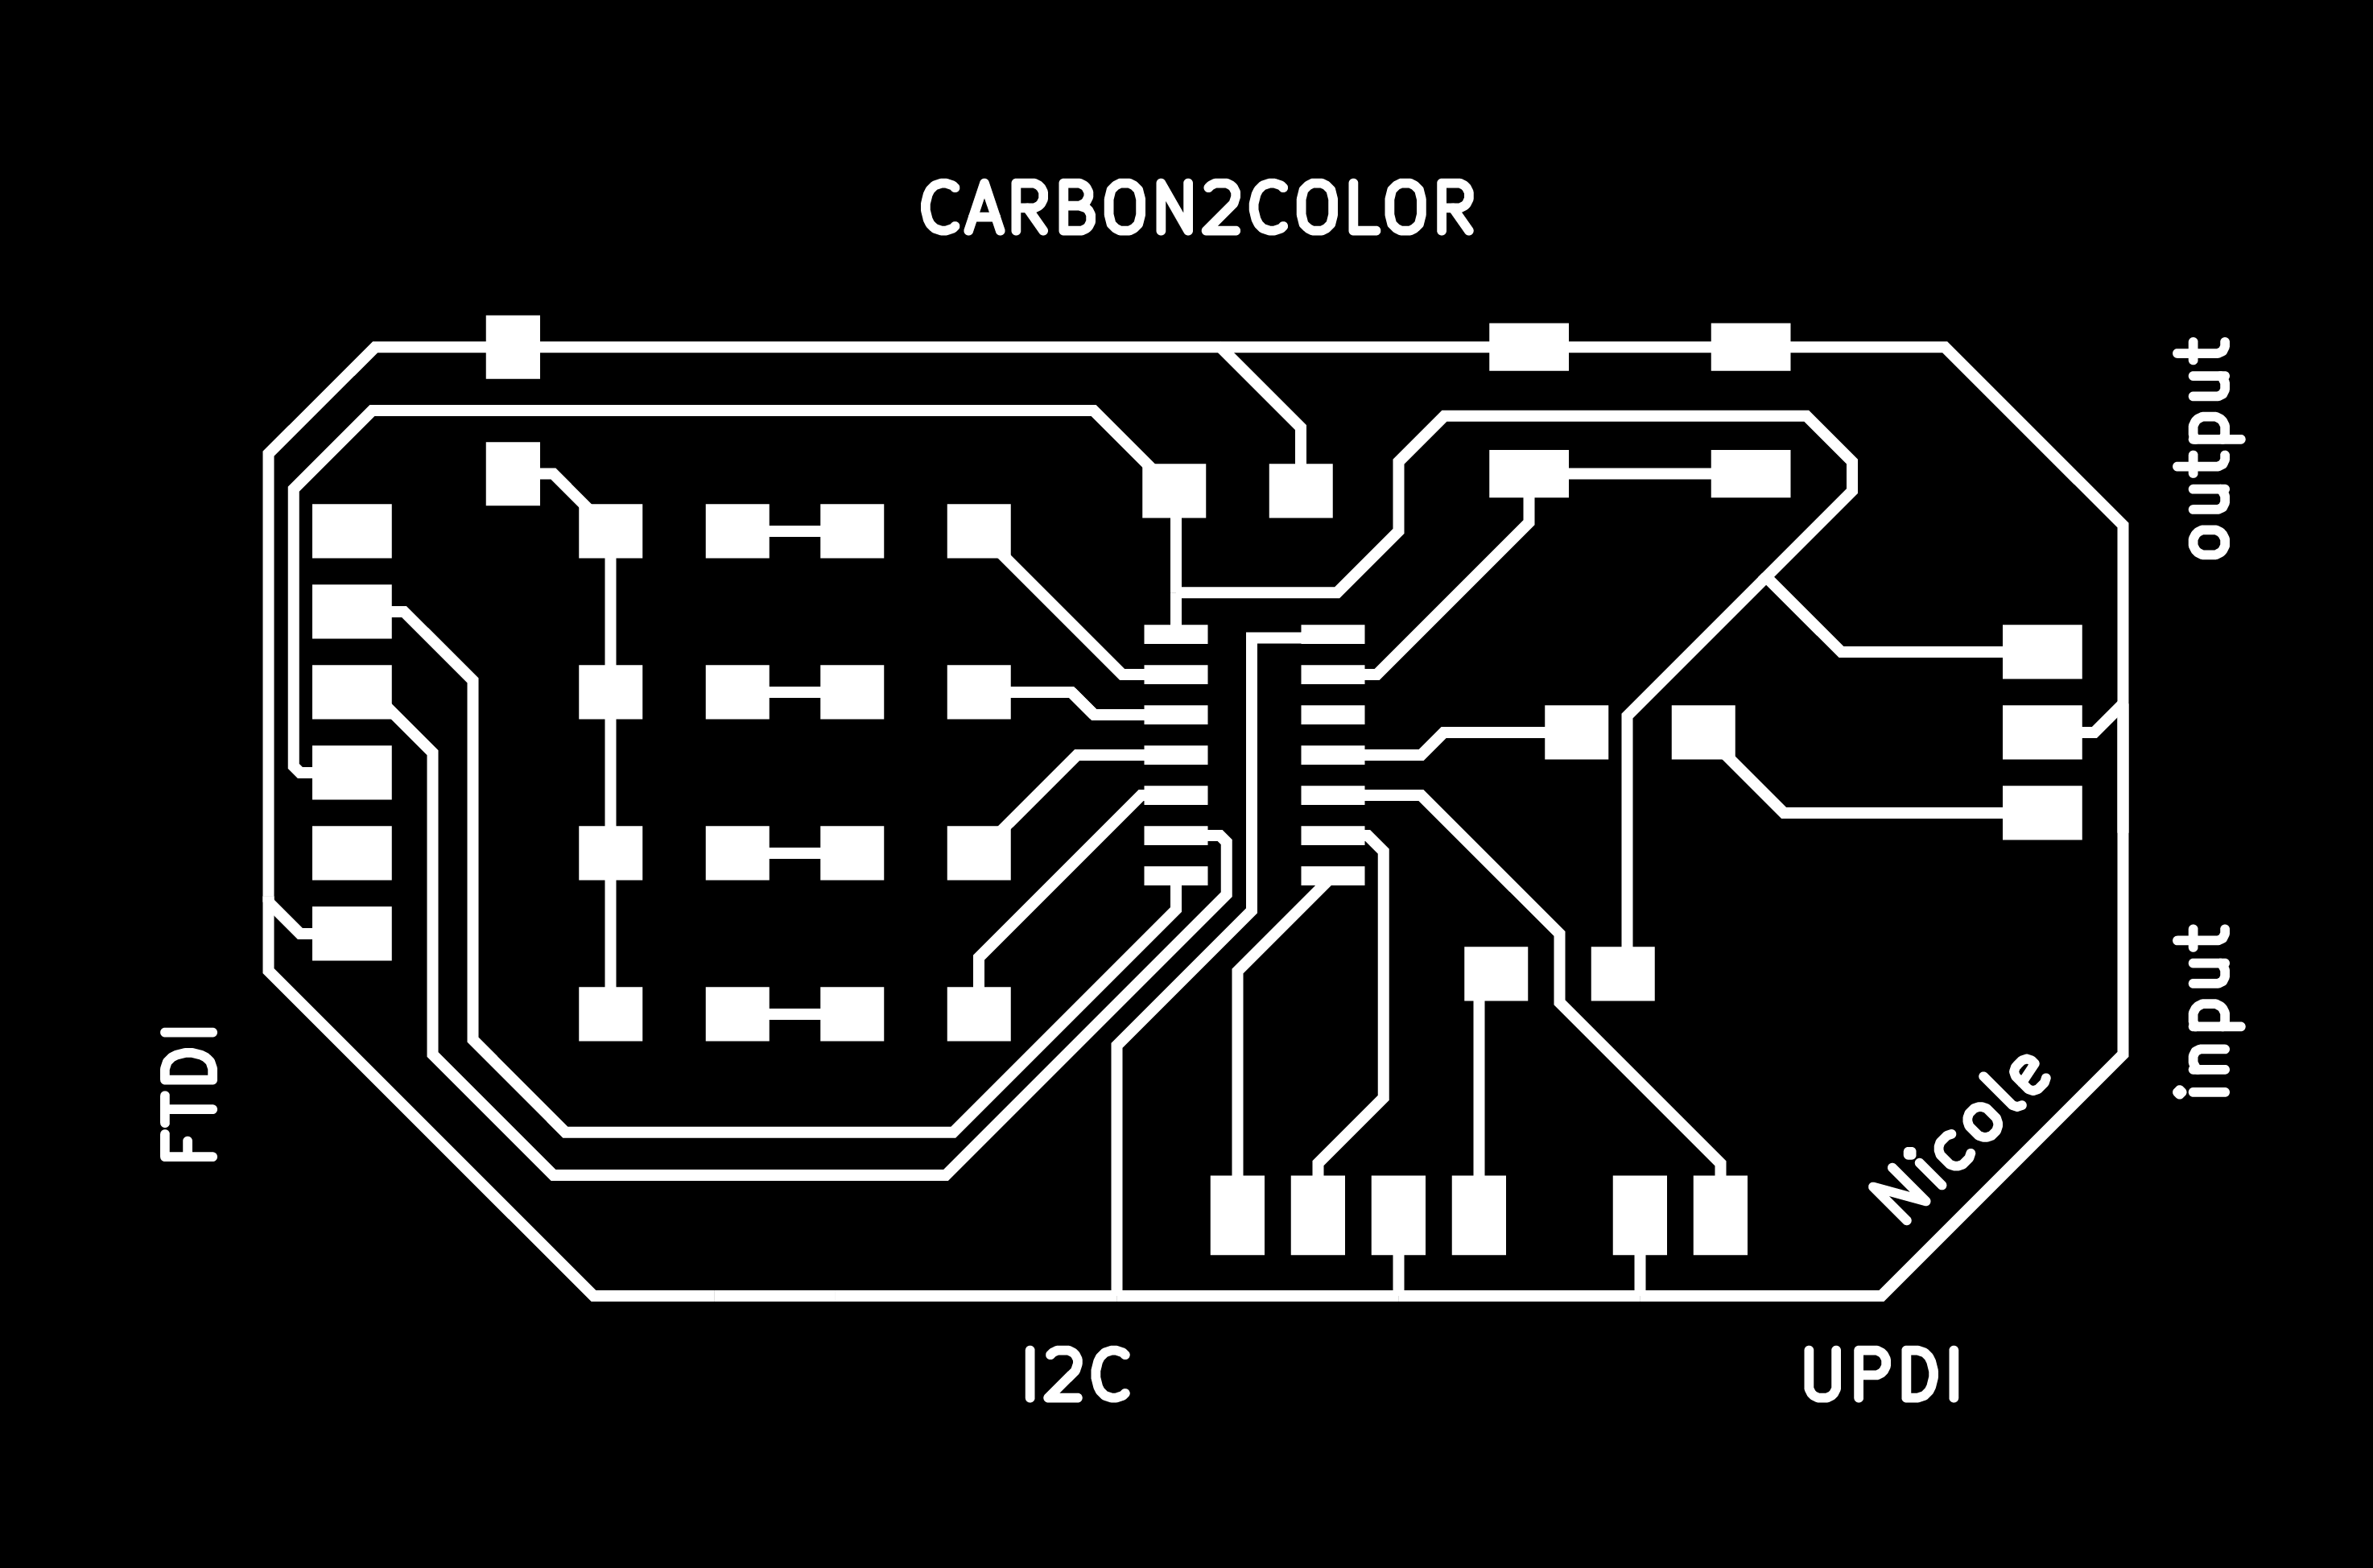
In mods I noticed that the lines of the ATtiny and the FTDI would overlap. Lucia mentioned that this is an issue with Illustrator. So I removed the strokes of components in Illustrator. And that did the job.
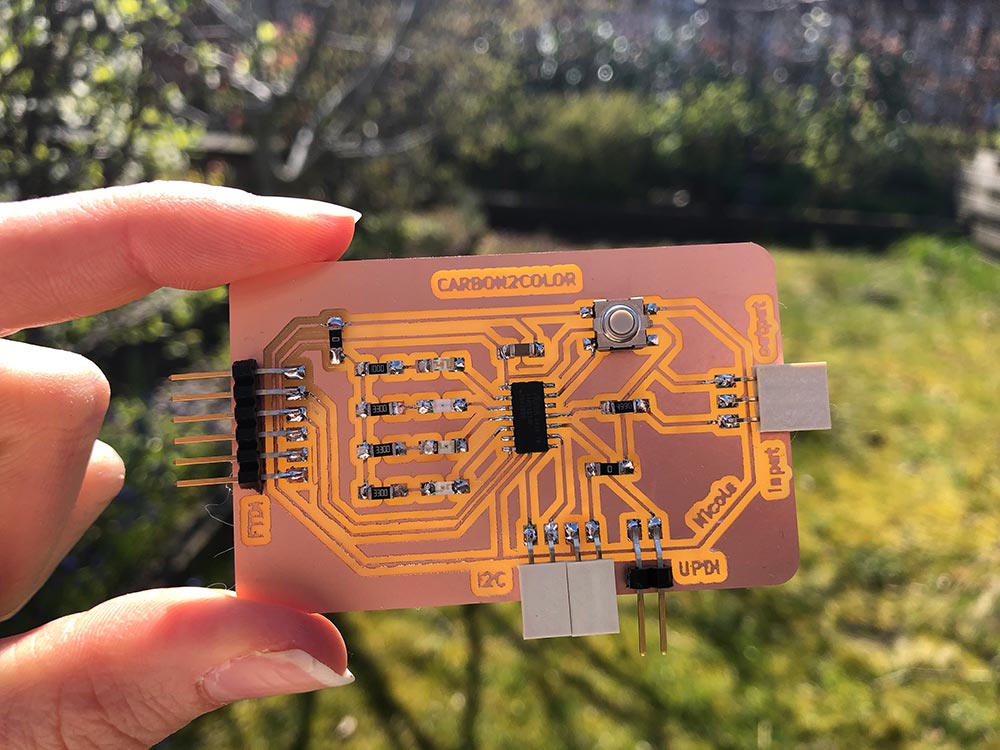
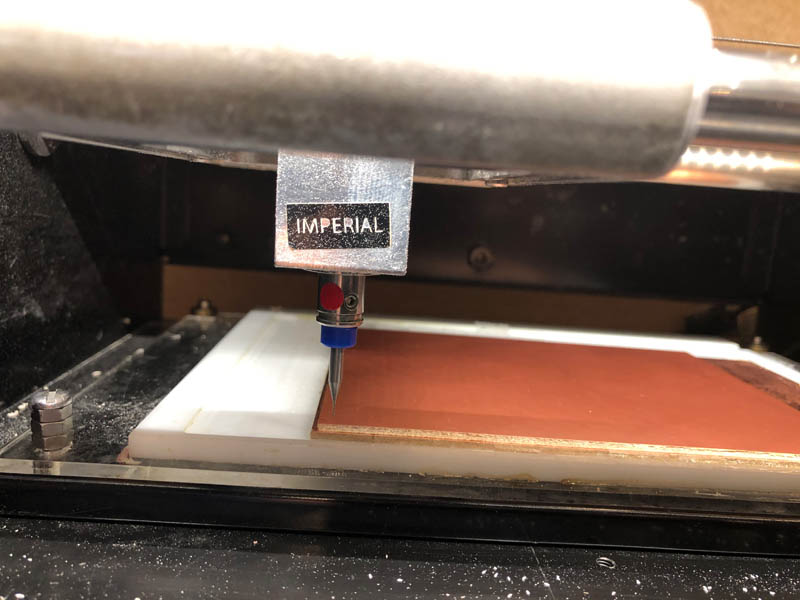
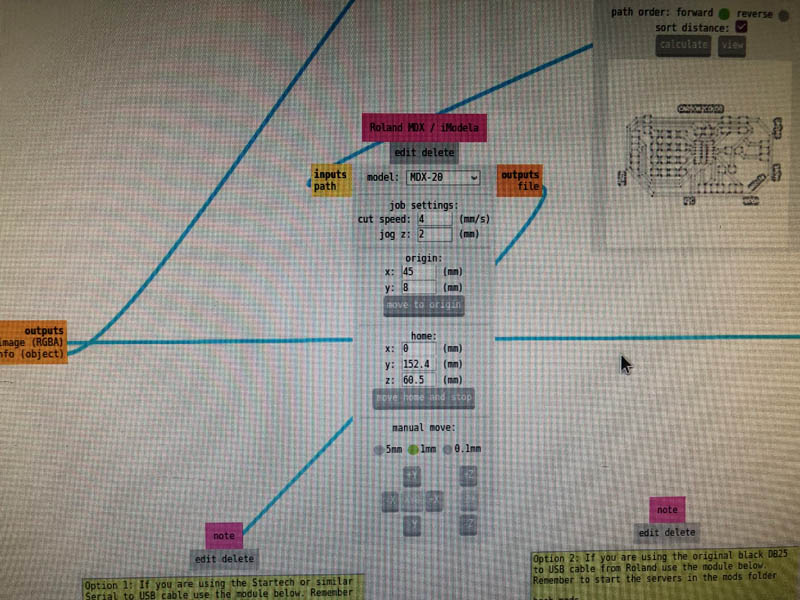
Milling
This time, the Roland had this blue thingy on the mill bit. A picture of the mods setup to remember the origin for milling the interior later.
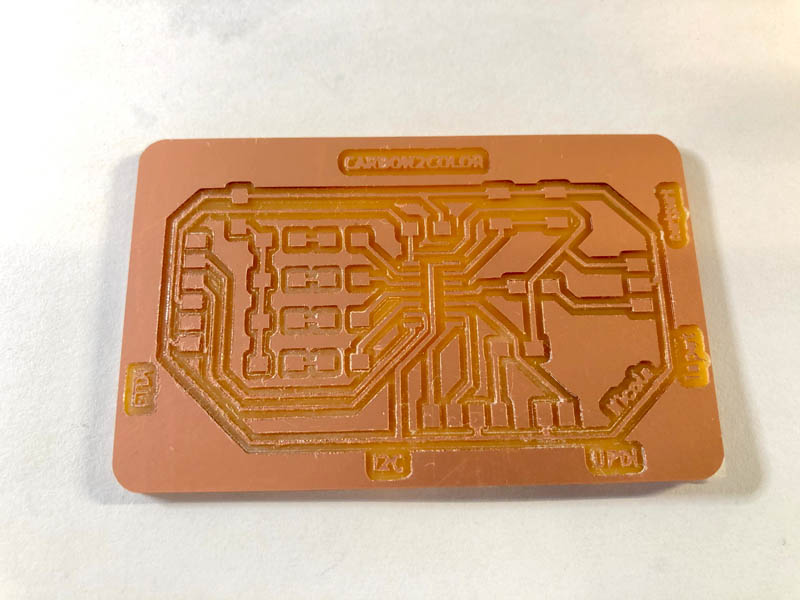
After milling the interior.
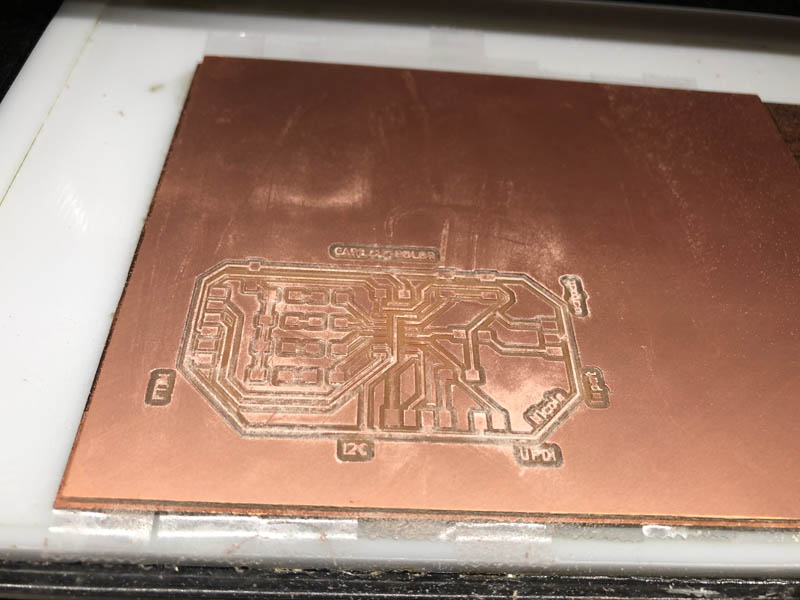
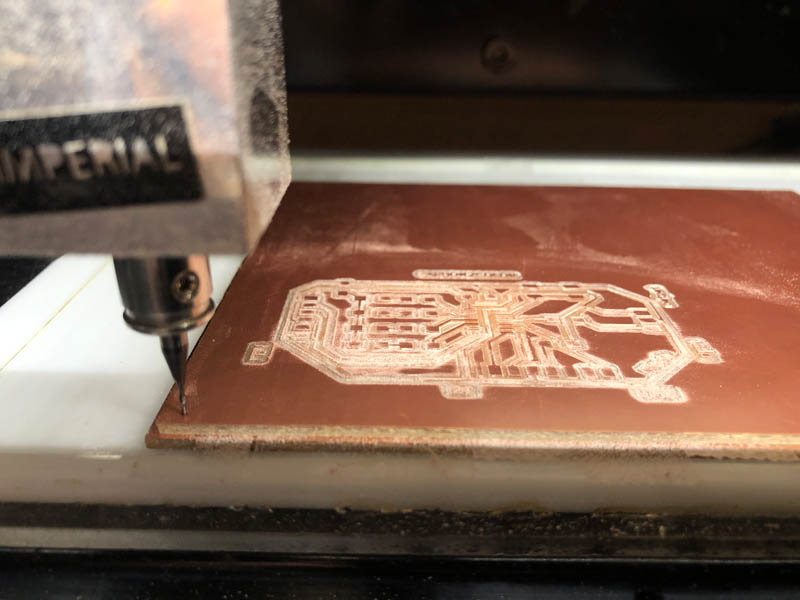
It all went well. The board is now ready for soldering.
Calculating resistance of LEDs
How to calculate resistor value of LED? This is a blogpost I used for guidance. The formula:
Resistor = (Battery Voltage – LED voltage) / desired LED current
I looked up the LEDs from the Fab Inventory to find the data sheets and then calculated the resistor value based on the formula.
LED blue - Digikey link
- Voltage: 3.3V
- Current: 20mA
Resistor: (5V - 3.3V)/20mA * 1000 = 85 ohms
LED green - Digikey link
- Voltage: 2.1V
- Current: 10mA
Resistor: (5V - 2.1V)/10mA * 1000 = 290 ohms
LED orange - Digikey link
- Voltage: 2V
- Current: 20mA
Resistor: (5V - 2V)/20mA * 1000 = 150 ohms
LED red - Digikey link
- Voltage: 1.8V
- Current: 10mA
Resistor: (5V - 1.8V)/10mA * 1000 = 320 ohms
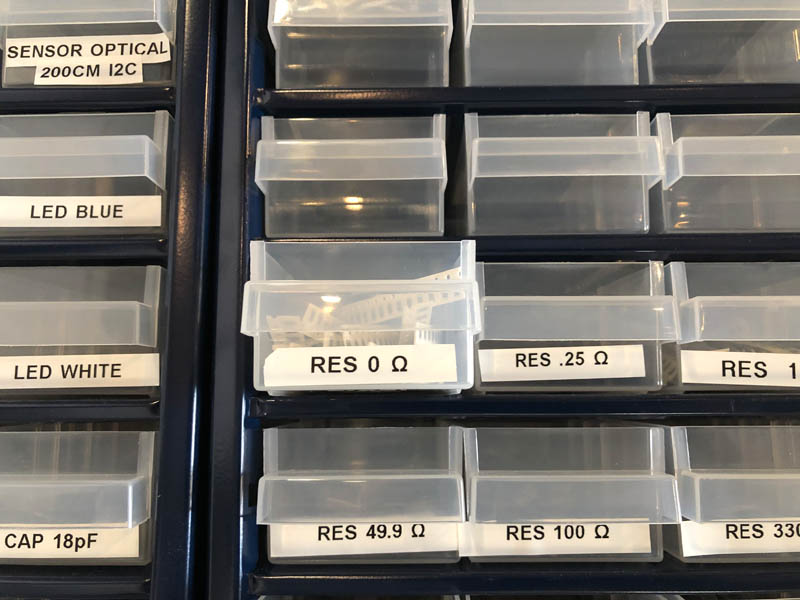
What components to use? Henk: When you get the components, take them slightly higher than the calculated value. All resistors available at Waag:
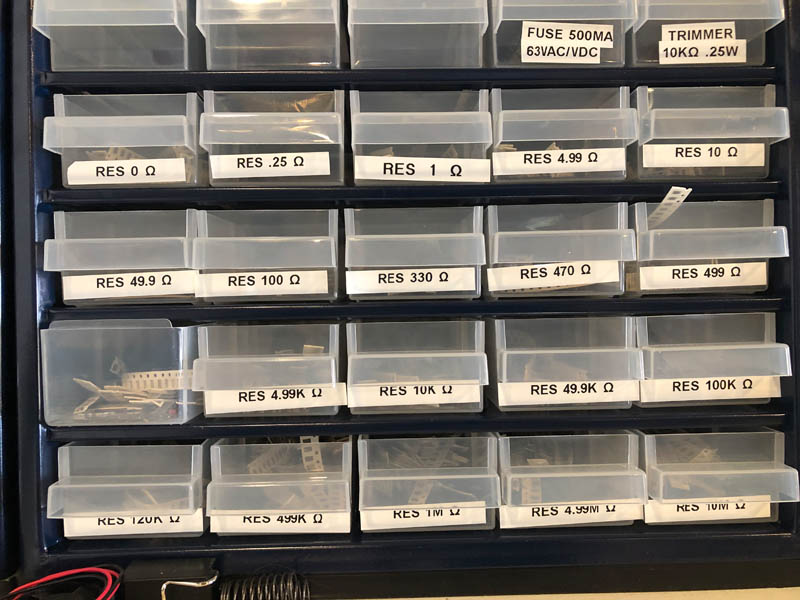
So I selected the following:
- Blue LED: 100 Ohms
- Red LED: 330 Ohms
- Orange LED: 330 Ohms
- Green LED: 330 Ohms
How to calculate capacitor?
- 1u in other board, with ATtiny412.
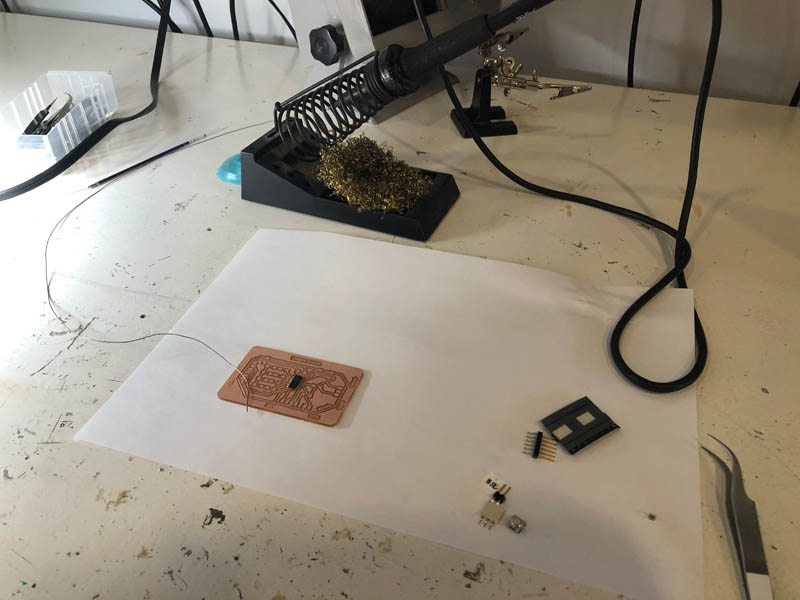
Soldering
With the right components selected, the board is ready for soldering.
Directionality:
- ATtiny1614: mark on VCC.
- LED: from anode to cathode, mark on cathode side.
- Button: DigiKey link
During and after soldering.
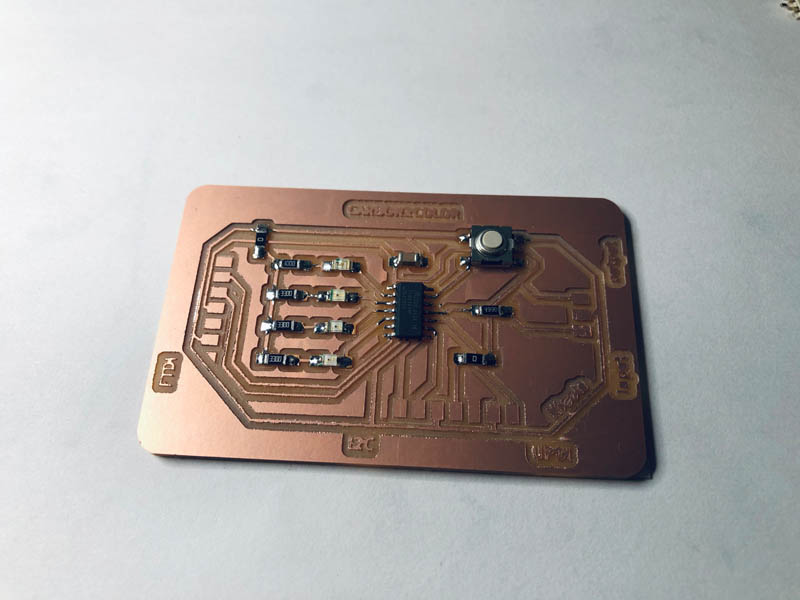
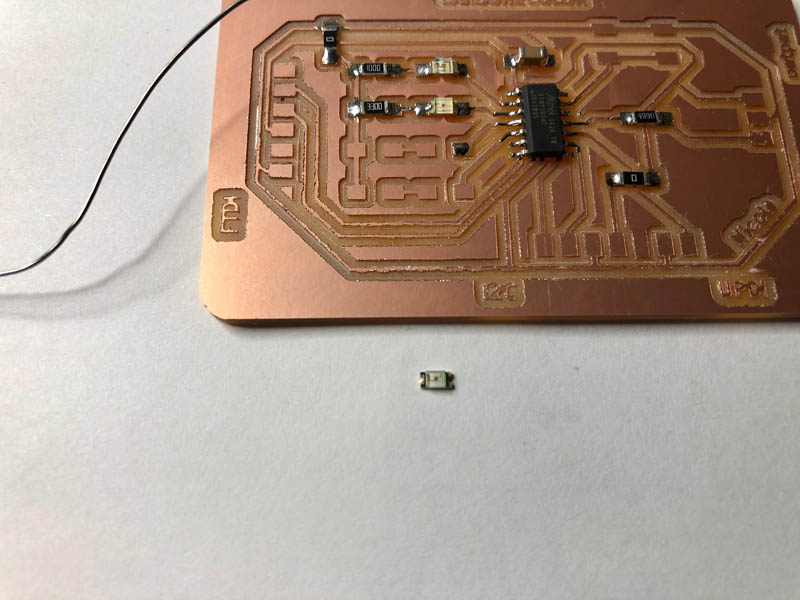
For later reference, as it might come in handy: it was really hard to find out the direction of the orange LED, just like last time. Not sure if I soldered it the right way.
Programming the ATtiny1614
The following programs are up and running:
- Carbon2Color Internal LED
- Carbon2Color NeoPixel Strandtest
- Carbon2Color CO2 sensor SCD30 test
- Carbon2Color OLED
- CO2 sensor + internal LED
And I’m still working on:
- CO2 sensor + NeoPixel colors final project
- CO2 sensor + OLED - I2C *next week
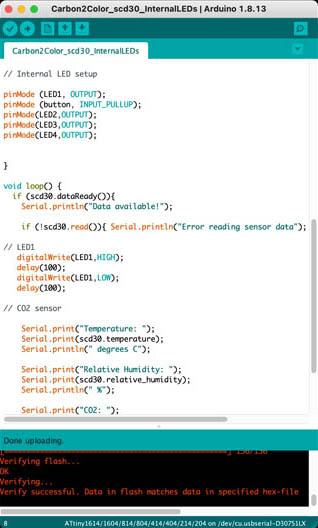
Carbon2Color Internal LEDs
I started with the example from Neil’s Embedded Programming page to Blink LEDs and activate the button on the ATtiny1614. Here is the code:
int button = A3;
int LED1 = A4;
int LED2 = A5;
int LED3 = A6;
int LED4 = A7;

void setup() {
pinMode (LED1, OUTPUT);
pinMode (button, INPUT_PULLUP);
pinMode(LED2,OUTPUT);
pinMode(LED3,OUTPUT);
pinMode(LED4,OUTPUT);
}

void loop() { // LED1 = blue
  if (digitalRead(button) ==LOW){
  digitalWrite(LED1, HIGH);

  }
else { digitalWrite(LED1, LOW);
  }

// LED2 = green
{
   digitalWrite(LED2,HIGH);
   delay(100);
   digitalWrite(LED2,LOW);
   delay(100);
   }


// LED3 = orange
{
   digitalWrite(LED3,HIGH);
   delay(100);
   digitalWrite(LED3,LOW);
   delay(100);
   }


// LED4 = red
{
   digitalWrite(LED4,HIGH);
   delay(500);
   digitalWrite(LED4,LOW);
   delay(500);
   }

}
First, blink the three LEDs.
Second, test the button of the blue LED.
After fixing the orange LED.
Replaced the red LED with a green one. Now the system works correctly.
The orange LED didn’t light up because it was soldered in the wrong direction. The second LED was red instead of green. Apparently the wrong component was placed back in the inventory at Waag. Anyway, it works now!
Carbon2Color NeoPixel Strandtest
The next spiral is to get the NeoPixel ring to work on the ATtiny. I was very excited to test this out. In the code, I included #define PIN A1 and it worked!
With another test program:
Carbon2Color CO2 sensor SCD30 test
Now that both LED systems work, the CO2 sensor can be added. For adding this input device to the board, I included two definitions in the code:
#define PIN B0
#define PIN B1
Switch from LX port to LS to read the signal in the Serial Monitor. This works!
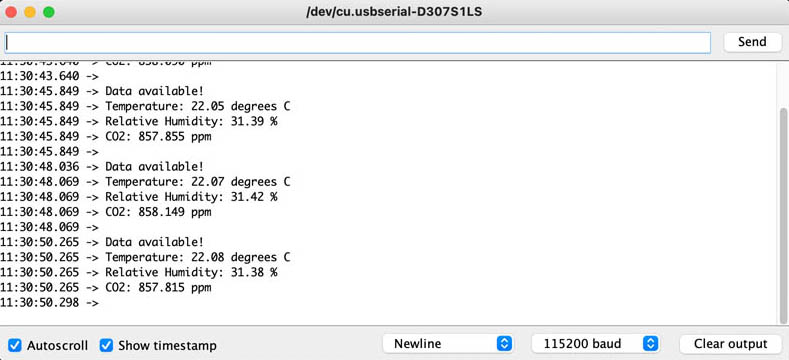
In the video below you can see the sensor register atmospheric CO2 levels, with an orange LED lighting up at intervals.
Carbon2Color OLED
To get the OLED working on my board, I consulted the page of Adrian Torres. First, find out the I2C number with the I2C scanner provided by Neil.
//
// hello.I2C.ino
//
// I2C hello-world scanner
//
// Neil Gershenfeld 12/8/19
//
// This work may be reproduced, modified, distributed,
// performed, and displayed for any purpose, but must
// acknowledge this project. Copyright is retained and
// must be preserved. The work is provided as is; no
// warranty is provided, and users accept all liability.
//

#include <Wire.h>

void setup() {
   Serial.begin(115200);
   Wire.begin();
   }

uint8_t address,count;

void loop() {
   count = 0;
   Serial.println("start scan ...");
   for (address = 1; address < 127; address++) {
      Wire.beginTransmission (address);
      if (Wire.endTransmission () == 0) {
         count += 1;
         Serial.print("   found ");
         Serial.print(address,DEC);
         Serial.print(" (0x");
         Serial.print(address,HEX);
         Serial.println (")");
         }
      }
   if (count == 0)
      Serial.println("   no devices found");
   delay(1000);
   }
The I2C identification number that’s found in the scan is 03xC. Now continue with a simple Hello OLED program:
/*********
  Rui Santos
  Complete project details at https://randomnerdtutorials.com
*********/
//Fab Academy 2020 - Fab Lab León
//OLED
//Adrianino
//ATtiny1614

#include <Wire.h>
#include <Adafruit_GFX.h>
#include <Adafruit_SSD1306.h>

#define SCREEN_WIDTH 128 // OLED display width, in pixels
#define SCREEN_HEIGHT 64 // OLED display height, in pixels

// Declaration for an SSD1306 display connected to I2C (SDA, SCL pins)
Adafruit_SSD1306 display(SCREEN_WIDTH, SCREEN_HEIGHT, &Wire, -1); // // Reset pin # (or -1 if sharing Arduino reset pin)

void setup() {
  Serial.begin(115200);

  if(!display.begin(SSD1306_SWITCHCAPVCC, 0x3C)) { // Address 0x3C for 128x64
    Serial.println(F("SSD1306 allocation failed"));
    for(;;);
  }
  delay(2000);
  display.clearDisplay();

  display.setTextSize(1);
  display.setTextColor(WHITE);
  display.setCursor(0, 5);
  // Display static text
  display.println("Hello, world!");
  display.setCursor(0, 20);
  display.println("Fab Academy 2020");
  display.println("Carbon2Color");
  display.println("Nicole Bakker");
  display.display();
}

void loop() {

}
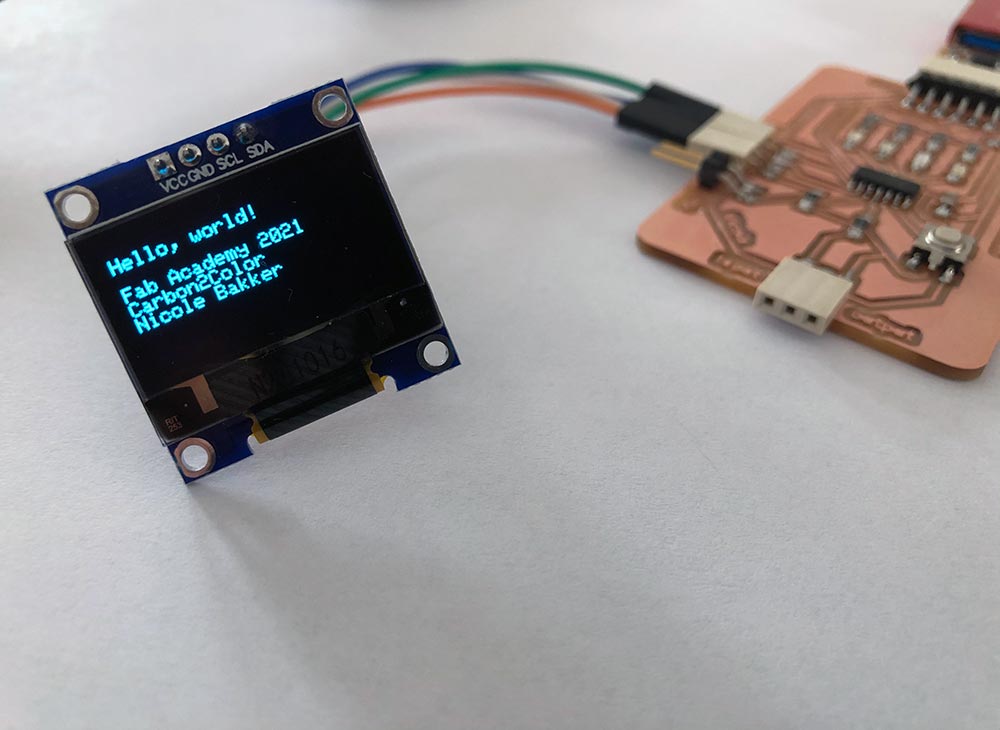
And here is the working OLED :)
To program the OLED to do more interesting stuff later on, here is a guide from Random Nerd Tutorials.
CO2 sensor + internal LEDs combined
After making the internal LEDs, the CO2 sensor, OLED and the NeoPixel ring work on the ATtiny, the next step is to combine them. The first spiral: if data arrives, blink blue LED. To achieve this, I included the pinModes and the code for blinking the blue LED in the test code of the sensor.
The working program.
Two questions about the code:
- What’s the difference between
intand#define? - And there is a difference between the void:
CO2 sensor code has
void setup(void) {and the InternalLEd hasvoid setup() {. What is the difference?
For the first question, this Quora thread provides an answer: the general consensus is that it’s better to write int because:
#defineis a macro definition. If you write#define COUNT 3then every place the word COUNT appears, the preprocessor replaces it with 3.const int COUNT = 3;does not define a macro; it defines a name of a variable, and wherever that variable is used, the value 3 is used. The const int is a better style than the #define.
The second question was answered on a StackExchange Arduino forum:
Absolutely nothing, in modern versions of C and C++. Specifying no arguments is the same as specifying void. In old versions of C a function with no arguments took a single implicit int argument or allowed you to specify the arguments on a separate line, but no one uses anything like that nowadays.
Good to know! Let’s move on to the next spiral :)
Deciding on CO2 threshold values
The second spiral is to visualize the atmospheric CO2 by blinking a red, orange or green LED based on sensor status. The main question to ask is, what are the thresholds to divide CO2 levels by? When does it pose a serious health issue?
First, let’s take a look at data from NOAA’s Mauna Loa observatory on Hawaii. This research station is positioned at an altitude of nearly 3400 meters and they constitute the longest record of direct measurements of CO2 in the atmosphere. It was a historic moment when carbon dioxide measurements reached 400 ppm on May 9, 2013.
To some, crossing the threshold of 400 ppm is a signal that we are now firmly seated in the “Anthropocene,” a human epoch where people are having major and lasting impacts on the planet. Because of the long lifetime of CO2, to others it means we are marching inexorably towards a “point of no return,” into territory that is unknown for the human race. - NASA
In March 2021, it’s already 417.64 ppm, compared to 414.74 ppm in the same month in 2020. See the graph below for the trend since ±1960.

A review paper published by Nature on Direct human health risks of increased atmospheric carbon dioxide is summarized in a Guardian article (2019): Indoor carbon dioxide levels could be a health hazard, scientists warn.
A growing body of research suggests CO2 levels as low as 1,000ppm could cause health problems, even if exposure only lasts for a few hours.
Three tables from the Nature paper are shown below, to get more detailed insight into the degree of harmfulness of various carbon dioxide levels.

An exposure of less than four hours to a CO2 concentration of 1000-4000 ppm already leads to adverse health outcomes associated with acute CO2 exposure. Other studies show that an exposure to 700-3000 ppm for a duration of 13-15 days leads to behavioral changes and physiological stress. The system diagram below shows potential mechanisms by which CO2 might affect human health.

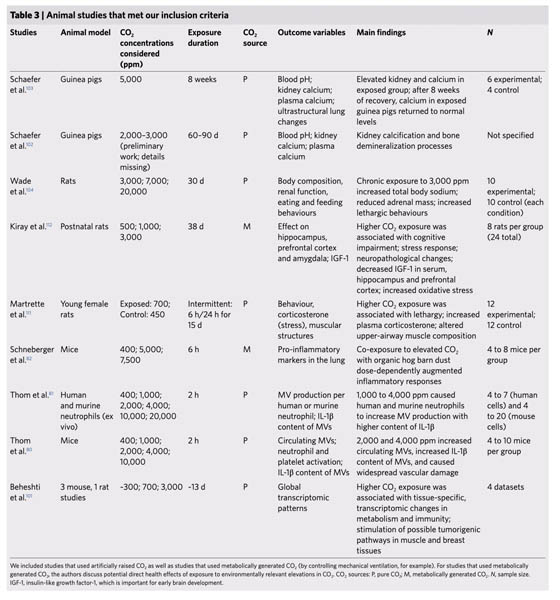
The table below provides a selection of studies to the effects of elevated CO2 concentrations on animal health. At higher CO2 levels, symptoms including cognitive impairment, lethargy, stress response, inflammatory responses, vascular damage, transcriptomic changes in metabolism and immunity, and the stimulation of possible tumorigenic pathways in muscle and breast tissues were found. The study on young female rats already shows symptoms at an exposure level of 700 ppm.
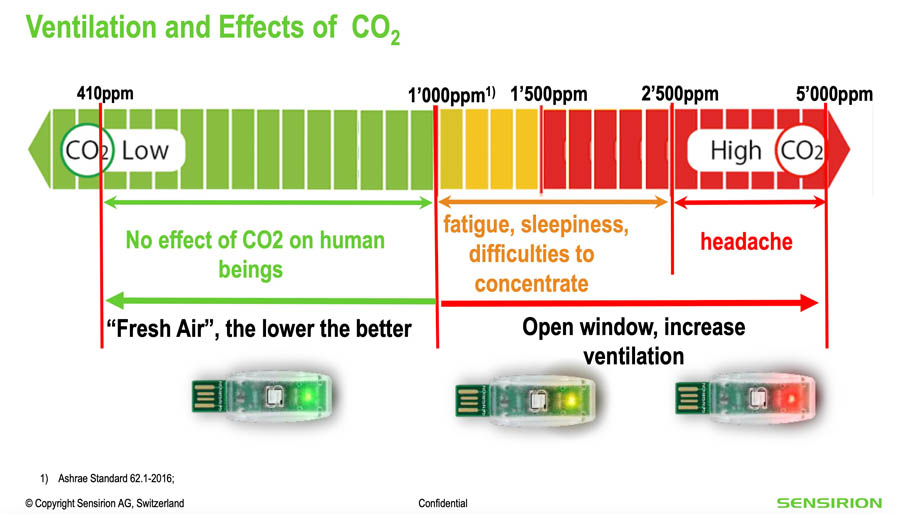
The final resource I’m looking at for deciding on the CO2 ranges is the datasheet of the sensor we bought. The image below is from a presentation from Sensirion. They recommend to maintain CO2 levels between 400-800ppm in indoor spaces.
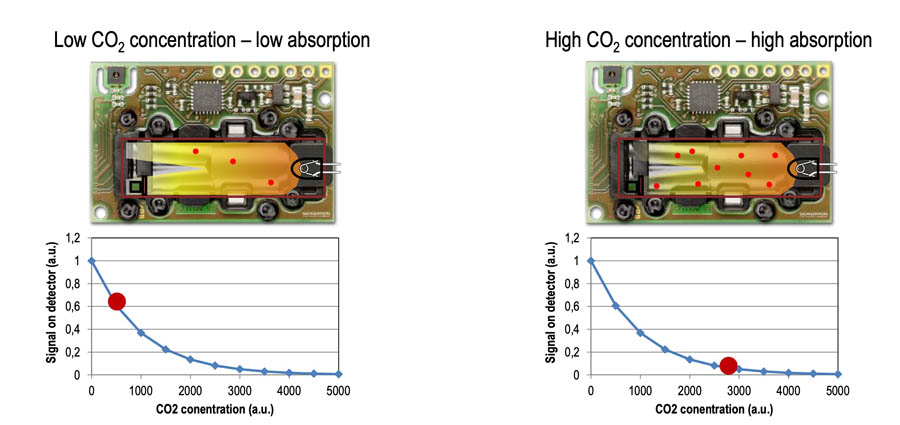
This is how the sensor works (Sensirion):
Based on the research paper and my own sensitivity - I start to notice the above symptoms at around 800 ppm - I decided to define the CO2 threshold values of my sensor at:
- Mode 1 (green LED): <700 ppm
- Mode 2 (orange LED): 700-1000 ppm
- Mode 3 (red LED): >1000 ppm
Now let’s move on to programming the LEDs!
Programming internal LEDs to respond to CO2 status
My hypothesis on how to do this: define the three modes in the void setup first, and link those to the colors of the three LEDs in the loop. To see if this works, I looked at reference projects. For example, the code of the Adafruit example project with an RGB Matrix Portal.
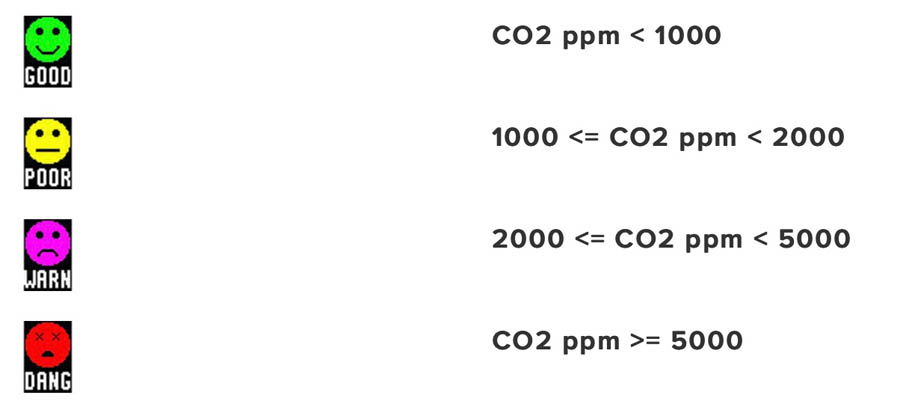
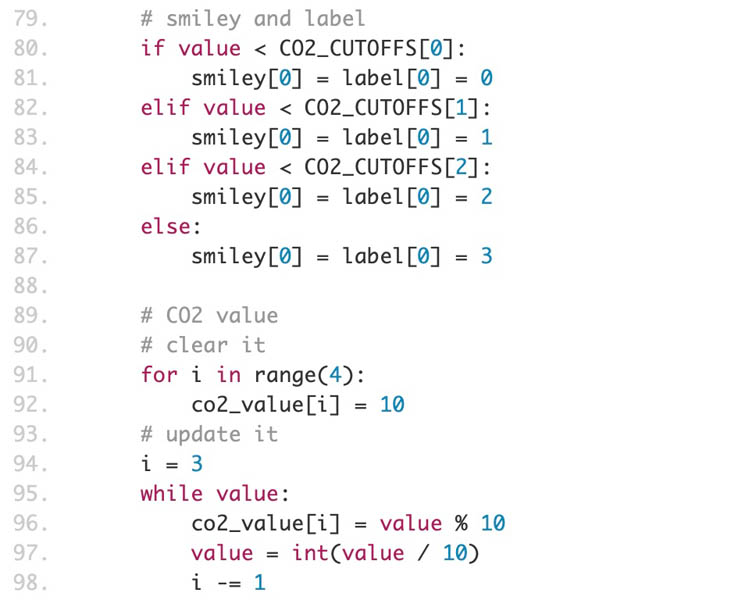
The general idea for the Matrix Portal based air quality display is pretty simple. It has a readout of the current CO2 levels in ppm so that value it always viewable. Then, for each of the four ranges above, there is an associated “smiley face” icon and word.
They define the CO2 levels as follows:
In the code, written in CircuitPython, they start with defining CO2_CUTOFFS.
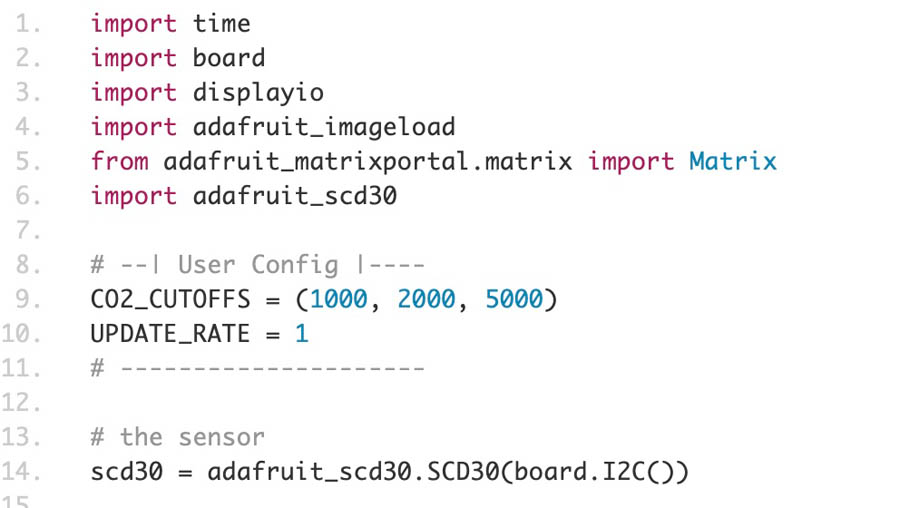
And then refer to it later in the code.
In this example, CO2CUTOFFS are defined just after import. This item is not mentioned in the Adafruit library. I’m not sure if it works, but let’s try!
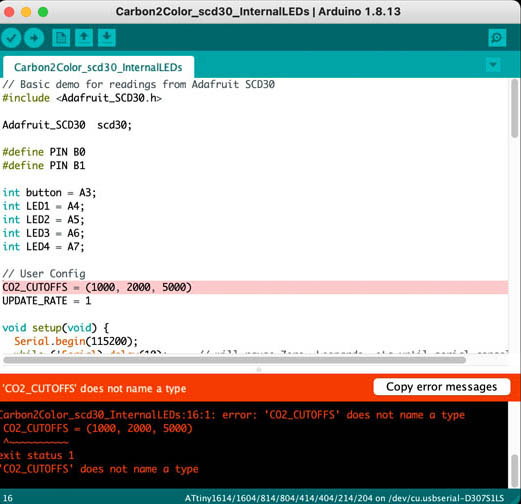
It is not showing anything. Here is an Arduino Programming Cheat Sheet on GitHub by Mark Liffiton, in case it comes in handy. This is a small experiment.
Success! The serial monitor shows my code.
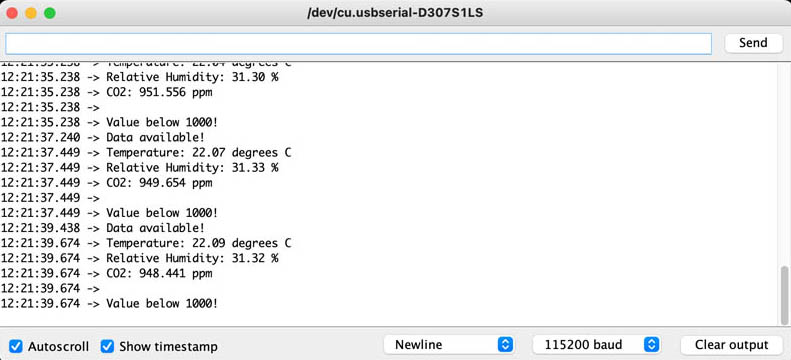
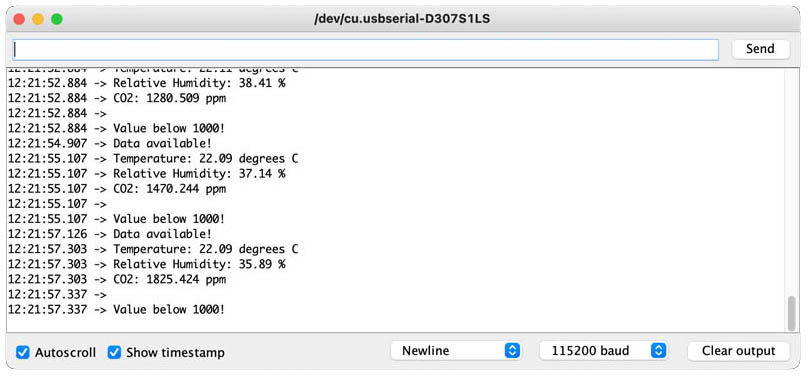
Then I increased the CO2 level by breathing out air close to the sensor. This still gives the same output because no other function is defined yet.
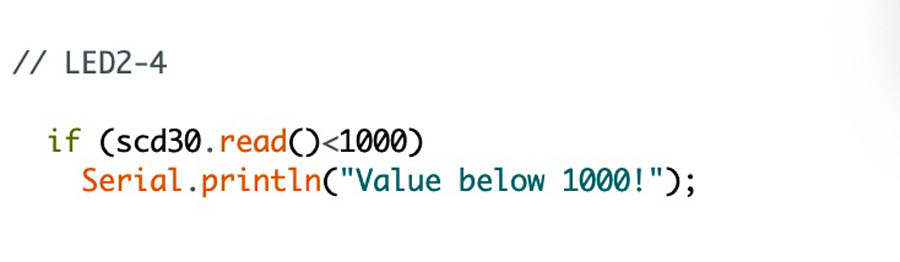
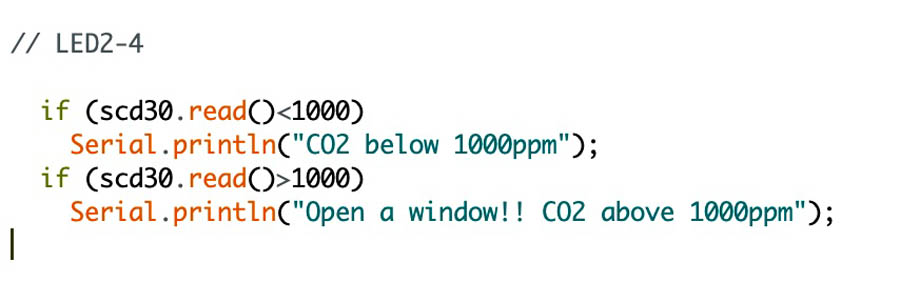
So I added another if-statement.
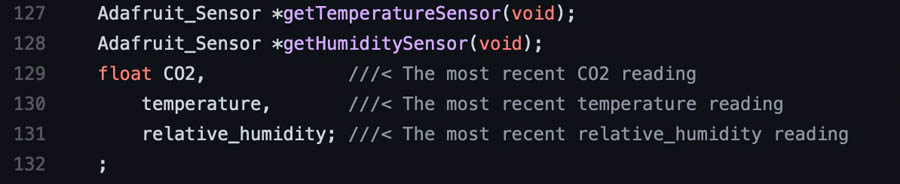
That didn’t work. Next try. The Sparkfun SCD30 Arduino Library provides insight in the names of the functions. I’ll try readMeasurement first. This is the Adafruit SCD30 library. I also looked up the name of the latest CO2 value.
How to get a value in between 700 and 1000? In normal language, this is what I’m trying to do:
Unfortunately no text is showing up at all. Next try, what if we look at a general LED indicator at a temperature sensor for inspiration?
const int hot = 87; //set hot parameter
const int cold = 75; //set cold parameter
void setup() {
pinMode(A2, INPUT); //sensor
pinMode(2, OUTPUT); //blue
pinMode(3, OUTPUT); //green
pinMode(4, OUTPUT); //red
Serial.begin(9600);
}
void loop() {
int sensor = analogRead(A2);
float voltage = (sensor / 1024.0) * 5.0;
float tempC = (voltage - .5) * 100;
float tempF = (tempC * 1.8) + 32;
Serial.print("temp: ");
Serial.print(tempF);
if (tempF < cold) { //cold
digitalWrite(2, HIGH);
digitalWrite(3, LOW);
digitalWrite(4, LOW);
Serial.println(" It's Cold.");
}
else if (tempF >= hot) { //hot
digitalWrite(2, LOW);
digitalWrite(3, LOW);
digitalWrite(4, HIGH);
Serial.println(" It's Hot.");
}
else { //fine
digitalWrite(2, LOW);
digitalWrite(3, HIGH);
digitalWrite(4, LOW);
Serial.println(" It's Fine.");
}
delay(10);
}
So my next try is to define three states: low, medium and high, before the void setup.
const int low = 700;
const int high = 1000;
With only two states, it is possible to define three ranges.
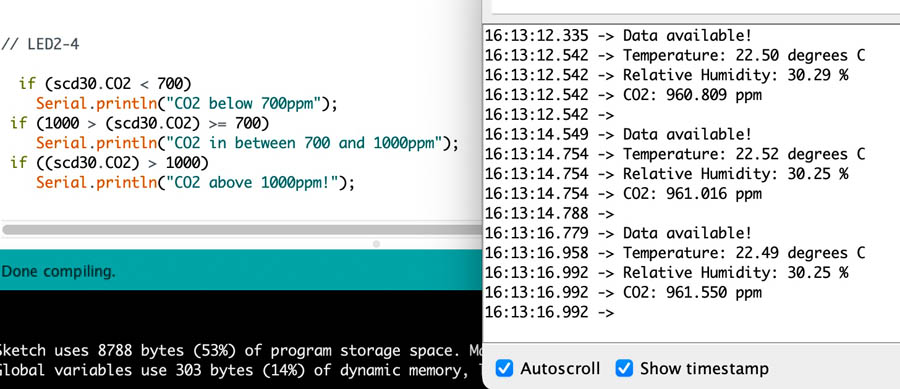
// LED2-4

if (scd30.CO2, 3 < low) { //low
    Serial.println("CO2 below 700ppm");
}
else if (scd30.CO2, 3 >= high) { //high
Serial.println("CO2 above 1000ppm");
  }

else { //medium
 Serial.println("CO2 in between 700-1000 ppm");
}
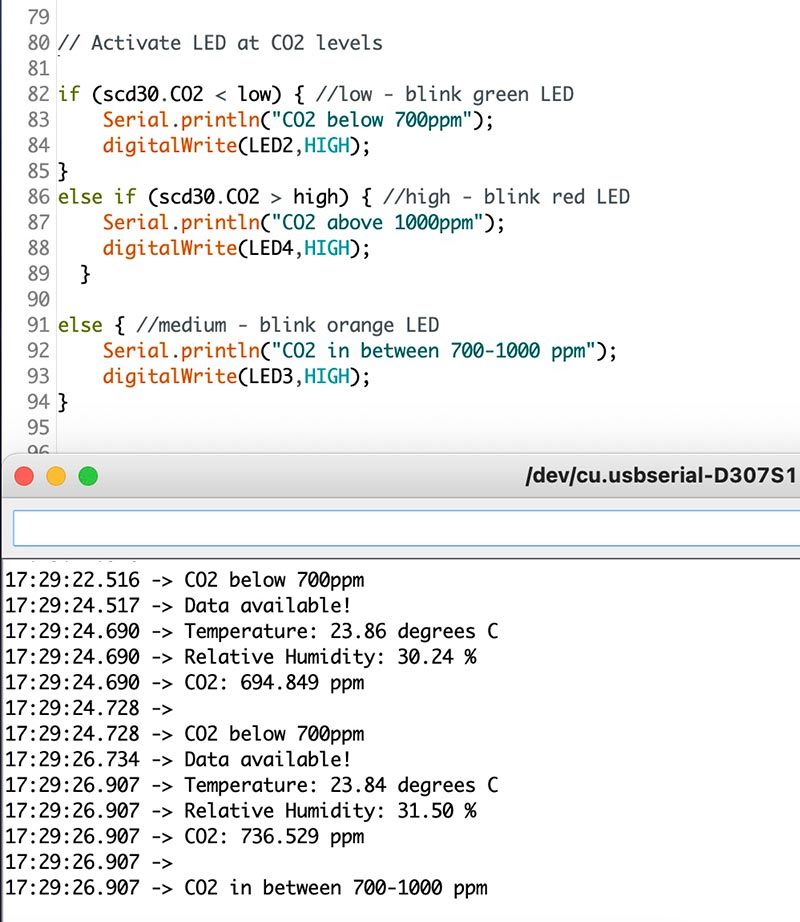
And then add the code of each of the LEDs. Henk told me to remove the ,3 and simplify >= to >.
// LED2-4

if (scd30.CO2 < low) { //low - blink green LED
    Serial.println("CO2 below 700ppm");
    digitalWrite(LED2,HIGH);
}
else if (scd30.CO2 > high) { //high - blink red LED
    Serial.println("CO2 above 1000ppm");
    digitalWrite(LED4,HIGH);
  }

else { //medium - blink orange LED
    Serial.println("CO2 in between 700-1000 ppm");
    digitalWrite(LED3,HIGH);
}
Now all LEDs light up when the CO2 concentration is reached! They don’t turn off again yet, because I haven’t defined that yet.
This is the working code so far, with a screenshot of the serial monitor:
To turn off the LED until the next state is defined, I played with digitalWrite(LED2,LOW); and placed this in various positions. Nadieh suggested to position this right in front of the LED activations, because the libraries are large and otherwise it takes too long to load.
// Activate LED at CO2 levels

digitalWrite(LED2,LOW);
digitalWrite(LED3,LOW);
digitalWrite(LED4,LOW);

if (scd30.CO2 < low) { //low - blink green LED
    Serial.println("CO2 below 700ppm");
    digitalWrite(LED2,HIGH);
}
else if (scd30.CO2 > high) { //high - blink red LED
    Serial.println("CO2 above 1000ppm");
    digitalWrite(LED4,HIGH);
  }

else { //medium - blink orange LED
    Serial.println("CO2 in between 700-1000 ppm");
    digitalWrite(LED3,HIGH);
}
The hero video of my working Carbon2Color board!
It was great to work with these output devices, and even connect them to the carbon dioxide sensor. A next spiral for the final project is to program the NeoPixels to respond to the CO2 values. Next week during Networking and Communications I’m going to connect the CO2 sensor, OLED display and another I2C device in a network.
Downloads
Explore more like this
Week 17 Invention, Intellectual Property and Business Models
After acing through the technical assignments of Fab Academy, the last two weeks have a lighter load so we can focus on the final project. But this does not mean...
Week 16 Applications and Implications
Propose a final project masterpiece that integrates the range of units covered, answering: