Week 15
Interface and application programming

Group assignment Compare as many tool options as possible.
Individual assignment Write an application that interfaces a user with an input and/or output device that you made
Group assignment
 - Compare as many tool options as possible.
 - find out which one work for me
 - search a bit on options but most of all make choices since there is so many options
 - get an overview on my options.
Our group assignment was not so structured as we all need to use different applications and feel the urge to look into possibilities for our final project.
What we ended up doing was installing a localhost on our mac’s to be able to see what we will create. Very happy we’ve done this together, now that i understand what it is i will be able to update this with every major Mac version and also use this for my final project.
Creating a local web server
The steps we took are all explained here on this TechCookBookSite but i will go over the main ones.
- starting the Apache Server (which by default is on MAC)
- create a Sites folder in your USER base folder
- create or in my case find username

- configure the httpd.conf file
- configure the httpd.userdir.conf file
We didn’t set up a MySQL server because we don’t need it, actually we stopped already at the end of step 5 “Create a phpinfo() page”
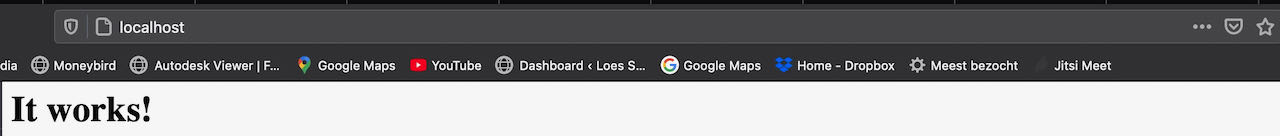
When we went trough all the steps my site gave me a security error which indicated that i forgot somewhere to allow clearance and yes, i forgot to fill my username in the httpd.conf file.
Data visualization
From our very own Nadieh we got a very nice introduction into the world of data visualization, she showed us how the process of turning data into visualizations work through her go to program D3. If anyone also wants to see it, i am sure that there will be a link available.
Although she did give us a short summary of the 2 main routes to take:
-
SVG based software
- used map function
- you can use MouseOver
-
HTML canvas
- like painting, no reference to vector points
- simpler for the browser for bigger data
Observable is a site where there is lots of data visualization shared to learn and be inspired, inspired i am already, learning is a longer process.
Languages
-
C used by Arduino
-
C++ old extension to C - it adds object orientation to C
-
DDD visualizer to help you understand your code
-
GO, Rust, Flutter and Dart are newer versions which have more safety build in.
-
Processing adds graphics, a flexible software sketchbook and a language for learning how to code within the context of the visual arts. I’ve used this software before but mainly as a user not as a programmer.
-
p5.js is an interpretation of Processing for today’s web
-
Python is an interpreted high-level general-purpose programming language. Python’s design philosophy emphasizes code readability with its notable use of significant indentation. Its language constructs as well as its object-oriented approach aim to help programmers write clear, logical code for small and large-scale projects.
-
Javascript is high-level, often just-in-time compiled, and multi-paradigm. It has curly-bracket syntax, dynamic typing, prototype-based object-orientation, and first-class functions. JavaScript engines were originally used only in web browsers, but they are now core components of other software systems, most notably servers and a variety of applications.
-
D3 beautiful graphic data visualization, uses vectors, way to complicated for me at the moment.
-
WebGL Web Graphics Library is a JavaScript API for rendering interactive 2D and 3D graphics within any compatible web browser without the use of plug-ins.WebGL is fully integrated with other web standards, allowing GPU-accelerated usage of physics and image processing and effects as part of the web page canvas. WebGL elements can be mixed with other HTML elements and composited with other parts of the page or page background.
-
Downside of WebGL is that’s its so low level that it’s hard to learn.
-
Plus side is that it’s really fast
Individual assignment
- Write an application that interfaces a user with an input and/or output device that you made
- try to make already the base for reading out data just 1/0 in my case.
- what program to use, try to keep it simple
- receiving data from a sensor on that i can implement in a application
As i already did a few tutorials last year i didn’t have to start completely at scratch for P5.js which helped me since i took a day of the week to finish week 14 and i had a short work trip.
First i had to find a way to make my UPDI work, it gave up on me during my catch up day of week 14 beginning this week. Here is a list of things i started with:
- changing USB cables
- changing PORTS
- restarting my computer (i was not accepting it was a hardware/solder problem)
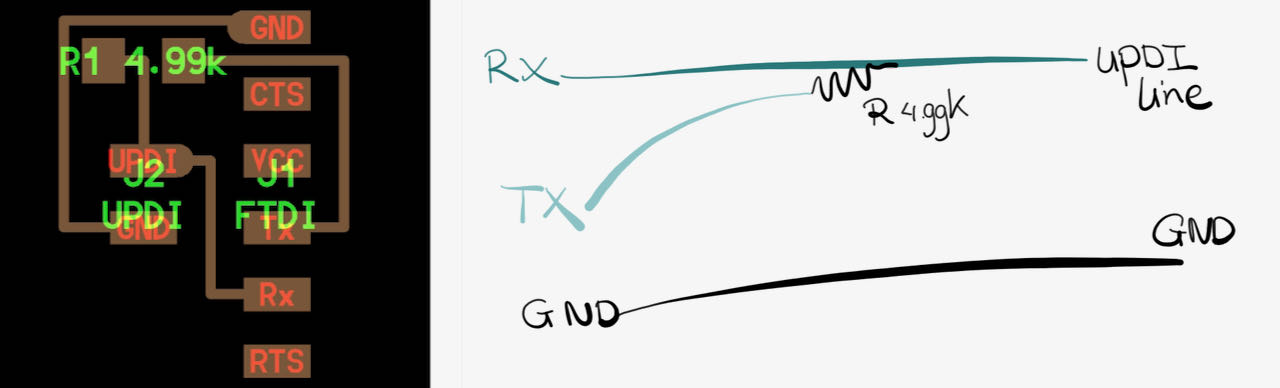
- finally decided to go with the ‘hack your FTDI into a UPDI version.
- first i had to find out how to make it work, although i was explained to me before by lucia but i forgot (note to self: write things down)
- asked on Mattermost and got a fast and friendly reply from both Henk and Adrian.
- back to the soldering board
on the left the official pcb solution, on the right the hack version :)
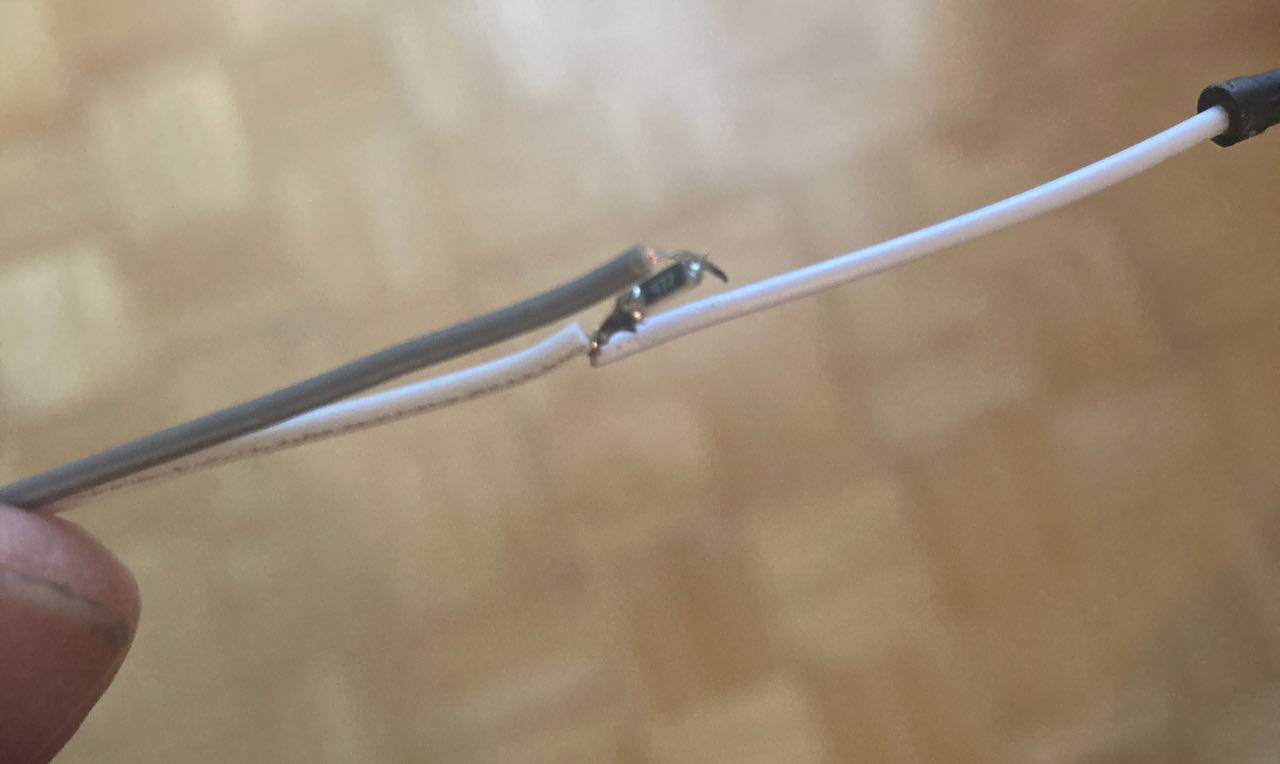
As i didn’t have any pin resistors at home i had to go for the looking oh so fragile but probably gonna last a lifetime solution:
Setting up P5 and Serial communication
Again internet was my friend here when searching for P5 and Serial communication a whole new world opened for me, for example:
The steps were even shared in the group mattermost by Nadieh (thanks for that)
- install the P5 Serial App via this github link
- run the app
- move this script into the P5 folder in my Sites folder
let serial;
let data;

let width = 400;
let height = 400;

function setup() {
    // Instantiate our SerialPort object
    serial = new p5.SerialPort();

    // Assuming the board is connected, let's open the connection to it
    // Use the FTDI ID
    serial.open("/dev/tty.usbserial-D30A3T7W");

    /////// Register some callbacks ///////
    // When we connect to the underlying server
    serial.on('connected', () => { console.log("We are connected!"); });
    // When we get a list of serial ports that are available
    let portlist = serial.list();
    serial.on('list', gotList);
    // When or if we get an error
    serial.on('error', (err) => { console.log(err); });
    // When our serial port is opened and ready for read/write
    serial.on('open', () => { console.log("Serial Port is open!"); });
    // When we some data from the serial port
    serial.on('data', gotData);

    /////////// Setup general p5.js stuff ///////////
    createCanvas(width, height);
}//function setup


function draw() {
    background('rgba(0,122,122, 0.1)');

    if (data) {
        document.getElementById("text-value").innerHTML = data;
        circle(map(data, 0, 255, 0, width), height/2, 80);
    }//if

}//function draw

//////////////////// Serial Helper Functions ////////////////////
// Got the list of ports
function gotList(thelist) {
    // theList is an array of their names
    for (let i = 0; i < thelist.length; i++) {
        // Display in the console
        print(i + " " + thelist[i]);
    }//for i
}//function gotList

// There is data available to work with from the serial port
function gotData() {
    let inString = serial.readStringUntil('\r\n');
    // check to see that there's actually a string there:
    if (inString.length > 0) {
        // convert it to a number:
        data = Number(inString);
    }//if
}//function gotData
- She also shared a based code to programme on your board which of course i had to change since it was based on a analog phototransistor but i did got the idea how to use the code, will share my version down below from later in the week.
Since i only had digital data this visualization was very boring :) but it worked!
some basic P5 code:
void setup(){
}
//once at setup

//Should contain:

size (width, height);


void draw(){
}
 //loops for ever

//Should contain:

background(R,G,B) //then it stays as a background if you place it in setup you can "erase" it, painting

stroke(R,G,B)
fill(R,G,B)

rect(upperleftx,upperlefty,length, height)
ellipse(xcenter,ycemter,length, height)
Variables:
mouseX & mouseY
//Conditional statements in draw:
if(mousePressed){
    //when  pressed do this
}
else {
    //when not pressed do this
}
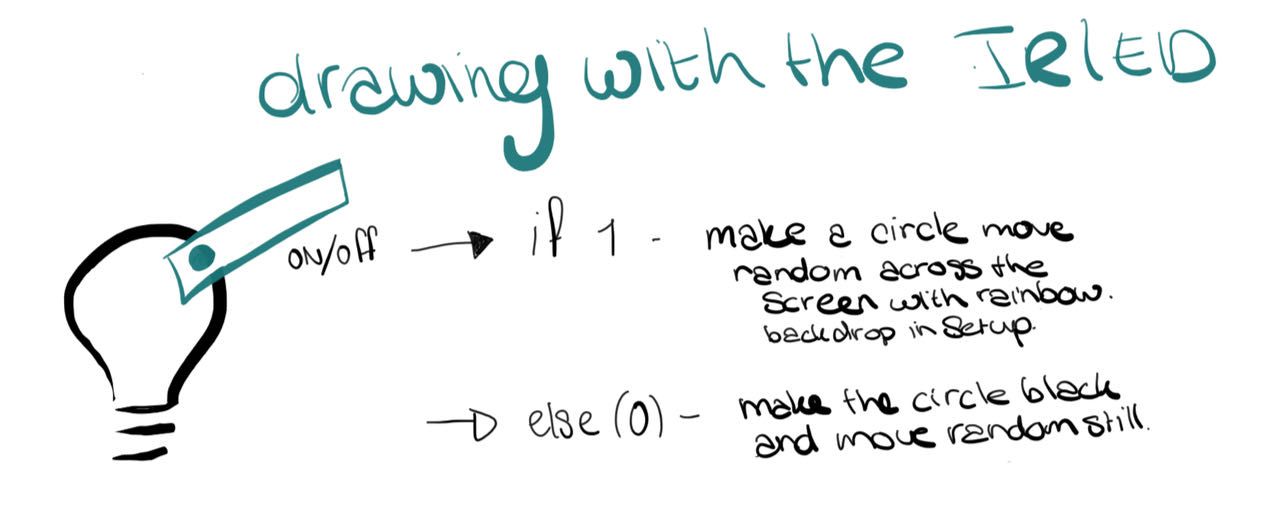
the application idea
I want to use the simple input of 1 and 0 into a complex visualization within my limitations of course.
Started with programming the Mama board with a basis random code just to see if the data would get through.
The dots are choosing a random size based on a range of 0 till the data which at this point was still the same for both sensors. Because it’s looping with a delay between the 2 sensors i does nothing when the time from the sensor that doesn’t get info is on.
Moving the sensors over black and reflection surfaces:
I spend some time on making the visuals as random as possible but still based on the data, for now this is it but if there is time i will investigate a bit further.
- the different sensors now give a different signal trough mapping which i used as an IF/ElSE statement in the script file
Basicly the one sensor creates a circle, size transparently and color based randomly on dat input, the other sensor does the same but outputs a square. This all in a loop, so when on of the sends not data it has a pause.
The screen only so you can see the data input clearer.
The “final” Arduino IDE code that i programmed my mama board with a ATTINY1614 with
// definitions

int REDLed = 10; //LED op mamaboard
int Sensor1 = 1; //sensor 1
int Sensor2 = 9; //sensor 2
int sensorValue1 = 0;
int sensorValue2 = 0;


void setup() {
  // Initialize serial communications at 9600 bps:
  Serial.begin(9600);
  while(!Serial);
  pinMode(REDLed, OUTPUT);
 pinMode(Sensor1, INPUT);
 pinMode(Sensor2, INPUT);
}//void setup

void loop() {
  sensorValue1 = digitalRead(Sensor1);

  int S1map_value = map(sensorValue1, 0, 1, 0, 100);

  Serial.println(S1map_value);

//for the red led sensor 1
  if (sensorValue1 == 0)               //if sensor reads 0
  {
      digitalWrite (REDLed, LOW);
  }
  else                              //if sensor reads anything else then 0
  {
    digitalWrite (REDLed, HIGH);
  }

delay(500);

sensorValue2 = digitalRead(Sensor2);

int S2map_value = map(sensorValue2, 0, 1, 0, 50);
  Serial.println(S2map_value);

   if (sensorValue1 == 0)               //if sensor reads 0
  {
      digitalWrite (REDLed, LOW);
  }
  else                              //if sensor reads anything else then 0
  {
    digitalWrite (REDLed, HIGH);
  }
  delay(500);
}//void loop
The “final” P5 Code that’s in the script.js file
let serial;
let data;

let width = 1280;
let height = 720;

var p = {
  x: 50,
  y: 50
};

//var size = 100

var col = {
  r: 0,
  g: 0,
  b: 0,
  a: 50
};


function setup() {

    // Instantiate our SerialPort object
    serial = new p5.SerialPort();

    // Assuming the board is connected, let's open the connection to it
    // Use the FTDI ID
    serial.open("/dev/tty.usbserial-D30A3T7W");

    /////// Register some callbacks ///////
    // When we connect to the underlying server
    serial.on('connected', () => { console.log("We are connected!"); });
    // When we get a list of serial ports that are available
    let portlist = serial.list();
    serial.on('list', gotList);
    // When or if we get an error
    serial.on('error', (err) => { console.log(err); });
    // When our serial port is opened and ready for read/write
    serial.on('open', () => { console.log("Serial Port is open!"); });
    // When we some data from the serial port
    serial.on('data', gotData);

    /////////// Setup general p5.js stuff ///////////

//makes the canvas on which we draw
    createCanvas(width, height);

//framerate to make it go faster or slower
    frameRate(30)

//the background color
    background(200);

}//function setup


function draw() {

//random placement within the height and width of size
    p.x=random(0,width)
    p.y=random(0,height)

// random size based on data
    size=random(0,data)

//randorm colors based on data
    col.r=random(0,data/2)
    col.g=random(0,data)
    col.b=random(data/2,255-data)


//random transparentie based on data
    col.a=random(data/2,200-data)

//no line on the outsides of the elements
    noStroke()

//fill the elements with this color:
    fill(col.r, col.g, col.b, col.a);

if (data==100) {
    document.getElementById("text-value").innerHTML = data;

//draw this rectangle
    rect(p.x, p.y, size/1.5, size/1.5);
}//if

else {
    document.getElementById("text-value").innerHTML = data;

//draw this circle
      circle(p.x, p.y, size, size);

    }//else

}//function draw

//////////////////// Serial Helper Functions ////////////////////

// Got the list of ports

function gotList(thelist) {

    // theList is an array of their names
    for (let i = 0; i < thelist.length; i++) {
        // Display in the console
        print(i + " " + thelist[i]);
    }//for i
}//function gotList

// There is data available to work with from the serial port
function gotData() {
    let inString = serial.readStringUntil('\r\n');
    // check to see that there's actually a string there:
    if (inString.length > 0) {
        // convert it to a number:
        data = Number(inString);
    }//if
}//function gotData
- was a fun week, happy i could finish week 14 and create a visualization
 - would have been great to have had a spare UPDI but making a new one was fun, everything takes so much time i always have the feeling i am “behind”.
- need to figure out how this works with my final project, updated my final project page with some new insights