Week 14
Interface & Application Programming

ASSIGNMENT
Write an application for the embedded board that interfaces a user with an input and/or output device. Document the design process, tools used, and the final working interface.
TOOLS
VS Code · HTML · CSS · JavaScript · ESP32 · MPU-6050 · GitLab Pages
Personal and Group Assignment
This week's personal assignment was to Write an application for the embedded board that you made. that interfaces a user with an input and/or output device(s)
Group Assignment
Here's the link to our group assignment of this week.
The Concept
Krypto Support -- A web app for IVDD monitoring
For this week's assignment I built the interface for my final project: a web application called Krypto Support that monitors the movement and activity of my dog Krypto, who has been diagnosed with Intervertebral Disc Disease (IVDD). The app connects wirelessly via WiFi to an ESP32 microcontroller with an MPU-6050 IMU sensor, reads real-time motion data, and presents it in a dashboard designed for both the dog's owner and the veterinarian treating the condition.
The input device is the MPU-6050 IMU sensor -- it captures acceleration and orientation data from Krypto's body. The embedded board is an ESP32 (and ultimately the XIAO ESP32-C6 in the final wearable), which processes the sensor data and serves it over WiFi. The application is the web dashboard that visualizes the data, detects impacts, tracks activity vs rest time, and generates a daily medical report that can be shared with the vet.
Why a web app?
A web app built with plain HTML, CSS and JavaScript requires no installation, runs on any device -- iPhone, Android, laptop -- and can be published instantly through GitLab Pages. For a wearable that needs to be accessed by both the dog's owner and a veterinarian in different locations, this is the most practical choice.
The ESP32 acts as a web server: it connects to the local WiFi network and exposes two
endpoints -- /datos
for the live sensor JSON and /reset
to clear the daily counters. The dashboard polls these endpoints every second using
the browser's Fetch API, with no backend or cloud service required.
My Process
00. Visual Design -- Canva Template
Before writing any code, I designed the visual identity of the app in Canva. This included defining the color palette, the logo concept, the layout of the main screens, and which metrics I wanted to show. Having a clear reference from the start made the coding process much faster -- I wasn't making design decisions in code, I was translating decisions already made visually.
The identity is built around Krypto's personality: the yellow ring references his characteristic collar, the green background his energy, and the blue is the primary brand color carried through all interactive elements. The font is bold and uppercase to give the app a strong, confident character.
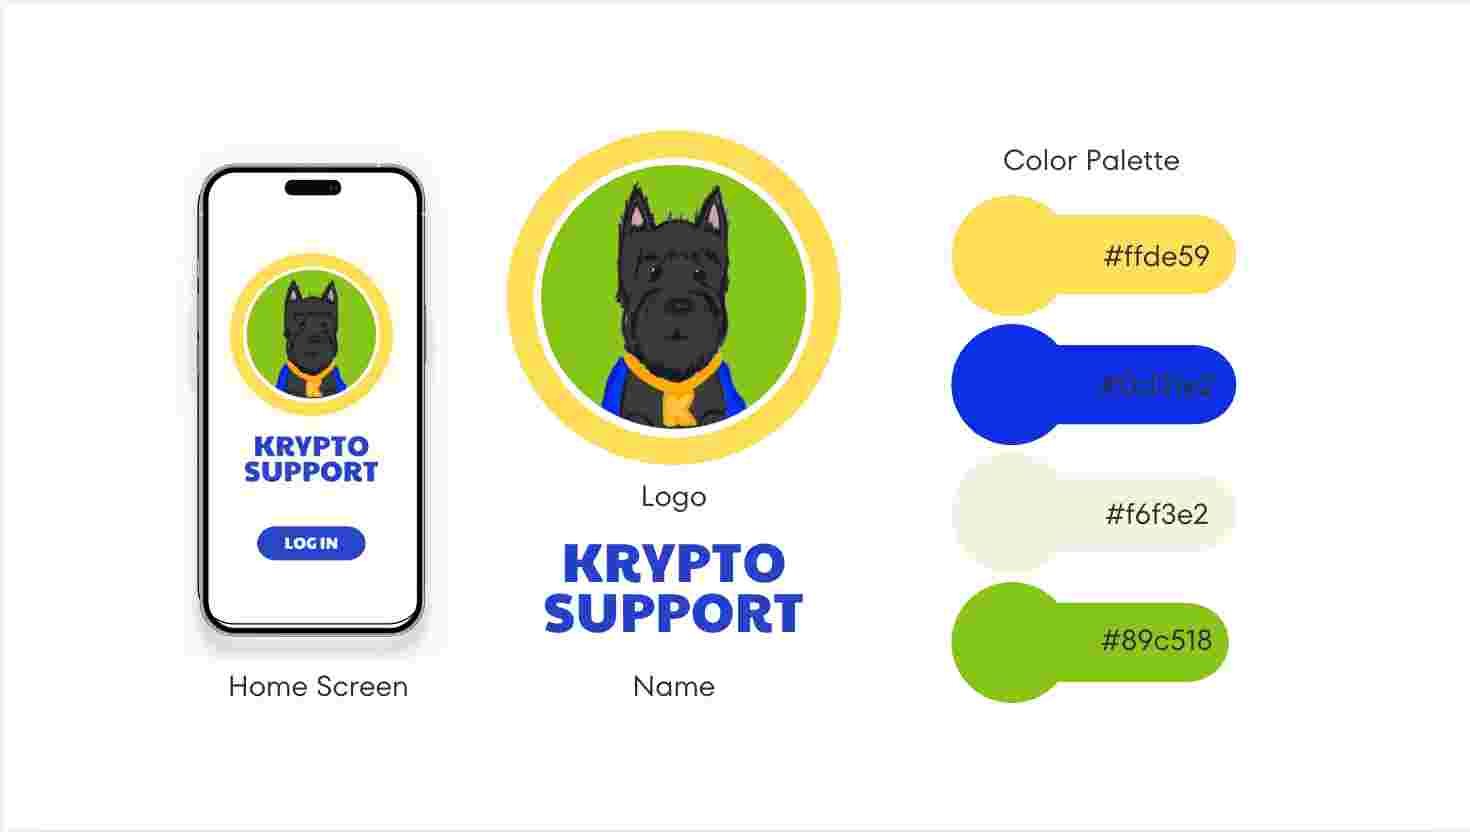
Brand identity & color palette
The four brand colors defined in Canva: yellow #ffde59, blue #0d31e2, cream #f6f3e2, and green #89c518. Each color has a specific role across the interface.
Screen layout template
The splash screen and dashboard layout sketched in Canva, showing the logo placement, metric cards, and the LOG IN button pinned to the bottom of the screen.
| Color | Hex | Role in the interface |
|---|---|---|
| Yellow | #ffde59 | Logo ring, impact markers in the chart, accent on buttons |
| Blue | #0d31e2 | Primary brand color -- header bar, pitch bar, LOG IN button, section titles |
| Cream | #f6f3e2 | App background -- warm, non-clinical feel for a pet health app |
| Green | #89c518 | Active state indicator, roll bar, download PDF button |
01. Embedded Code -- ESP32 Firmware
The ESP32 firmware handles three tasks: reading the MPU-6050 IMU sensor over I2C,
processing the raw data with a complementary filter to compute pitch and roll angles,
and serving the processed data as JSON over WiFi. The board exposes two HTTP endpoints:
/datos returns
the live sensor JSON, and /reset
clears the daily counters.
I2C Scanner -- verify MPU-6050 is detected
Upload this sketch first to confirm the sensor is wired correctly. Open Serial Monitor at 115200 baud and press the EN/RST button -- you should see Dispositivo encontrado en 0x68.
#include <Wire.h>

void setup() {
  Serial.begin(115200);
  delay(3000);
  Wire.begin(21, 22); // SDA=21, SCL=22 on ESP32 Dev Module
  Serial.println("Escaneando I2C...");

  for (byte i = 8; i < 120; i++) {
    Wire.beginTransmission(i);
    if (Wire.endTransmission() == 0) {
      Serial.print("Dispositivo encontrado en 0x");
      Serial.println(i, HEX);
    }
  }
  Serial.println("Listo.");
}

void loop() {}
Full firmware -- WiFi server + MPU-6050 + complementary filter
This is the complete firmware uploaded to the ESP32. It initializes the MPU-6050 over I2C, connects to WiFi, and serves sensor data as JSON. The complementary filter combines accelerometer and gyroscope readings for stable pitch/roll angles. After uploading, open Serial Monitor at 115200 baud -- the board prints its IP address once connected to WiFi.
// Libraries
#include <Wire.h>        // I2C communication with MPU-6050
#include <MPU6050.h>     // MPU-6050 sensor library
#include <WiFi.h>       // WiFi connection
#include <WebServer.h>  // HTTP server to serve JSON data

// WiFi credentials -- replace with your network
const char* ssid     = "YOUR_WIFI";
const char* password = "YOUR_PASSWORD";

// Sensor and server objects
MPU6050 mpu(0x68);       // MPU-6050 at I2C address 0x68
WebServer server(80);    // HTTP server on port 80

// ---- Processed sensor data ----
float pitch = 0, roll = 0;   // Filtered angles (degrees)
float accelMag = 0;           // Acceleration magnitude (g)
unsigned long tiempoAnterior = 0;

// ---- Daily tracking counters ----
int   impactos       = 0;    // Number of impacts above threshold
long  segundosActivo = 0;    // Active time (seconds)
long  segundosReposo = 0;    // Rest time (seconds)
float pitchPromedio  = 0;    // Running average posture angle
int   muestrasTotal  = 0;
bool  estaActivo     = false;

// ---- Thresholds ----
const float UMBRAL_IMPACTO = 2.5;  // Impact detection (g)
const float UMBRAL_ACTIVO  = 0.3;  // Movement detection (g)

void setup() {
  Serial.begin(115200);
  Wire.begin(21, 22);   // I2C pins: SDA=21, SCL=22
  mpu.initialize();       // Wake up the MPU-6050

  // Connect to WiFi
  WiFi.begin(ssid, password);
  Serial.print("Conectando WiFi");
  while (WiFi.status() != WL_CONNECTED) {
    delay(500); Serial.print(".");
  }
  Serial.println("\nIP: " + WiFi.localIP().toString());

  // ---- Endpoint: /datos ----
  // Returns all sensor data as JSON
  server.on("/datos", HTTP_GET, []() {
    String json = "{";
    json += "\"pitch\":"      + String(pitch, 1)         + ",";
    json += "\"roll\":"       + String(roll, 1)          + ",";
    json += "\"accel\":"      + String(accelMag, 2)      + ",";
    json += "\"impactos\":"   + String(impactos)          + ",";
    json += "\"activo\":"     + String(segundosActivo)    + ",";
    json += "\"reposo\":"     + String(segundosReposo)    + ",";
    json += "\"posturaAvg\":" + String(pitchPromedio, 1)  + ",";
    json += "\"estaActivo\":" + String(estaActivo ? "true" : "false");
    json += "}";
    server.sendHeader("Access-Control-Allow-Origin", "*");
    server.send(200, "application/json", json);
  });

  // ---- Endpoint: /reset ----
  // Resets all daily counters to zero
  server.on("/reset", HTTP_GET, []() {
    impactos = segundosActivo = segundosReposo = muestrasTotal = 0;
    pitchPromedio = 0;
    server.sendHeader("Access-Control-Allow-Origin", "*");
    server.send(200, "text/plain", "OK");
  });

  server.begin();
  tiempoAnterior = millis();
}

void loop() {
  server.handleClient();

  // ---- Read raw sensor data ----
  int16_t ax, ay, az, gx, gy, gz;
  mpu.getMotion6(&ax, &ay, &az, &gx, &gy, &gz);

  unsigned long ahora = millis();
  float dt = (ahora - tiempoAnterior) / 1000.0;
  tiempoAnterior = ahora;

  // ---- Complementary filter ----
  // Combines accelerometer (stable, noisy) with
  // gyroscope (smooth, drifts) for accurate angles
  float ap = atan2(ay, az) * 180.0 / PI;
  float ar = atan2(-ax, az) * 180.0 / PI;
  pitch = 0.98 * (pitch + (gx / 131.0) * dt) + 0.02 * ap;
  roll  = 0.98 * (roll  + (gy / 131.0) * dt) + 0.02 * ar;

  // ---- Acceleration magnitude in g ----
  accelMag = sqrt(
    pow(ax / 16384.0, 2) +
    pow(ay / 16384.0, 2) +
    pow(az / 16384.0, 2)
  );

  // ---- Impact detection ----
  if (accelMag > UMBRAL_IMPACTO) impactos++;

  // ---- Activity tracking ----
  float mov = abs(accelMag - 1.0);
  estaActivo = mov > UMBRAL_ACTIVO;
  if (estaActivo) segundosActivo++;
  else            segundosReposo++;

  // ---- Running average posture ----
  muestrasTotal++;
  pitchPromedio += (pitch - pitchPromedio) / muestrasTotal;

  delay(100);
}
02. Web App -- Dashboard Code
The complete web application lives in a single index.html file
containing HTML, CSS and JavaScript. I built it in VS Code with the Live Server extension
for real-time preview. The app has four screens managed by a show/hide system, and the
Krypto logo is embedded as base64 so the file is fully self-contained.
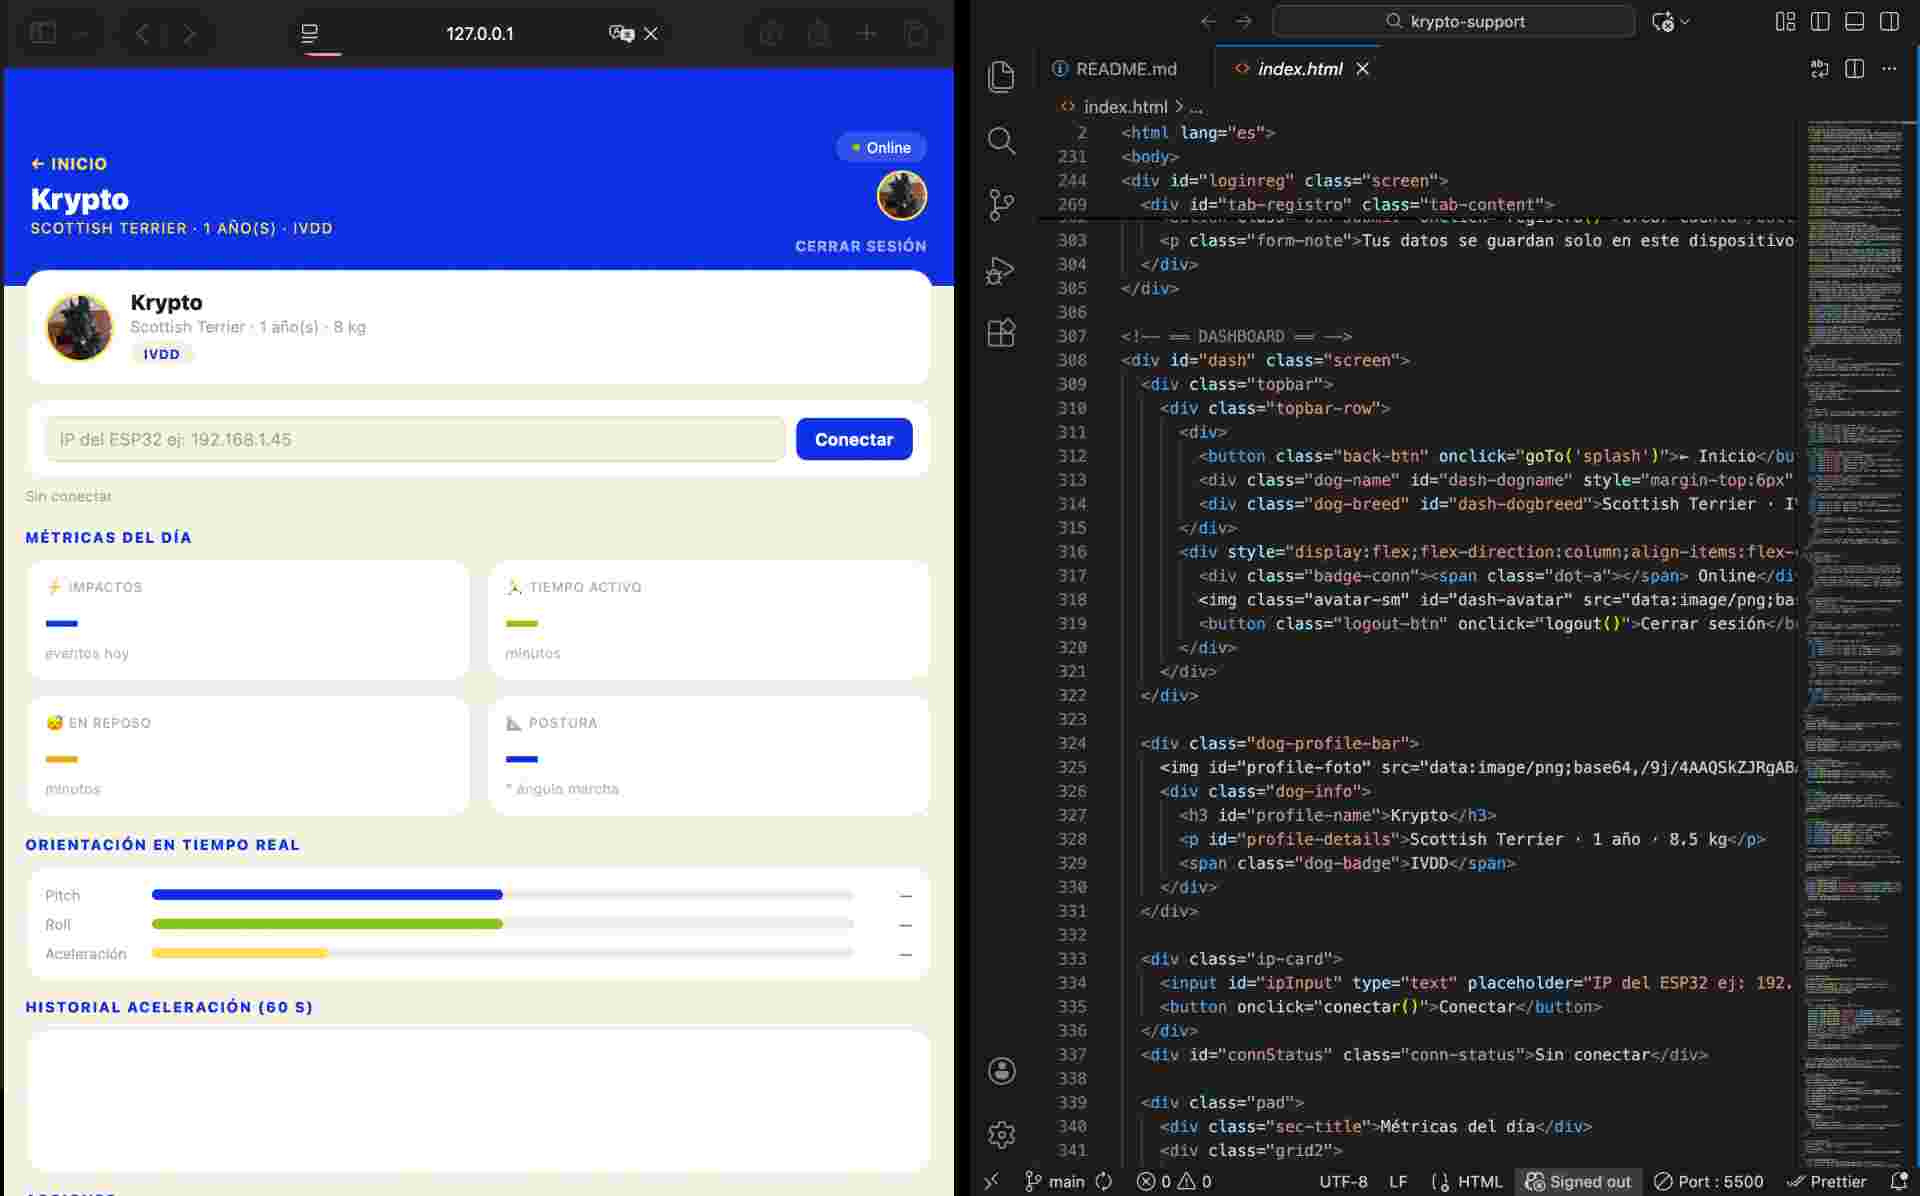
VS Code with Live Server
The index.html open in VS Code with the Live Server preview running in Chrome. Changes to the code reflect immediately in the browser without manual refresh.
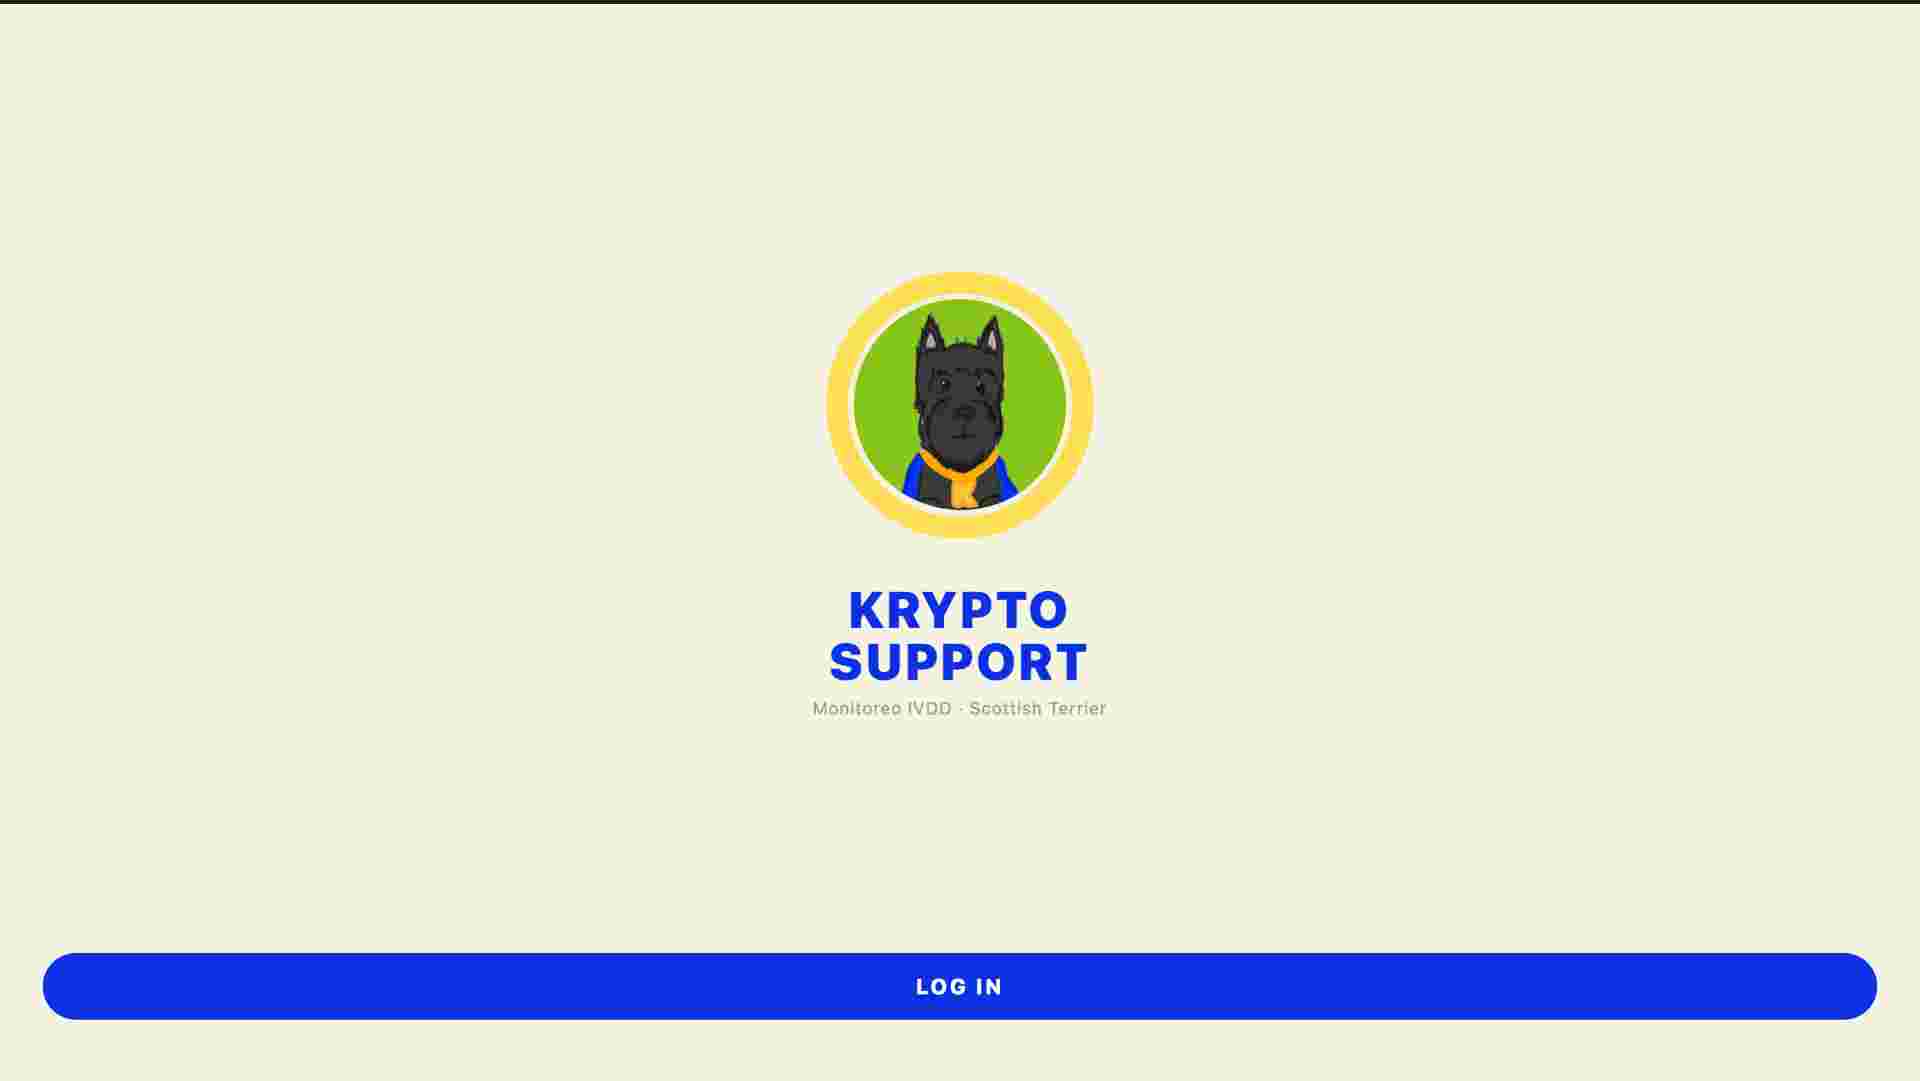
Splash screen
The opening screen with the Krypto logo, app name in bold uppercase blue, and the LOG IN button anchored to the bottom of the screen -- matching the Canva template exactly.
HTML structure -- screen navigation
The app is organized into three screens. Only one is visible at a time. The goTo(id) function handles all transitions.
<!-- Screen 1: Splash -->
<div id="splash" class="screen active">
  <img class="logo-img" src="data:image/png;base64,..."/>
  <div class="app-name">Krypto<br>Support</div>
  <button onclick="goTo('loginreg')">LOG IN</button>
</div>

<!-- Screen 2: Login / Register -->
<div id="loginreg" class="screen">
  <!-- Two tabs: login + registration -->
  <!-- Registration collects: name, email, password -->
  <!-- Pet profile: name, breed, age, weight, photo -->
</div>

<!-- Screen 3: Dashboard -->
<div id="dash" class="screen">
  <!-- Blue header with dog name and connection status -->
  <!-- IP input field to connect to ESP32 -->
  <!-- 4 metric cards: impacts, active, rest, posture -->
  <!-- Orientation bars: pitch, roll, acceleration -->
  <!-- 60s acceleration chart (Canvas API) -->
  <!-- Actions: reset day + generate PDF report -->
</div>
JavaScript -- fetching ESP32 data and updating UI
The dashboard polls the ESP32 every second using the Fetch API and updates all UI elements -- metric cards, orientation bars, and the acceleration chart -- without reloading the page.
// Poll ESP32 every second and update the UI
async function obtener() {
  try {
    const r = await fetch(`http://${IP}/datos`);
    const d = await r.json();

    // Update metric cards
    document.getElementById('impactos').textContent = d.impactos;
    document.getElementById('activo').textContent   = Math.floor(d.activo / 60);
    document.getElementById('reposo').textContent   = Math.floor(d.reposo / 60);
    document.getElementById('postura').textContent  = parseFloat(d.posturaAvg).toFixed(1);

    // Update orientation bars (pitch, roll, accel)
    barra('bPitch', 'vPitch', d.pitch, -90, 90, 'deg');
    barra('bRoll',  'vRoll',  d.roll,  -90, 90, 'deg');
    barra('bAccel', 'vAccel', d.accel,   0,  4, ' g');

    // Push to acceleration history chart
    hist.push(parseFloat(d.accel));
    if (hist.length > MAX) hist.shift();
    dibujar();
  } catch(e) {
    document.getElementById('connStatus').textContent = 'No connection';
  }
}
setInterval(obtener, 1000);
JavaScript -- acceleration chart with Canvas API
The acceleration history chart is drawn frame by frame using the HTML Canvas API. Impact events above 2.5g are highlighted as yellow dots with a blue outline.
function dibujar() {
  if (!canvas) return;
  canvas.width = canvas.offsetWidth;
  ctx.clearRect(0, 0, canvas.width, canvas.height);
  const w = canvas.width / MAX;

  // Reference line at 1g (stationary)
  const y1 = canvas.height - (1 / 4) * canvas.height;
  ctx.strokeStyle = '#e0dcc8'; ctx.setLineDash([4, 4]);
  ctx.beginPath(); ctx.moveTo(0, y1); ctx.lineTo(canvas.width, y1); ctx.stroke();
  ctx.setLineDash([]);

  // Draw acceleration line (blue)
  ctx.strokeStyle = '#0d31e2'; ctx.lineWidth = 2;
  ctx.beginPath();
  hist.forEach((v, i) => {
    const x = i * w;
    const y = canvas.height - (Math.min(v, 4) / 4) * canvas.height;
    i === 0 ? ctx.moveTo(x, y) : ctx.lineTo(x, y);
  });
  ctx.stroke();

  // Impact dots -- yellow fill, blue outline
  hist.forEach((v, i) => {
    if (v > 2.5) {
      ctx.fillStyle = '#ffde59';
      ctx.beginPath();
      ctx.arc(i * w, canvas.height - (Math.min(v, 4) / 4) * canvas.height, 4, 0, Math.PI * 2);
      ctx.fill();
      ctx.strokeStyle = '#0d31e2'; ctx.stroke();
    }
  });
}
JavaScript -- PDF report with jsPDF
The PDF is generated entirely client-side using the jsPDF library. It includes the pet profile pulled from localStorage, the day's metrics, and a color-coded clinical analysis section.
function descargarPDF() {
  const { jsPDF } = window.jspdf;
  const doc = new jsPDF({ orientation: 'portrait', unit: 'mm', format: 'a4' });
  const user = JSON.parse(localStorage.getItem('ks-user') || '{}');

  // Blue header
  doc.setFillColor(13, 49, 226);
  doc.rect(0, 0, 210, 40, 'F');
  doc.setTextColor(255, 255, 255);
  doc.setFontSize(22); doc.setFont('helvetica', 'bold');
  doc.text('KRYPTO SUPPORT', 18, 17);

  // Pet profile card
  doc.setFillColor(246, 243, 226);
  doc.roundedRect(18, 48, 174, 24, 3, 3, 'F');
  doc.setTextColor(13, 49, 226);
  doc.text(user.dogname || 'Krypto', 22, 62);

  // Save as dated file
  doc.save('Krypto_Reporte_' + new Date().toISOString().slice(0, 10) + '.pdf');
}
App features
The finished app has four screens: a splash screen, a login/registration screen where
the owner enters their details and the pet's profile (name, breed, age, weight, and photo),
the main dashboard with live metrics, and a PDF report generator. User data is saved
in localStorage so
the app remembers the session and skips directly to the dashboard on subsequent visits.
The PDF report is generated client-side using jsPDF -- no server needed. It includes the pet profile, daily metrics, a clinical analysis section with color-coded alerts, and a footer with the Fab Academy project credit.
03. The Interface
The dashboard is designed for mobile-first use -- the dog's owner checks it from their phone while Krypto is wearing the sensor. The layout follows the brand identity defined in Canva: cream background, blue header bar, yellow accents, and bold uppercase typography.
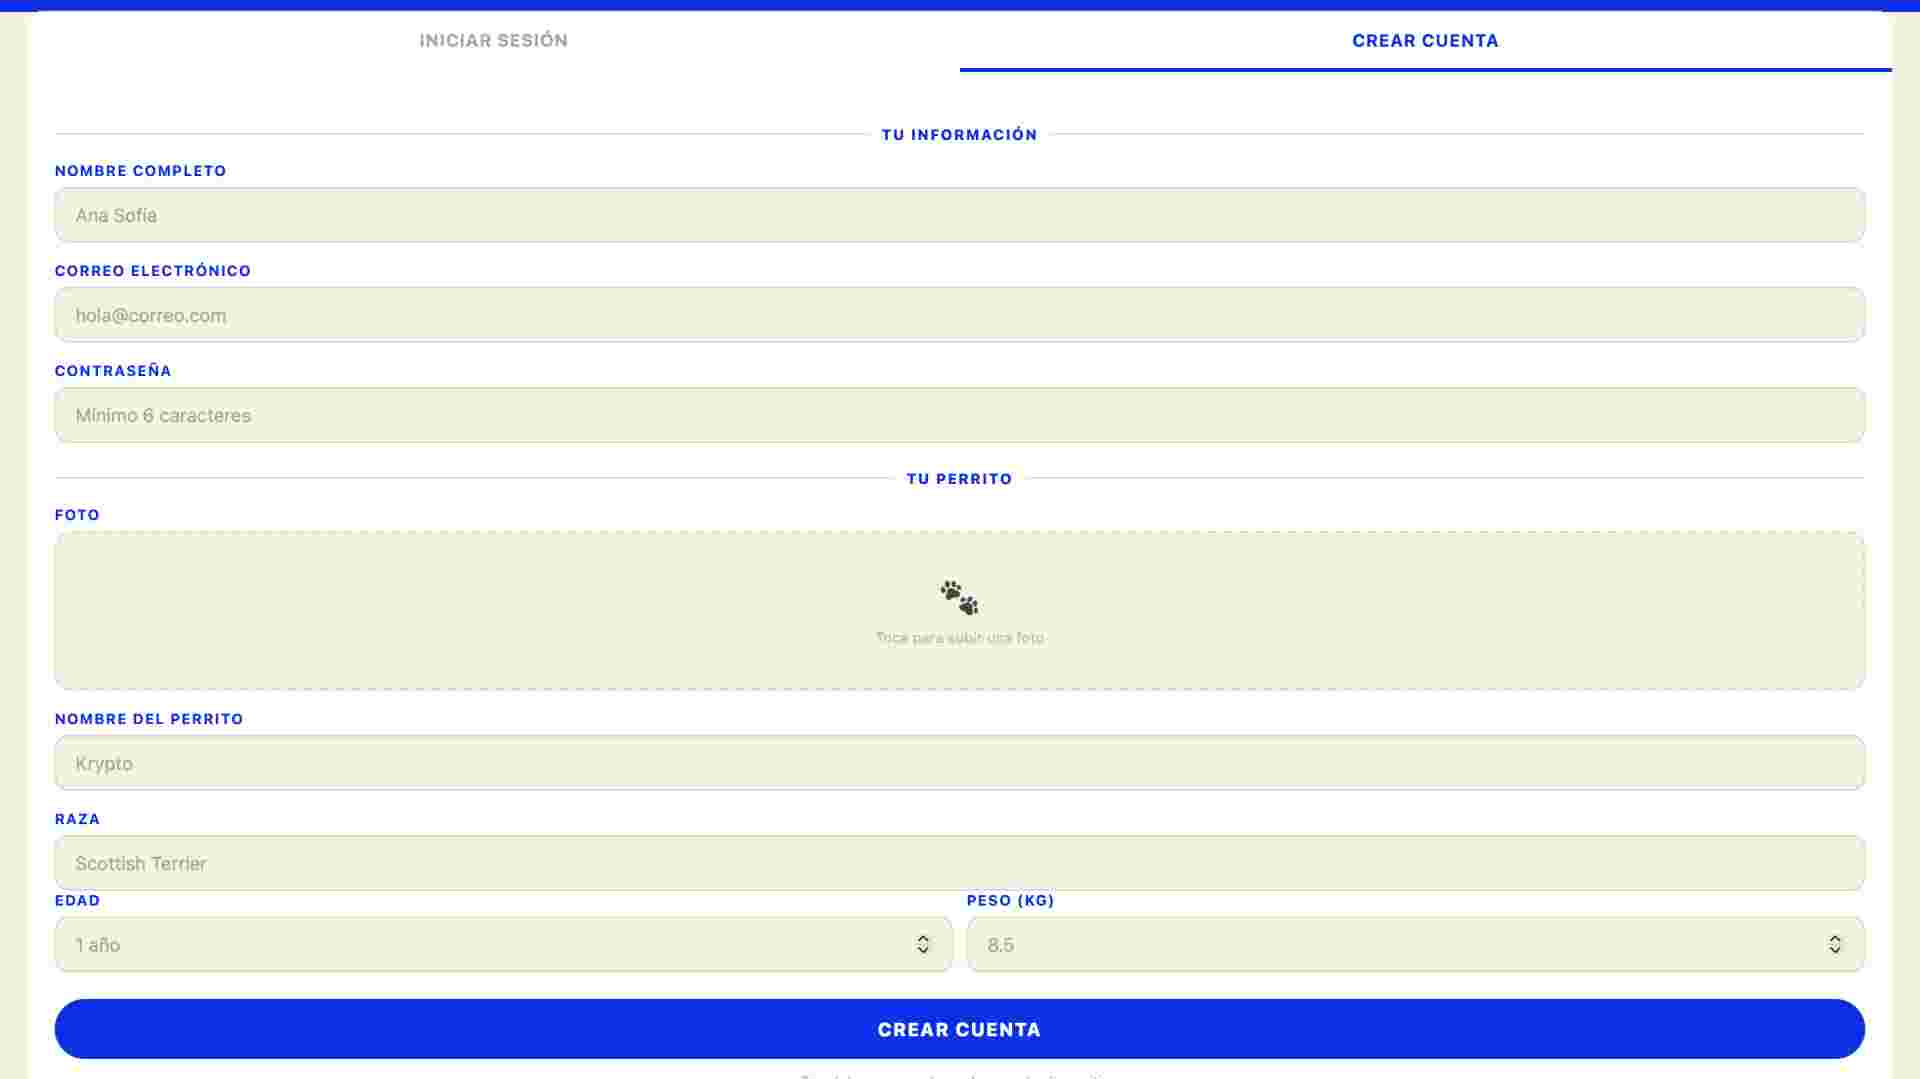
Login / Registration
Two-tab screen: existing users log in with email and password, new users register their profile and their pet's details including a photo.
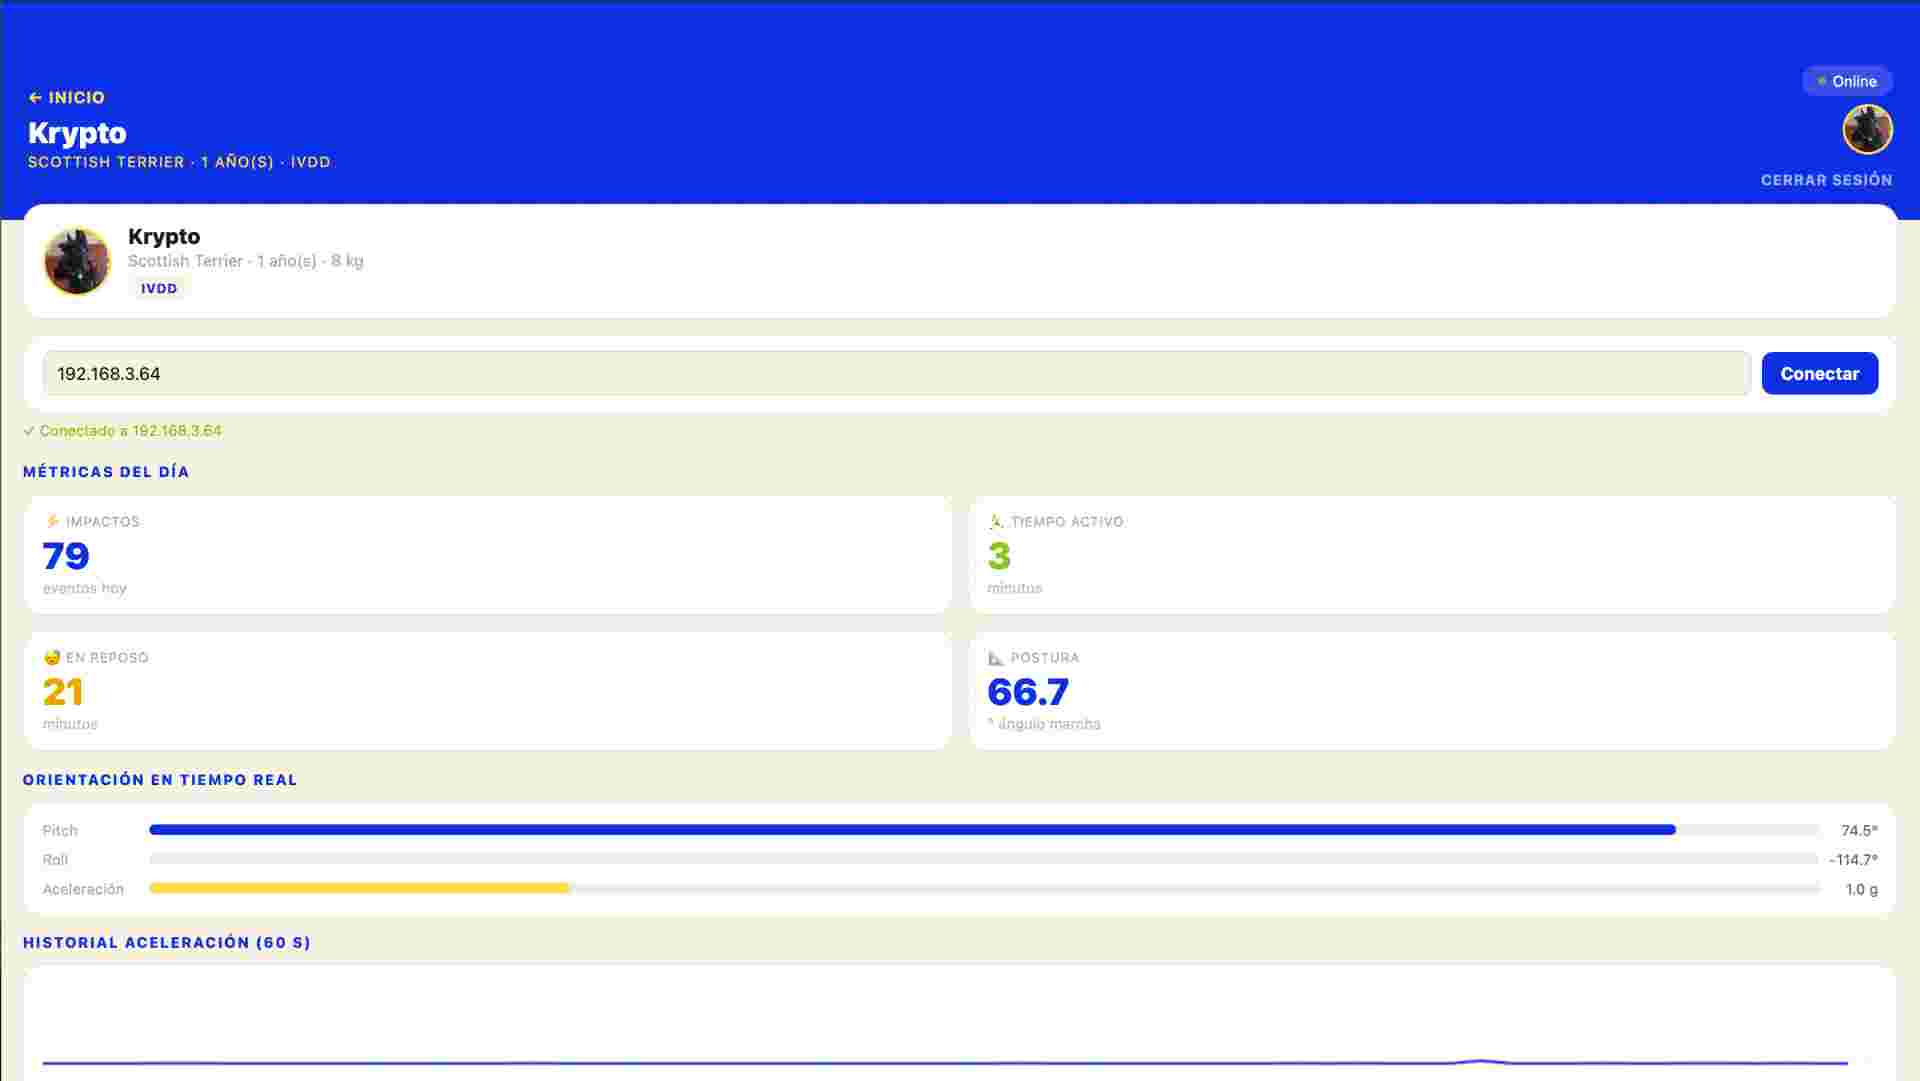
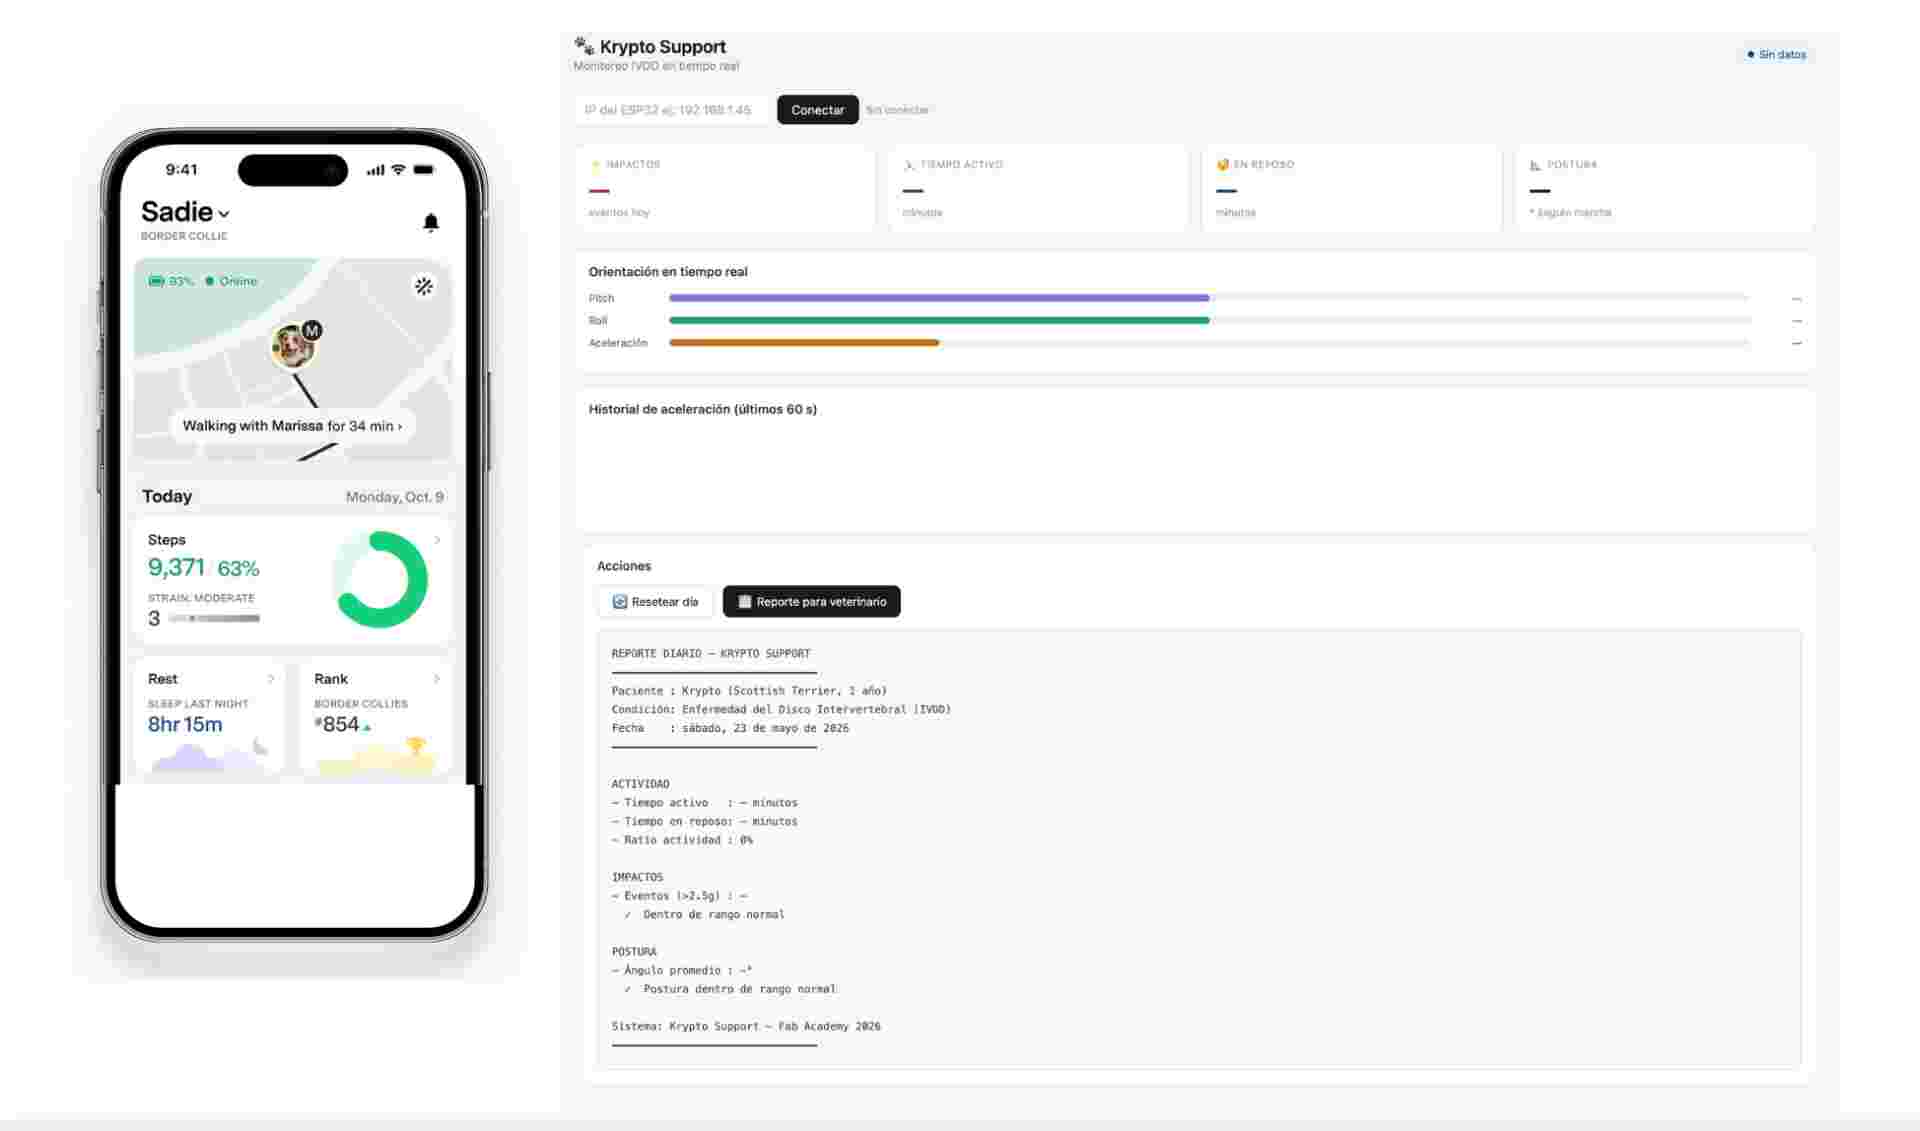
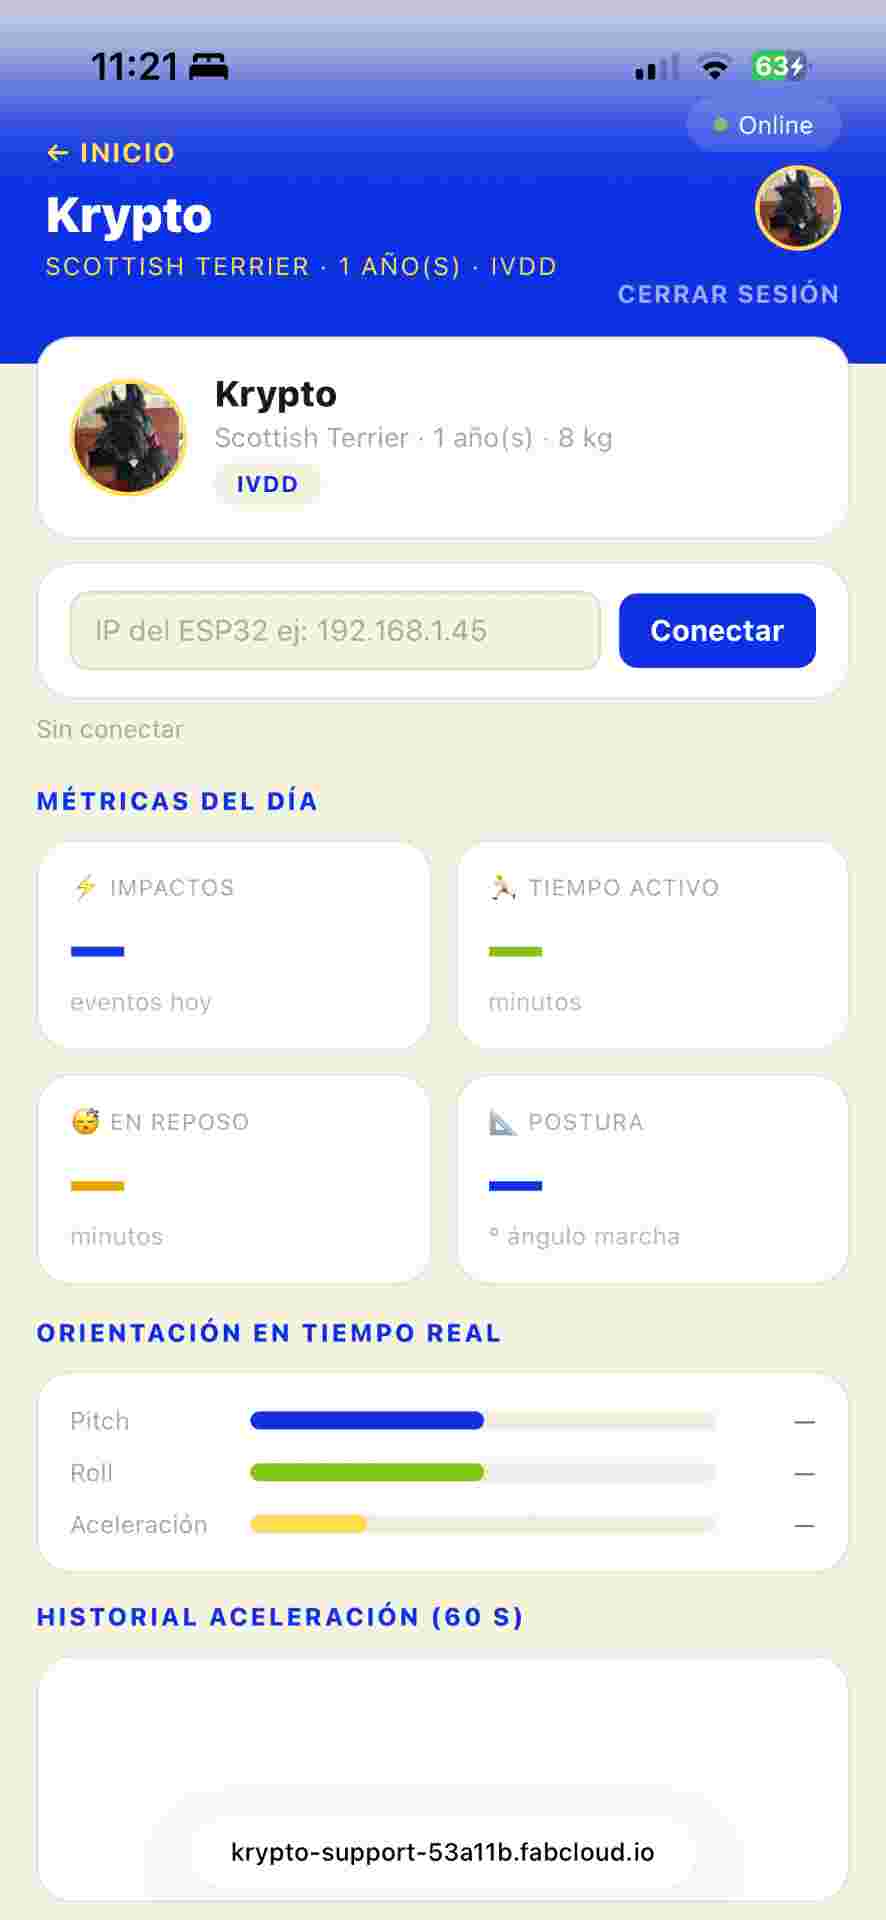
Live dashboard
Four metric cards showing impacts, active time, rest time, and average posture angle. Orientation bars update in real time from the IMU data.
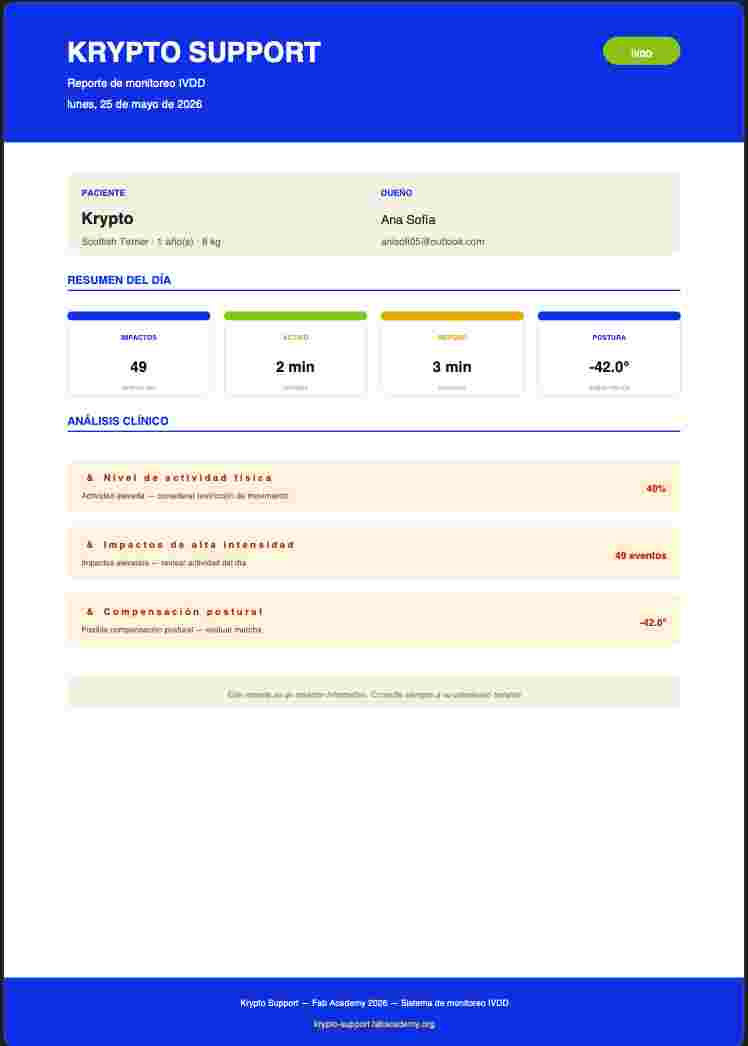
PDF report
One-tap report generation with the pet profile, daily metrics, and a clinical analysis section with automatic alerts for elevated impacts or abnormal posture.
| Metric | Source | Clinical relevance for IVDD |
|---|---|---|
| Impacts (>2.5g) | Accelerometer magnitude spike | High-impact events stress the intervertebral discs directly |
| Active time | Movement threshold on accel mag | Tracks whether the dog is respecting prescribed rest periods |
| Rest time | Near-zero acceleration | Confirms recovery time after episodes or surgery |
| Posture angle | Pitch average (complementary filter) | Sustained abnormal angles may indicate postural compensation due to pain |
04. Publishing -- GitLab Pages
Once the interface was complete and tested locally with Live Server, I published it through GitLab Pages so it can be accessed from any device -- not just the development computer. The repository already existed as part of the Fab Academy GitLab instance, so publishing only required adding a pipeline configuration file.
- 1Pushed
index.htmlto thekrypto-supportrepository on GitLab - 2Added a
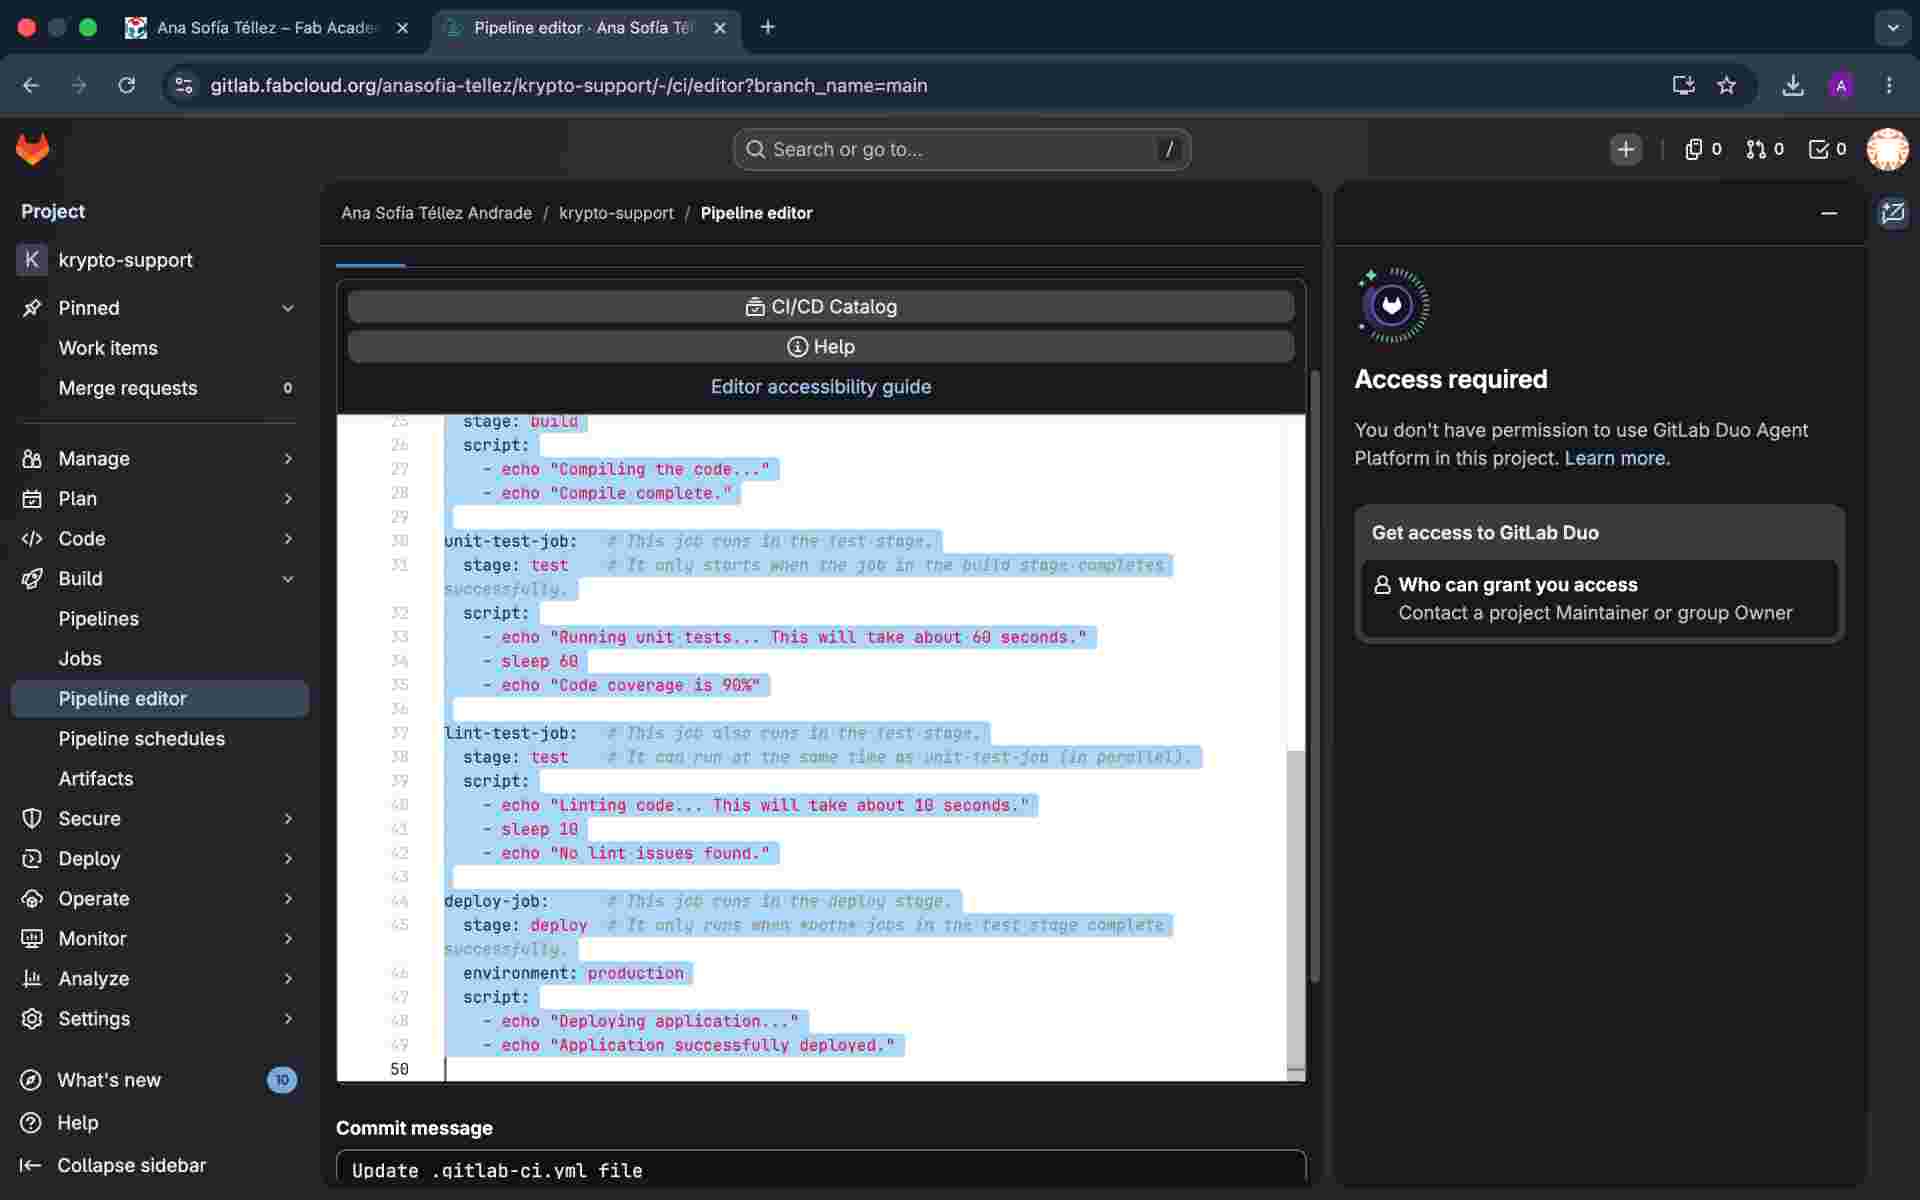
.gitlab-ci.ymlpipeline file via the Pipeline Editor - 3The pipeline ran automatically, copying the file into a
public/folder and deploying it - 4Opened the published URL on iPhone Safari and tested the connection to the ESP32
- 5Added to iPhone home screen as a PWA -- it installs like a native app with no App Store
# .gitlab-ci.yml -- GitLab Pages deploy
pages:
  stage: deploy
  script:
    - mkdir public
    - cp index.html public/index.html
  artifacts:
    paths:
      - public
  only:
    - main
GitLab pipeline -- green
The CI/CD pipeline completed successfully. The green checkmark confirms the site was deployed and is live at the GitLab Pages URL.
Connected on iPhone
The app open in Safari on iPhone, connected to the ESP32 on the same WiFi network. The dashboard shows live data from the MPU-6050 sensor.
PWA -- installing as a native app
The app includes the necessary meta tags for iOS to treat it as a Progressive Web App. From Safari, tapping Share then Add to Home Screen installs it with the Krypto logo as the icon and opens it without the browser chrome -- it looks and feels like a native app. No App Store, no Xcode, no developer account required.
The one constraint is that the ESP32 connection only works when the phone is on the same WiFi network as the sensor. The login, profile, and PDF report features work from anywhere since they run entirely in the browser using localStorage.
05. Demo -- App in action
The following video shows the full workflow: the ESP32 connected to the MPU-6050, the dashboard loading on iPhone, the live metrics updating as the sensor moves, and the PDF report being generated and downloaded.
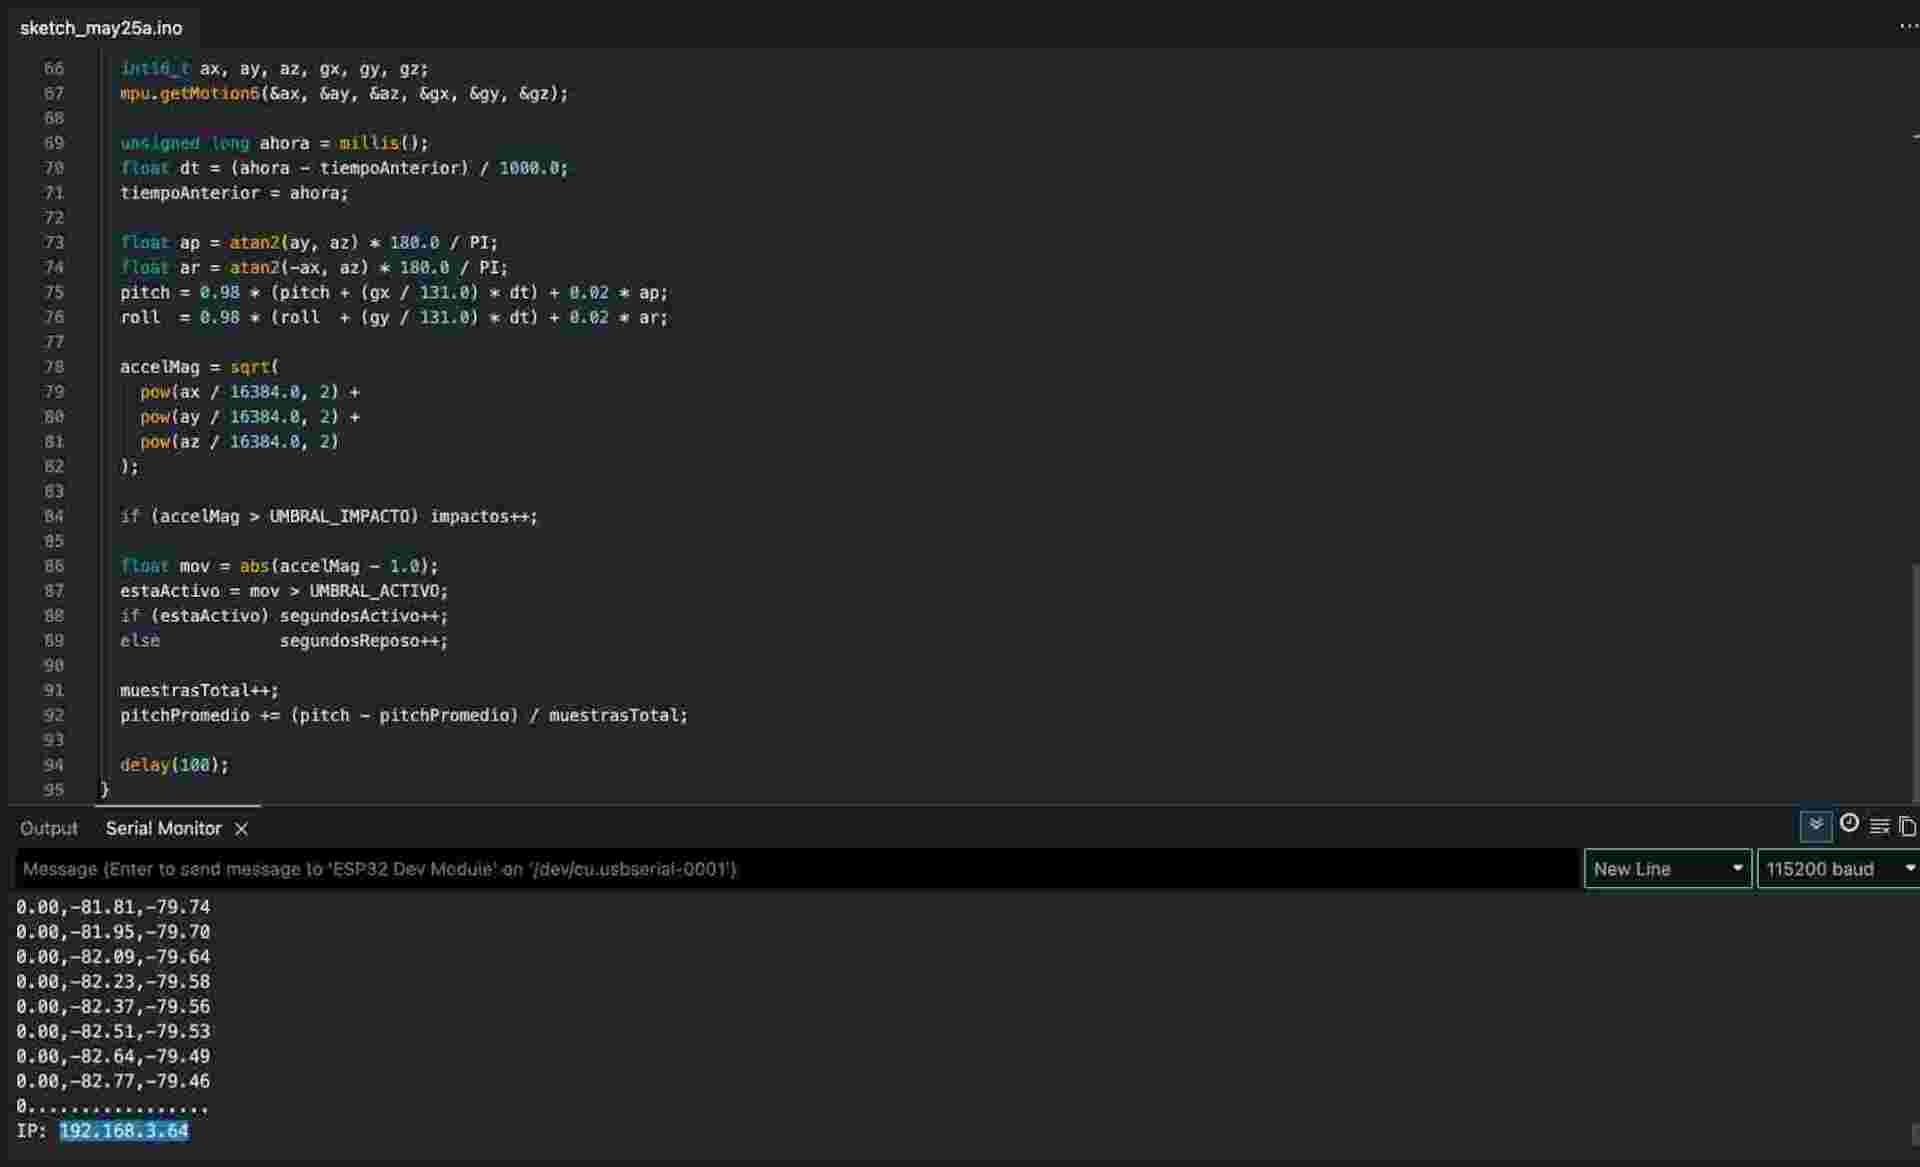
ESP32 sending data
Serial Monitor showing the IP address assigned to the ESP32 after connecting to WiFi. This IP is entered in the dashboard to start the live feed.
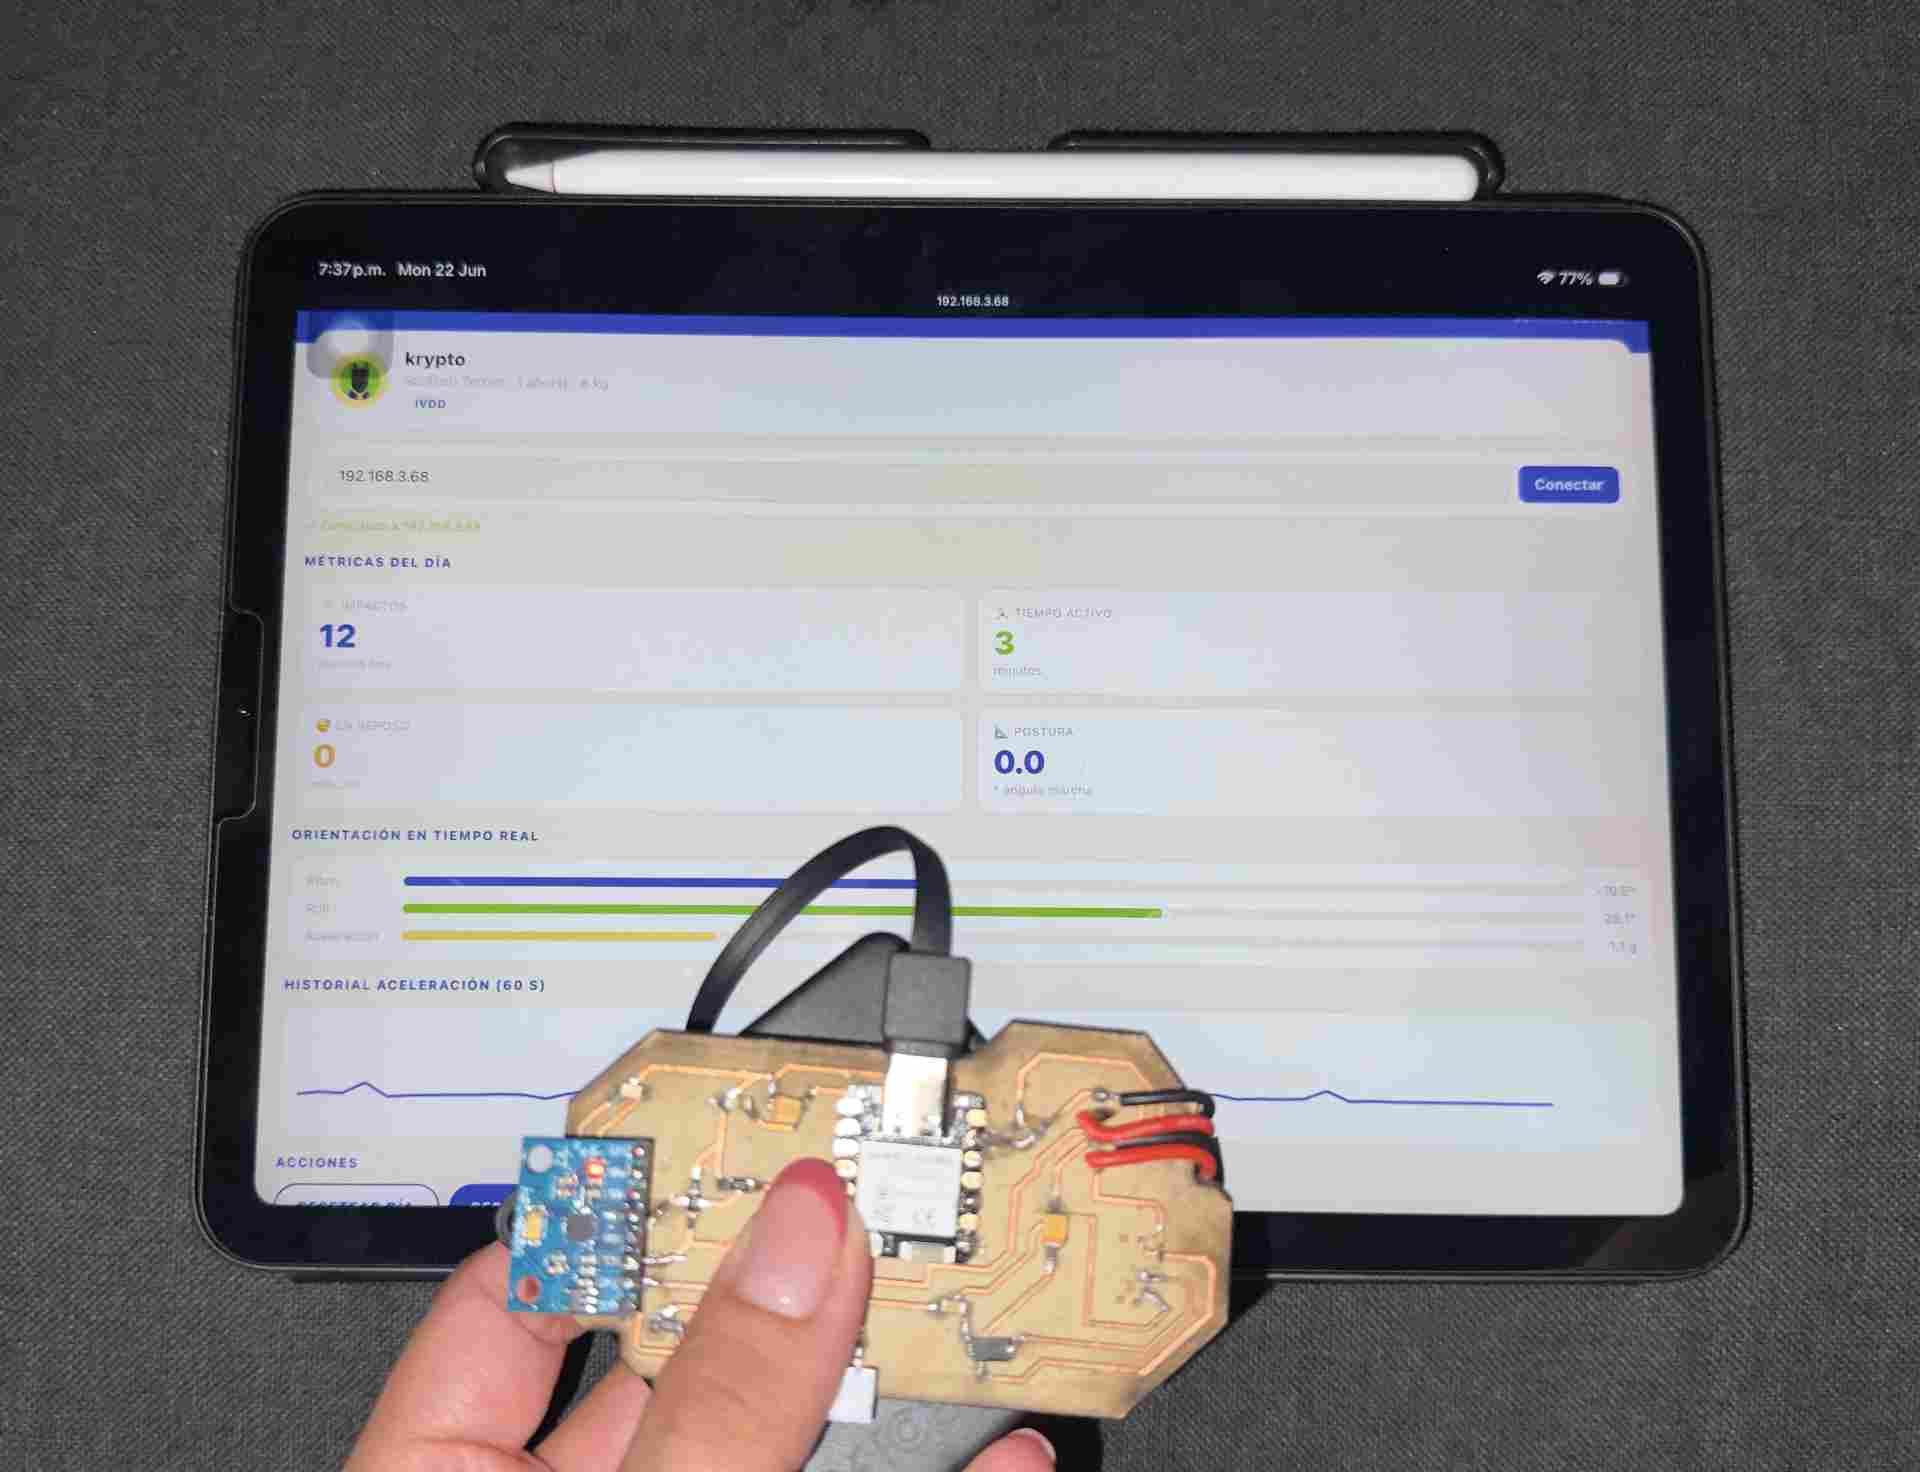
Live data on external device
The dashboard open on iPhone Safari, connected to the ESP32. The metric cards and orientation bars update every second as the sensor moves.
06. Board Interaction
This video shows the physical ESP32 board connected to the MPU-6050 sensor responding in real time. As the sensor is tilted, shaken and moved, the dashboard on the phone updates the pitch, roll, acceleration values and impact counter simultaneously.