Week 15
Interface and Application Programming
Contents
On holidays from 1st to 17th May.
Starting Point
My starting point for this week was clearly influenced by my background as a web designer and developer. I am used to working with interfaces, user experience, and information visualization, but mainly in web environments, using technologies such as HTML, CSS, and JavaScript.
For this reason, the concept of Interface and Application Programming was not completely new to me from a conceptual point of view. However, the interesting part of this week was bringing that knowledge into the context of hardware and embedded systems, where interaction does not only happen on a screen, but also with physical devices.
In previous weeks, I had already worked with different elements that became a useful starting point for this assignment. During the W11 Networking and Communications week, I created a web interface to control LEDs from a browser using a web server running on the ESP32. Later, during the W09 Input Devices week, I used a temperature and humidity sensor to read data from my board.
Based on these previous experiences, my starting point was to combine both approaches: creating user interfaces and interacting with physical devices. The goal was to explore different ways of connecting these two worlds, comparing tools such as web interfaces, Processing applications, and potentially mobile apps.
Although my natural first choice would have been to work directly with a web interface, I also wanted to explore tools such as Processing. This helped me move a bit outside my comfort zone and better understand how to design interfaces beyond the traditional web environment.
In short, my starting point was not really learning what an interface is, but understanding how to design and program one when the user interacts with a real physical system.
Group assignment
This week and next I'm on vacation and away from home, so I'll be doing the group part individually and documenting it here.
Compare as many tool options as possible.
Therefore, I'm going to compare different interface programming tools using my PCB, which physically includes two LEDs (and two buttons). The goal will be to control them from different user interfaces.
My PCB


This way, I can compare the differences between the tools, their typical use cases, workflows, and communication methods.
The tools I've selected are:
- Web interface: control through a browser using Wi-Fi communication.
- Processing: control through a desktop application using serial communication.
- MIT App Inventor: control through a mobile application using Bluetooth/BLE.
Web interface
For this part of the project, I decided to continue developing one of the programs I had already created during W11 Networking and Communications week. In that previous exercise, by placing an ESP32-C6 on my own PCB, I was able to display the state of the buttons and LEDs in a web browser, using a web server running directly on the microcontroller. It was also possible to interact with the board by turning the LEDs on and off from the same web interface.
However, in this new iteration I made an important change in the way the web interface communicates with the board.
One of the main problems with the previous version (on Week11) was that the page used an automatic refresh every second using meta refresh. This was useful enough for the networking week, but in practice it created some issues. The page was constantly reloading, and sometimes, when I pressed a button from the web interface, the action was not executed correctly because the page was refreshing at the same time.
To solve this problem, I removed the automatic refresh completely and replaced it with asynchronous communication using JavaScript, through fetch/AJAX. Instead of reloading the whole page, each button now sends a direct request to the ESP32 only when it is pressed.
This change improves the interface in several ways:
- The response is much faster and more reliable.
- The page no longer needs to reload constantly.
- The interface behaves more like a real interactive application.
- Network traffic and resource usage are reduced.
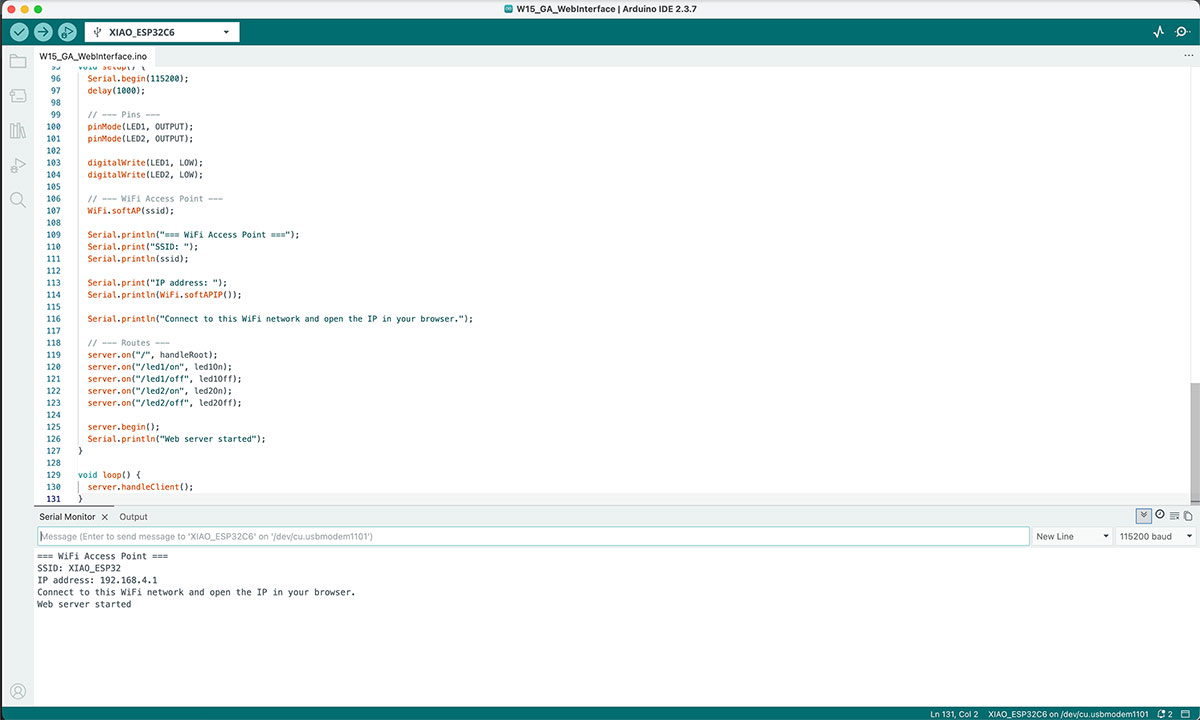
Once the code is uploaded and running on the ESP32-C6, the Serial Monitor shows the connection information, including the WiFi network created by the board and its IP address. I also improved this part compared to the Week 11 version, making the information clearer and easier to follow.
Arduino code · W15_GA_WebInterface.ino Show code
In my case, the Serial Monitor shows the following output:
SSID: XIAO_ESP32
IP address: 192.168.4.1
Connect to this WiFi network and open the IP in your browser.
Web server started
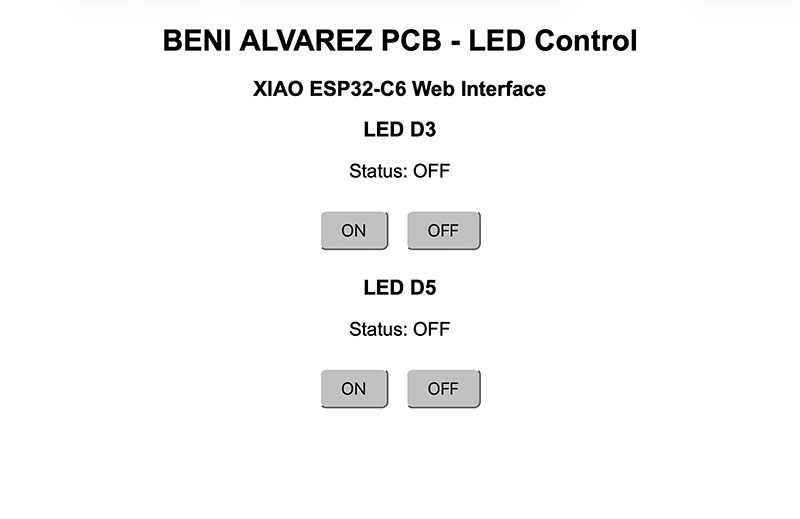
From this point, the workflow is very simple: I only need to connect any device to the WiFi network shown in the Serial Monitor and open the IP address in a web browser. The web interface then loads directly from the ESP32, allowing me to control the LEDs from the browser without refreshing the page.
High quality video available on my YouTube channel ↗️.
Processing
For this second interface test, I kept the same goal as in the previous example: controlling the two LEDs integrated in my PCB. The main difference is that, in this case, the interface does not run in a web browser and does not use WiFi. Instead, it is created as a desktop application using Processing.
Processing is a tool that makes it easy to create graphical interfaces and interactive applications. It is based on Java, but it is not necessary to have advanced programming knowledge to start using it, because its structure is very simple and designed for rapid development.
One of the things that caught my attention the most is how easy it is to create a visual interface in just a few steps. With functions such as setup() and draw(), it is possible to create a window on the screen and start drawing elements such as buttons, text, or graphics almost immediately.
Processing also has direct support for serial communication, which makes it easy to connect it to microcontrollers such as the ESP32. This makes it a very practical tool for this kind of assignment, where I need a quick interface to send data and control physical devices.
In my case, it was especially useful for creating a small desktop application to interact with my PCB without using WiFi or configuring a more complex system.
In my case, the communication workflow is the following:
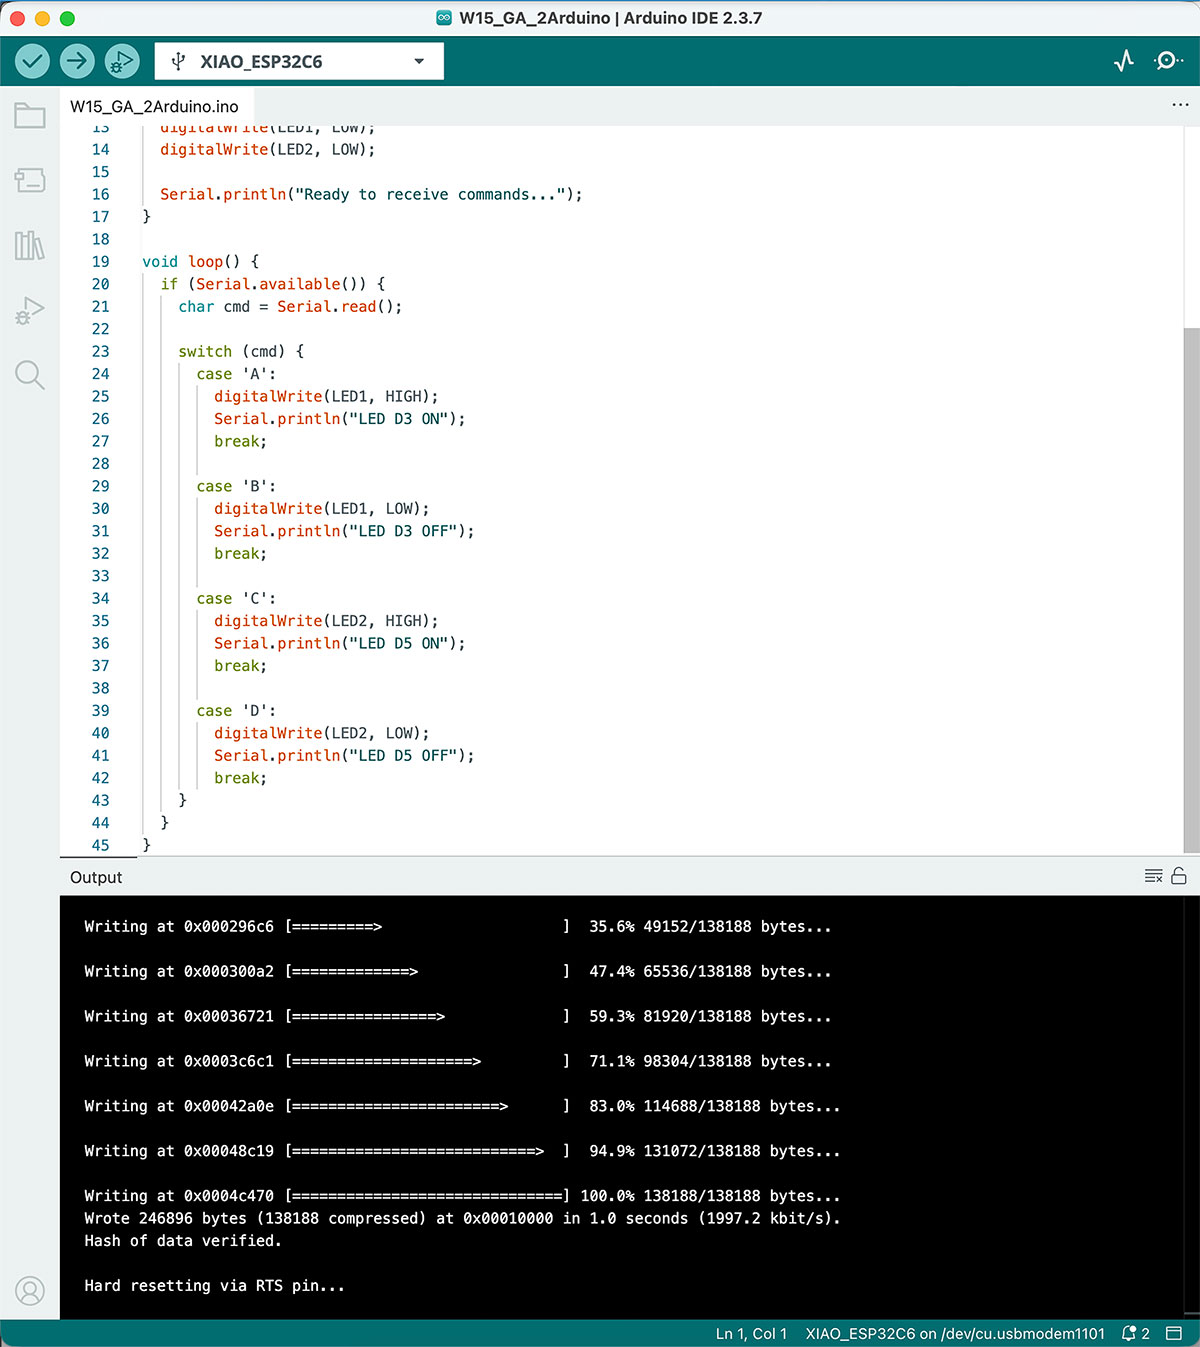
First, I uploaded a simple Arduino program to the XIAO ESP32-C6. This code configures the LEDs connected to pins D3 and D5 as outputs, and then waits for commands through the serial port. Each command is a single character:
- A turns LED D3 ON.
- B turns LED D3 OFF.
- C turns LED D5 ON.
- D turns LED D5 OFF.
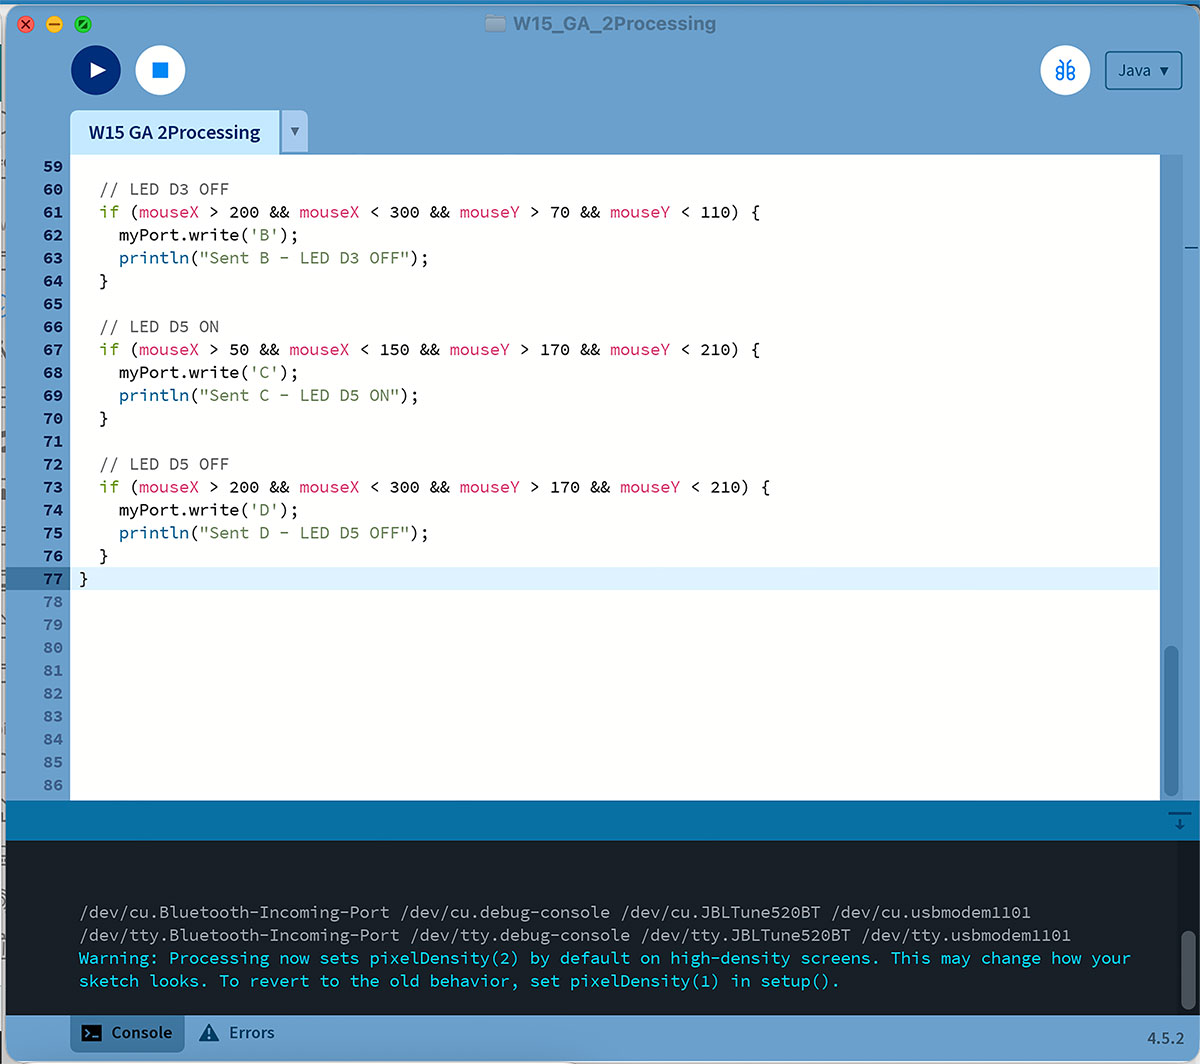
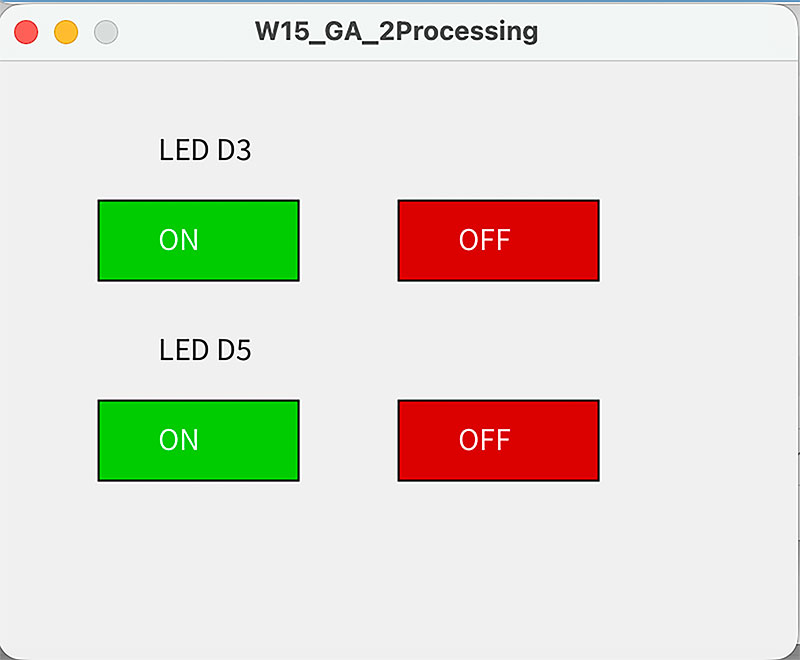
Then, in Processing, I designed a very simple graphical interface with four buttons: ON/OFF for LED D3 and ON/OFF for LED D5. When one of these buttons is pressed, Processing sends the corresponding character through the USB serial port. The ESP32 receives this character, interprets it using Serial.read(), and performs the corresponding action on the LED.
Unlike the web interface, this setup does not use a web server or HTTP requests. The communication is much more direct, because it happens through the USB cable and the serial port. This makes Processing very useful for creating quick test interfaces, simple control panels, or debugging tools during development.
During the first test, the Processing interface opened correctly and the buttons worked visually, but the LEDs did not respond. The problem was not in the Arduino code or in the button logic, but in the serial port selected in Processing.
On macOS, Processing can display all available serial ports using:
println(Serial.list());In my case, several devices appeared, including Bluetooth ports and other system ports. The mistake was that Processing was initially using Serial.list()[0], which did not correspond to the XIAO ESP32-C6. After checking the Processing console, I identified that the correct port for my board was:
/dev/cu.usbmodem1101Therefore, the solution was to replace the automatic port selection:
myPort = new Serial(this, Serial.list()[0], 115200);with the direct selection of the correct port on my Mac:
myPort = new Serial(this, "/dev/cu.usbmodem1101", 115200);It is also important to close the Arduino Serial Monitor before running Processing, because the same serial port cannot be used by two different programs at the same time.
Once the serial port was corrected, the communication worked properly. When I pressed the buttons in the Processing interface, the commands were sent to the ESP32-C6 and the LEDs on the PCB turned on and off immediately.
Arduino code · W15_GA_2Arduino.ino Show code
Processing code · W15_GA_2Processing.pde Show code
High quality video available on my YouTube channel ↗️.
MIT App Inventor
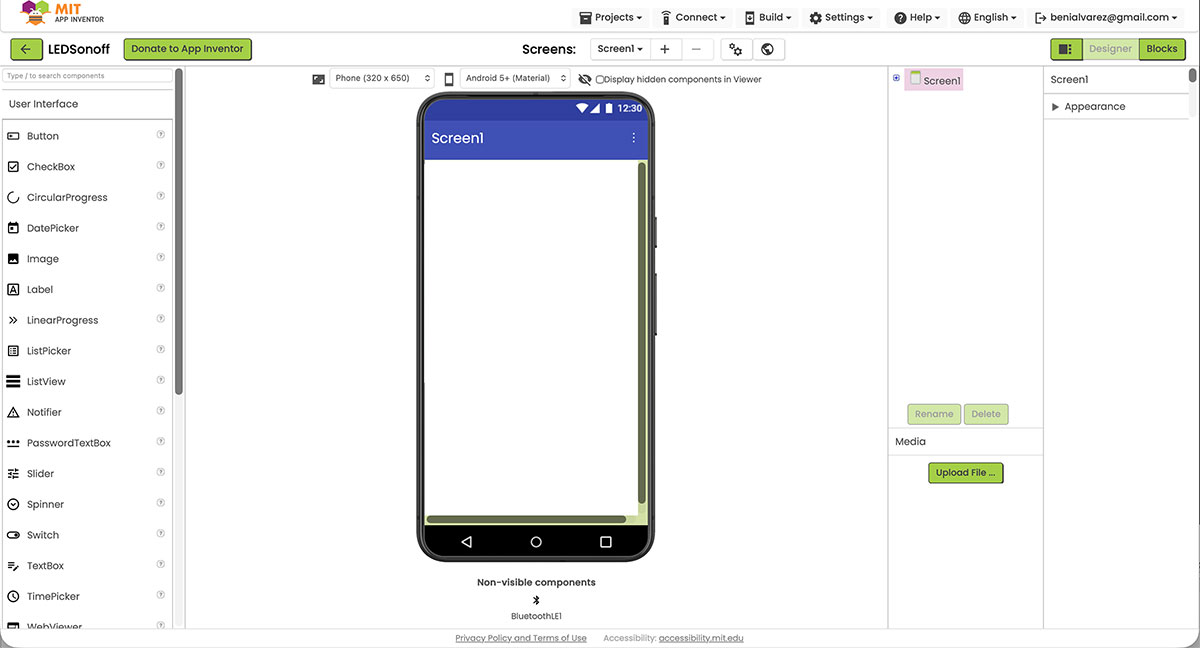
For this part of the assignment, I decided to use MIT App Inventor to develop a mobile interface that allows me to interact with my PCB.
MIT App Inventor is a free, web-based platform that enables you to build mobile applications in a very visual way. Instead of writing traditional code, it uses block-based programming, where elements snap together like LEGO pieces. This makes the development process much more intuitive and especially useful for rapid prototyping.
In my case, even though I feel more comfortable working with web interfaces as a designer, I found it very interesting to explore this tool, since it allows interaction directly from a mobile device, which is closer to the final user experience.
Main features
Some of the most relevant features of MIT App Inventor are:
- Drag & drop UI builder: Easily create interfaces by placing buttons, labels, lists, and other components.
- Block-based programming: Logic is built using visual blocks, making it easier to understand and debug.
- Live testing: Using the AI2 Companion app, changes can be tested instantly on the phone.
- Device access: Camera, sensors, storage, and more.
- Connectivity: Supports Bluetooth (Classic and BLE), WiFi, and web services.
- Extensions: Additional components can be added to extend functionality (such as BLE).
Tool structure
The platform is divided into two main areas:
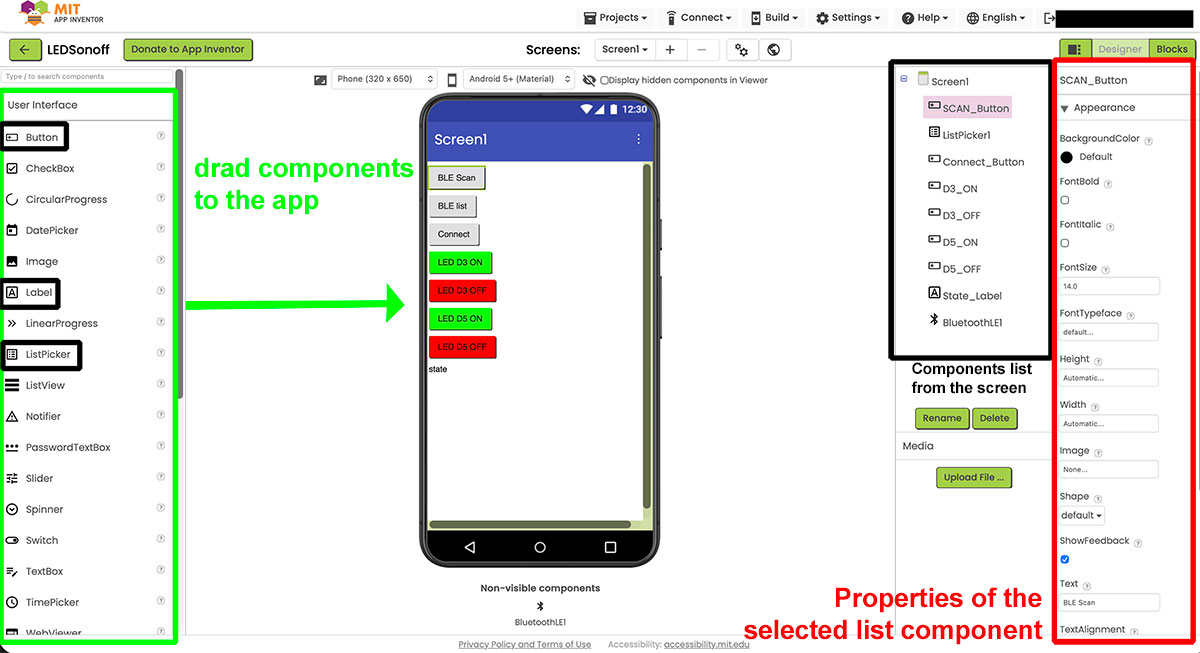
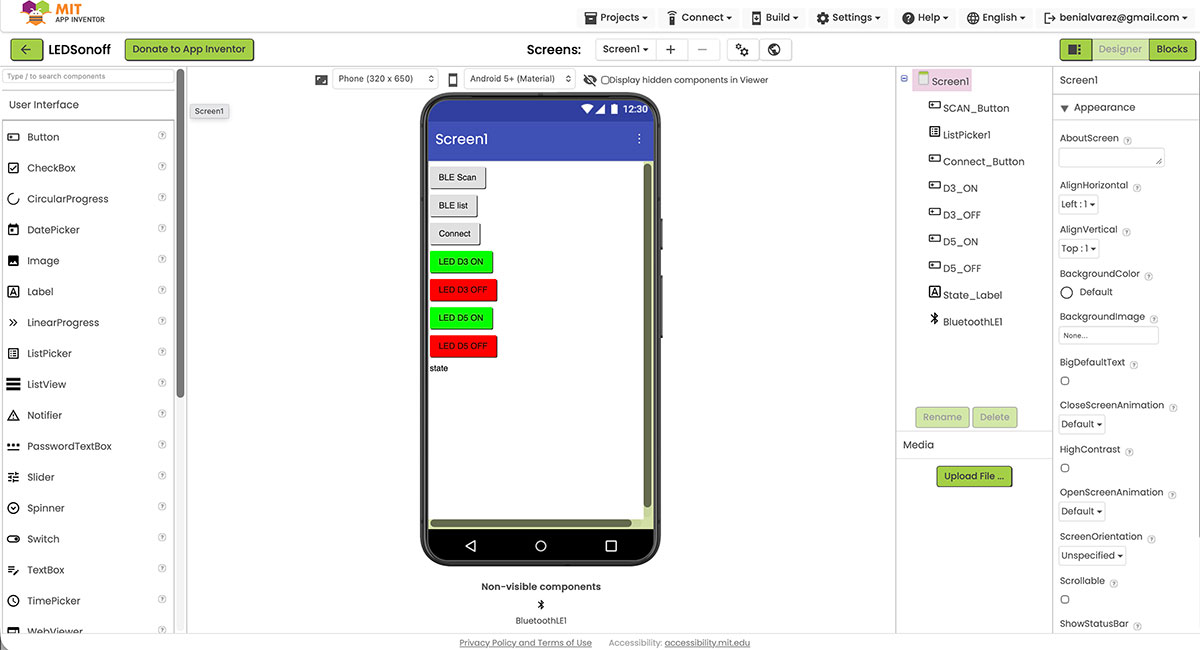
Designer
This is where the user interface is built. Components such as buttons, labels, or lists are added and arranged visually.
In this project, I used:
- Buttons to control the LEDs
- A ListPicker to select the BLE device
- A label to display the connection status
Blocks
This is where the application logic is defined.
Instead of writing code, blocks are connected to define:
- What happens when a button is pressed
- How the Bluetooth connection is established
- What data is sent to the microcontroller
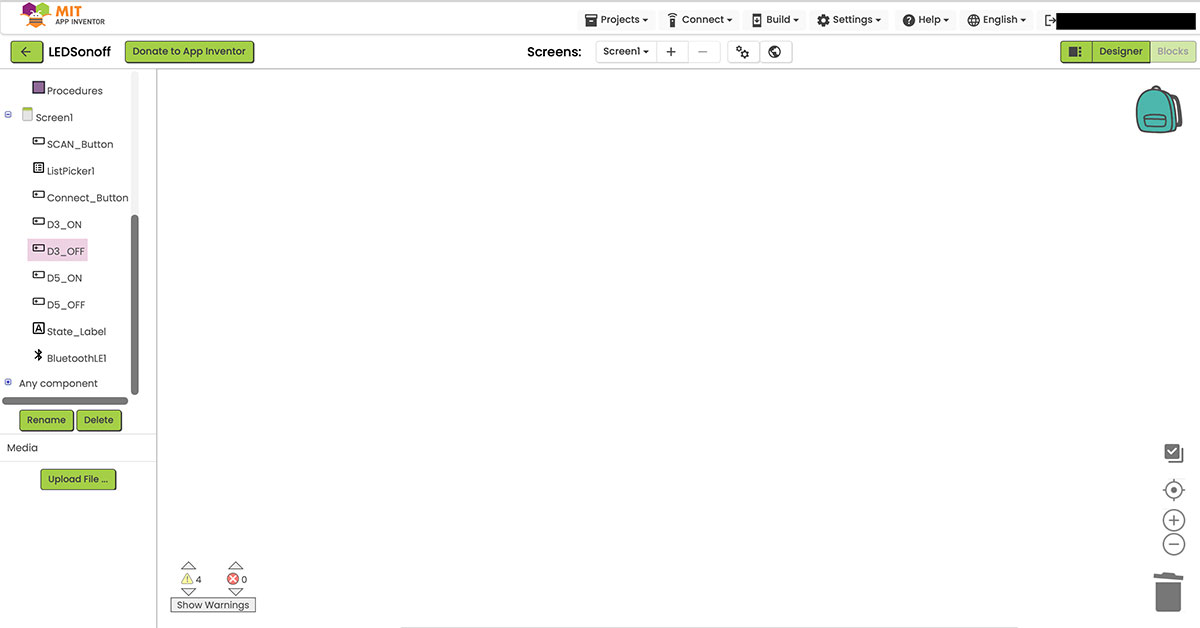
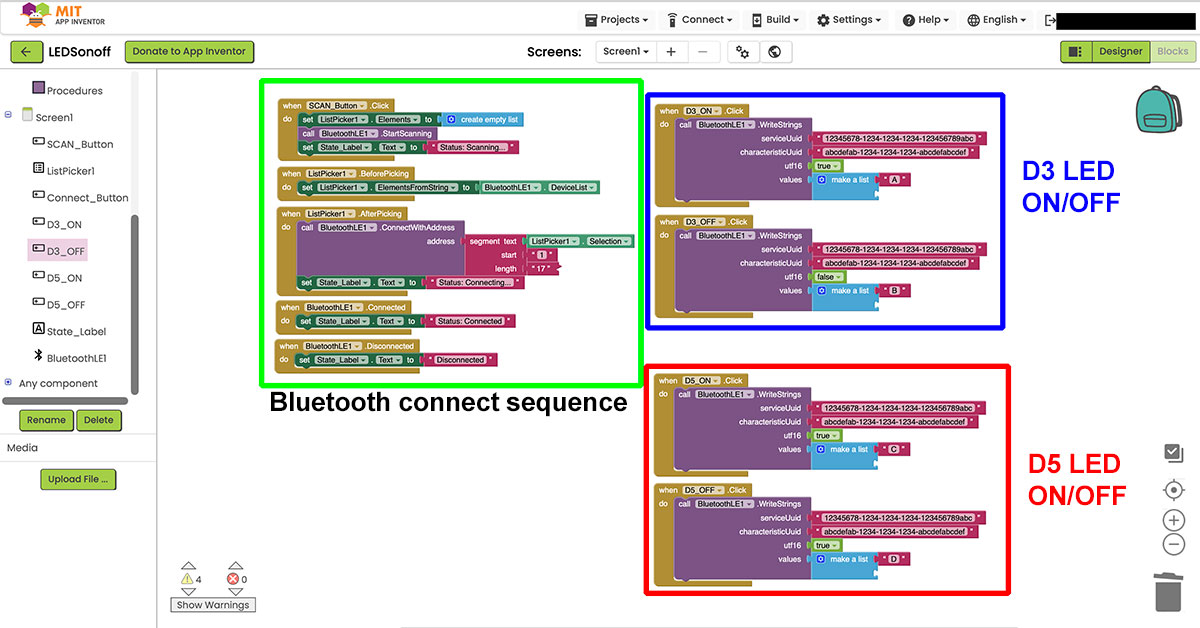
This approach makes it very easy to understand the interaction flow and debug issues.
Project goal
The goal of this exercise was to replicate the same behavior previously achieved with: Web interface and Processing, but in this case, using a mobile application and communicating with the ESP32-C6 via Bluetooth Low Energy (BLE).
The app allows:
- Scanning nearby BLE devices
- Selecting the ESP32 (my PCB)
- Establishing the connection
- Sending commands to control the LEDs
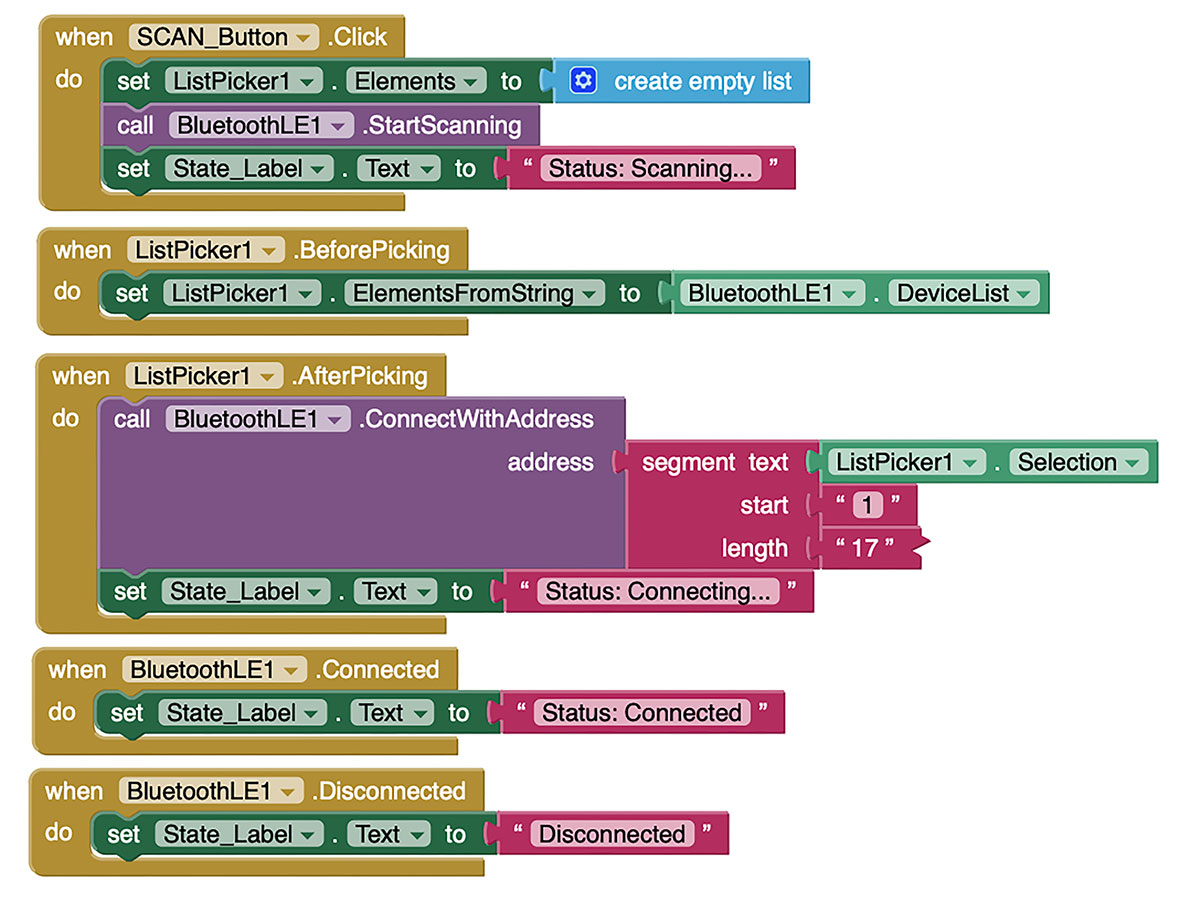
Workflow
The application follows this workflow:
-
Device scanning
The app searches for nearby BLE devices and updates the list dynamically. -
Device selection
A list of detected devices is displayed, and the ESP32 is selected. -
Connection
The connection is established using the MAC address, and the interface updates the status. -
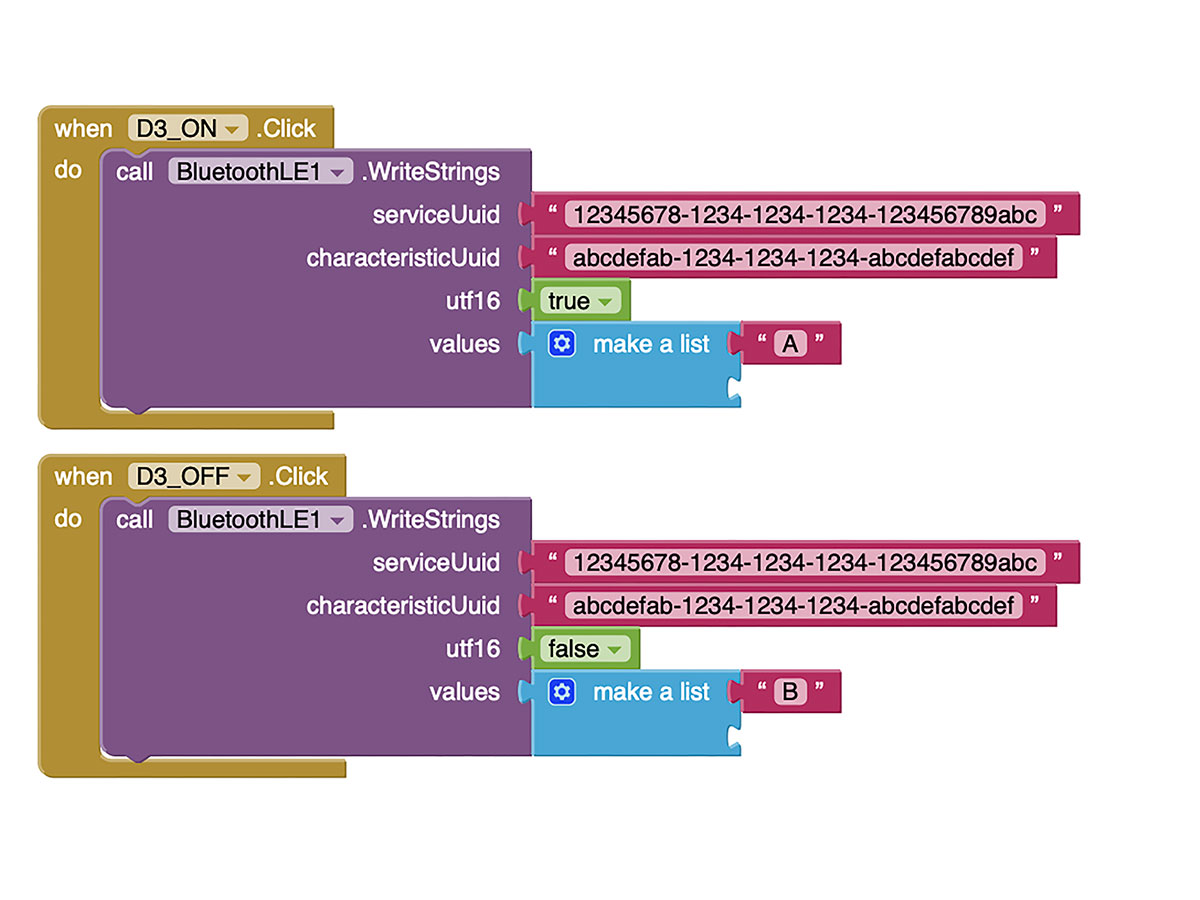
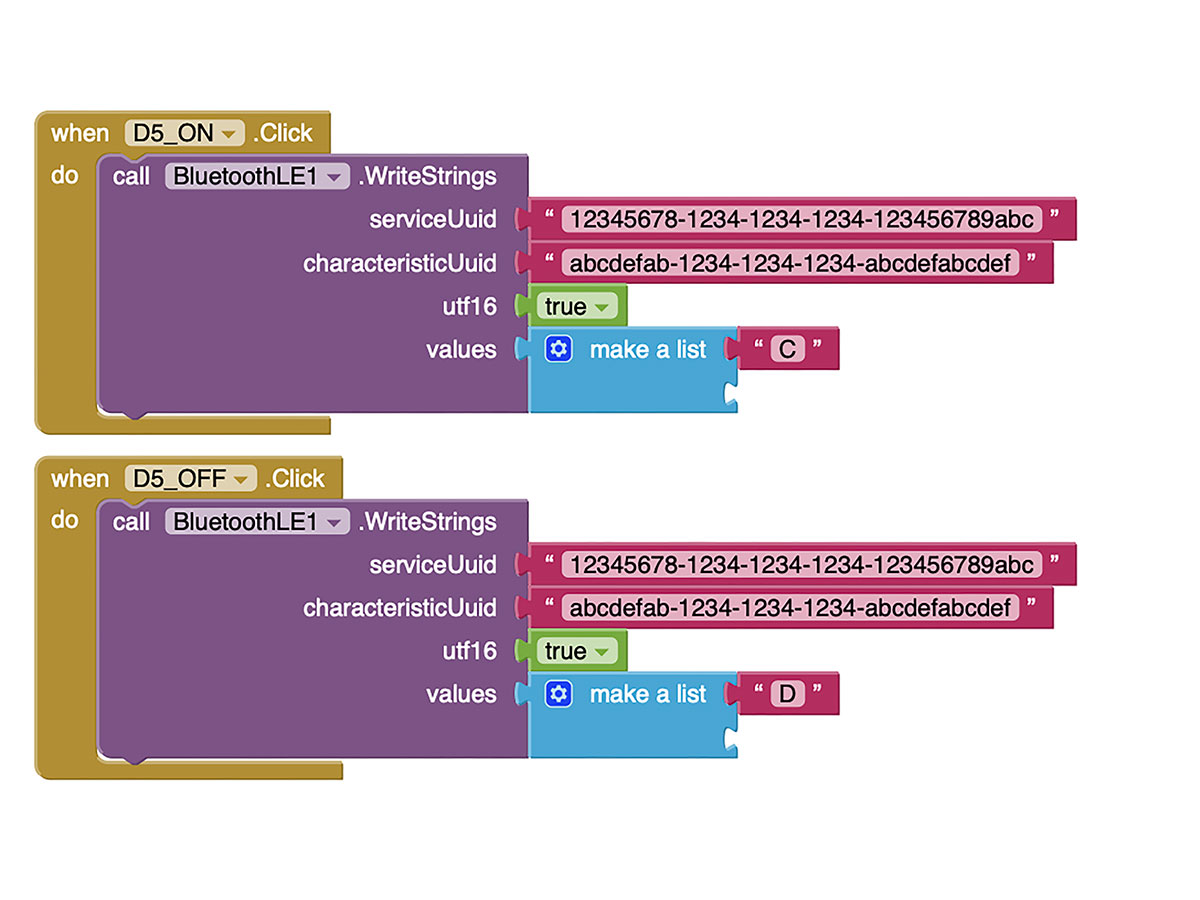
Command sending
Each button sends a specific character to the microcontroller:- "A" → LED D3 ON
- "B" → LED D3 OFF
- "C" → LED D5 ON
- "D" → LED D5 OFF
Arduino code (BLE communication)
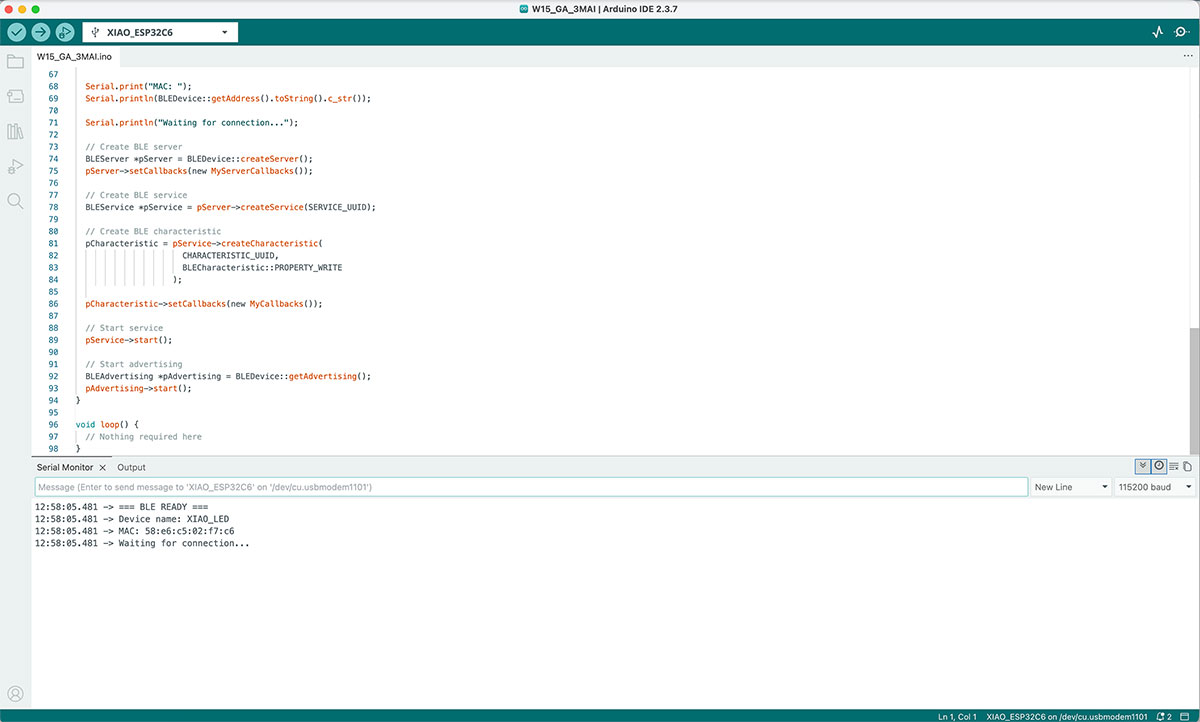
In order for the mobile application to communicate with the PCB, the microcontroller must act as a BLE server, capable of receiving data from the app.
In this case, the XIAO ESP32-C6 is programmed to advertise itself as a Bluetooth Low Energy device with the name "XIAO_LED". This allows the app to detect it during scanning and establish a connection.
Once connected, the ESP32 remains in a listening state, waiting to receive data through a BLE characteristic. To achieve this, a service and a characteristic are defined using unique identifiers (UUIDs), which must match exactly the ones used in MIT App Inventor.
The communication flow is as follows:
- The ESP32 initializes BLE and starts advertising
- The app detects the device and connects
- The microcontroller enters a listening state
- Each time the app sends a command, the ESP32 receives and processes it
To handle this behavior, two types of callbacks are used:
Connection callbacks are used to detect when a device connects or disconnects. This is very useful for debugging, as the Serial Monitor can confirm whether the connection has been successfully established.
The onWrite callback is executed every time the app sends data. In this implementation, the received data are single characters representing specific actions:
- "A" → turn ON LED D3
- "B" → turn OFF LED D3
- "C" → turn ON LED D5
- "D" → turn OFF LED D5
The ESP32 interprets these commands and directly controls the corresponding pins.
Additionally, I included debug messages in the Serial Monitor to display:
- The device MAC address
- The connection status (connected / disconnected)
- The received commands
This was especially useful during development to verify that the communication between the mobile app and the board was working correctly.
Overall, this code allows the PCB to behave as an interactive system, responding in real time to user actions from the mobile application.
Problems encountered
During development, several issues appeared:
1. Devices appearing as “null”
When scanning, device names were not displayed, making it difficult to identify the ESP32.
Solution: I displayed the MAC address in the Serial Monitor and used it to identify the device.
2. BLE address format
The ListPicker returned a string like:
58:E6:C5:02:F7:C6 XIAO_LED -63
But the connection block only accepts:
58:E6:C5:02:F7:C6
Solution: I used a text segment block to extract the first 17 characters.
3. Connection status not updating
The app remained in “Connecting…” even after a successful connection.
Solution: I added the events:
- BluetoothLE1.Connected
- BluetoothLE1.Disconnected
Arduino code · W15_GA_3MAI.ino Show code
High quality video available on my YouTube channel ↗️.
Interface tools comparison used in this group assignment
| Feature | Web Interface | Processing | MIT App Inventor |
|---|---|---|---|
| Platform | Web browser | Desktop application | Mobile application |
| Communication | Wi-Fi / HTTP | USB Serial | Bluetooth / BLE |
| Device required | Any device with browser | Computer | Smartphone |
| Setup complexity | Medium (Wi-Fi + server) | Low (plug & play USB) | Medium (BLE setup + app) |
| Interface design flexibility | High (HTML/CSS/JS) | High (custom graphics) | Medium (block-based UI) |
| Real-time performance | Good (network dependent) | Very high (direct communication) | Good (BLE dependent) |
| Best use case | Remote control & IoT | Prototyping & visualization | Mobile control apps |
| Strengths | Accessible from anywhere | Fast and responsive | Easy mobile app creation |
| Limitations | Requires network setup | Requires USB connection | Limited UI customization |
Document your work on the group work page and reflect on your individual page what you learned.
During the group assignment, I compared different tools for creating interfaces that communicate with an embedded board. Although all of them can achieve a similar result, each one uses a different approach in terms of communication and workflow.
This exercise helped me better understand when each tool is more appropriate. For example, the web interface is better suited for remote access, while Processing is faster and more flexible for prototyping and visualization.
Personally, it helped me move beyond my usual environment as a web designer and explore new ways of connecting interfaces with real hardware, adapting my previous knowledge to contexts closer to embedded programming.
Individual assignment
Write an application for the embedded board that you made. that interfaces a user with an input and/or output device(s).
Individual assignment – Processing interface with sensor
For the individual assignment of this week, I wanted to go one step further than the previous LED control examples and work with a real input device. For this, I used a DHT11 temperature and humidity sensor, which I had already tested during the W09 Input Devices week.
DHT11 Pin Connection
| DHT11 Pin | Connected to my PCB with XIAO ESP32C6 | Function |
|---|---|---|
| VCC | 3V3 | Power supply |
| DATA | D7 | Digital data signal |
| GND | GND | Ground |
During that previous week, the main goal was simply to check that the sensor was working by reading its values in the Arduino IDE Serial Monitor. Starting from that previous work, I reused the same hardware and integrated it into a more complete application, where the user can visualize the data through a graphical interface.
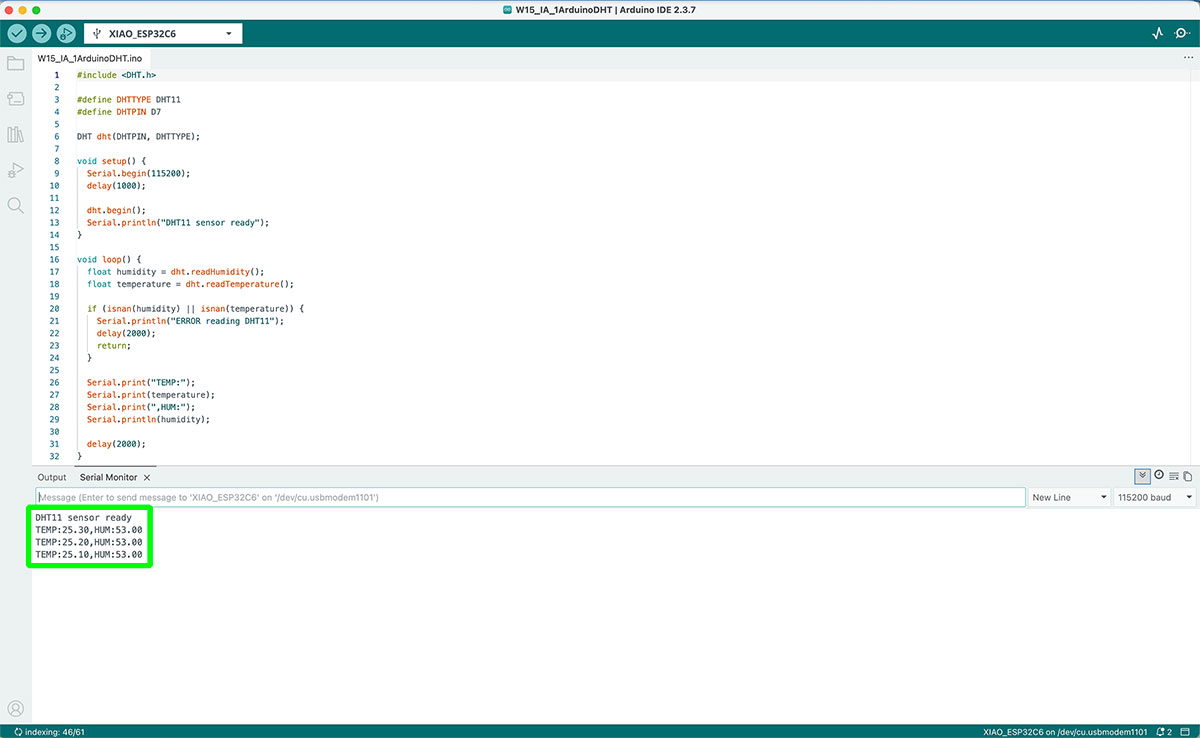
As an initial step in this new phase, I uploaded a basic Arduino code to the XIAO ESP32-C6 again to confirm that the sensor was still working correctly. I checked the temperature and humidity values directly in the Serial Monitor, making sure that the readings were stable and that the sensor configuration was correct before moving on to the interface part.
The workflow of the system is the following:
The ESP32-C6 reads the temperature and humidity values periodically and sends them through the serial port using a structured format:
TEMP:25.30,HUM:53.00This simplified format makes it easier for the Processing application to read and interpret the data without ambiguity.
Arduino code · W15_IA_1ArduinoDHT.ino Show code
Before developing the final graphical interface, I made a very simple first test in Processing. The only purpose of this test was to confirm that the serial communication was working correctly. At this stage, Processing only read the incoming data and printed it in its console. This allowed me to verify that:
- The ESP32 was sending data correctly.
- The serial port was properly configured.
- The data format was the expected one.
import processing.serial.*;
Serial myPort;

void setup() {
  size(400, 200);
  println(Serial.list());
  myPort = new Serial(this, "/dev/cu.usbmodem1101", 115200);
  myPort.bufferUntil('\n');
}

void draw() {
  background(240);
  fill(0);
  text("Reading serial...", 120, 100);
}

void serialEvent(Serial p) {
  String data = p.readStringUntil('\n');
  if (data != null) {
    data = trim(data);
    println("Received: " + data);
  }
}
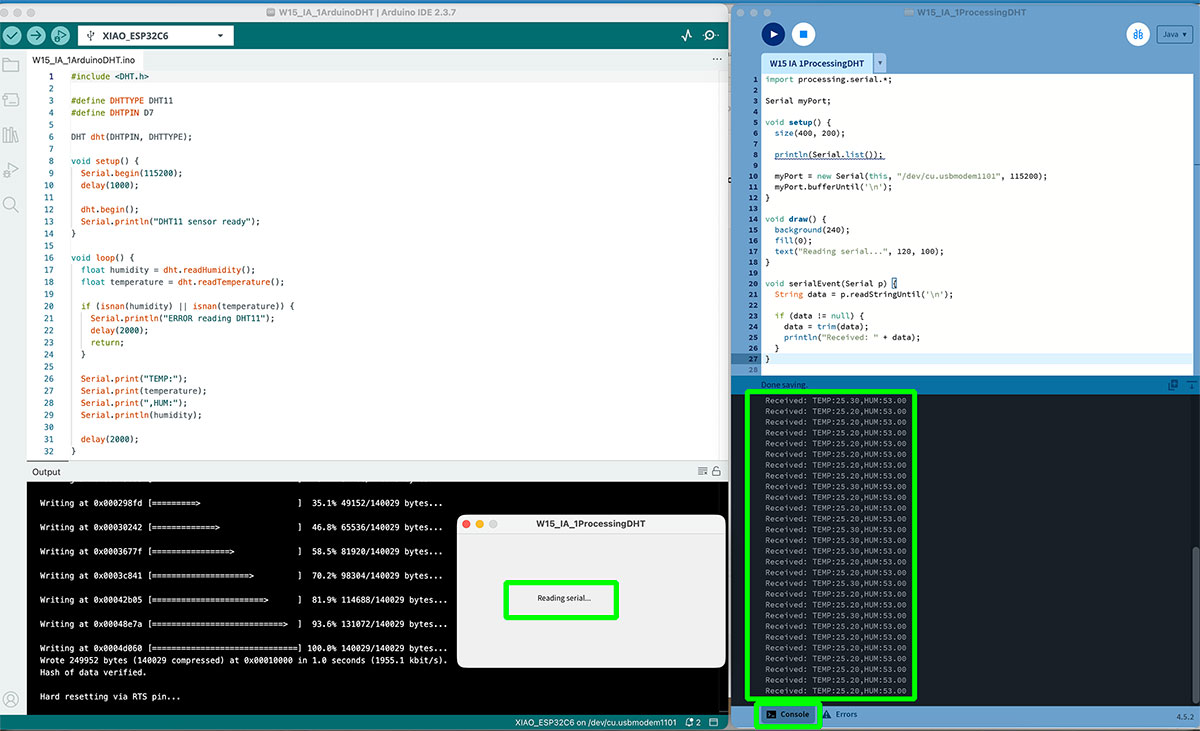
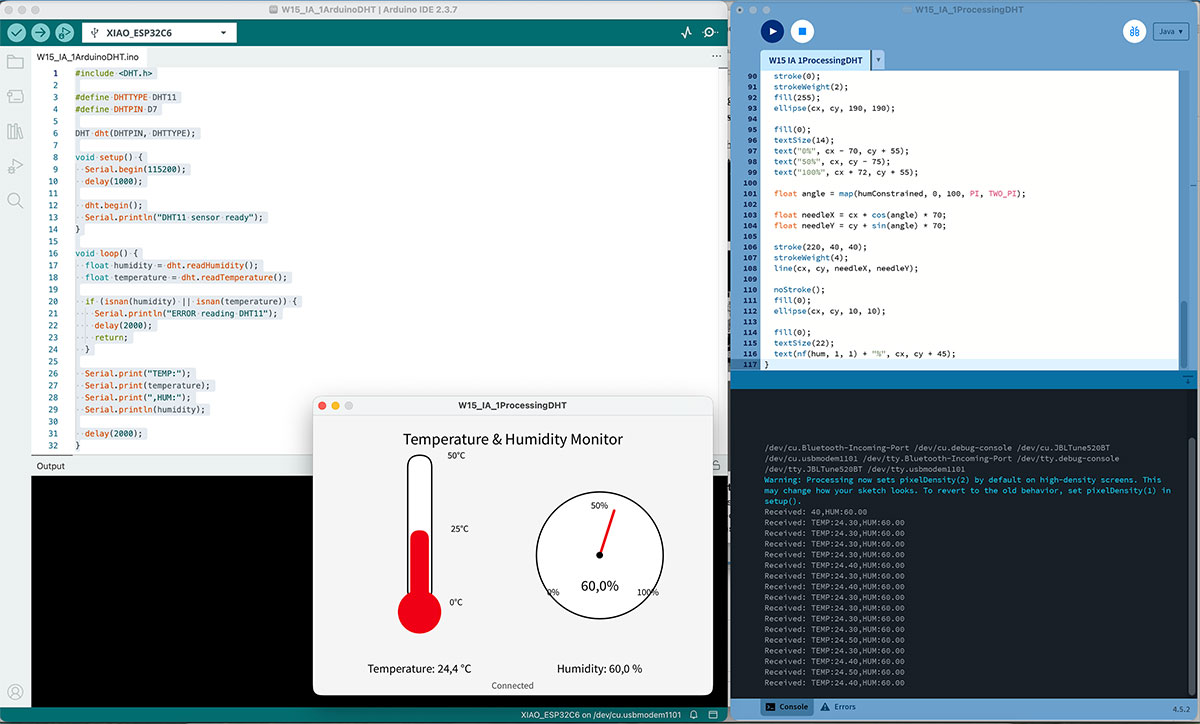
Once this communication was validated, I moved to a second phase and developed the graphical interface.
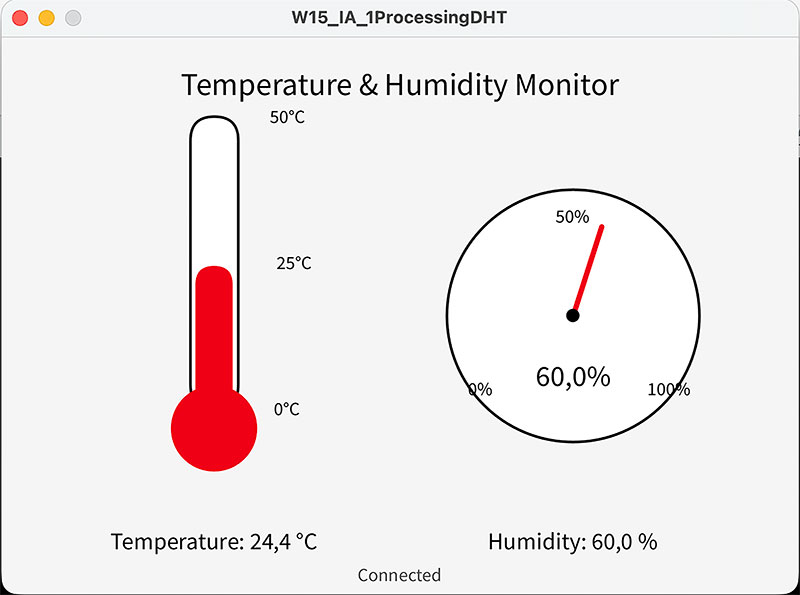
In Processing, I created a small desktop application that represents the sensor data visually:
- The temperature is displayed as a vertical thermometer.
- The humidity is represented with a circular gauge and a needle, similar to an analog clock.
- The numerical values and a small connection status are also displayed.
As a web designer, the most natural option for me would probably have been to create this application as a Web Interface. However, in this case I decided to use Processing for several reasons. On one hand, it makes it very easy to create custom visualizations with only a small amount of code. On the other hand, the communication through the serial port is very direct, without the need to configure networks, web servers, or additional protocols. This makes Processing a very practical tool for quick prototypes, debugging interfaces, and development tests.
During the process, I also encountered some problems, mainly related to serial communication. The main issue was selecting the correct port in Processing. On macOS, several devices appear in the serial port list, including Bluetooth ports and system ports, and not all of them correspond to the board. At first, I was using an automatic index, Serial.list()[0], but this did not point to the XIAO ESP32-C6, so the application was not receiving any data.
The solution was to check the Processing console, identify the correct port, and configure it manually:
/dev/cu.usbmodem1101Another important point was to make sure that the Arduino Serial Monitor was closed before running Processing, because the same serial port cannot be used by two different programs at the same time.
Once these issues were solved, the application worked in real time. The sensor values are continuously updated and immediately reflected in the graphical interface, providing a much more intuitive representation than simply reading numbers in the console.
Processing code · W15_IA_1ProcessingDHT.pde Show code
Improving the graphical interface
Once I had a first functional version of the Processing interface, the next step was to improve the quality of the visualization, making it clearer, more precise, and easier to interpret.
In the initial version, both the thermometer and the humidity gauge only displayed a few basic reference values (0, 25, and 50 ºC for temperature, and 0, 50, and 100% for humidity). While this was enough for a quick test, it was not very precise when reading the data.
For this reason, I improved the scales of both elements. In the case of the thermometer, I added main marks every 10 ºC and intermediate marks every 5 ºC, allowing a much more detailed reading of the temperature level. Similarly, in the humidity gauge, I included main marks every 20% and intermediate marks every 10%, which significantly improves readability.
Beyond the scales, I also introduced improvements to make the interface more intuitive. One of the most important changes was the use of dynamic colors. The thermometer now changes color depending on the temperature (cold, comfortable, or hot), and the humidity gauge also adapts its color depending on whether the environment is dry, comfortable, or humid. This makes it possible to quickly understand the state of the environment without relying only on numerical values.
Another improvement was related to the smoothness of the animations. In the first version, both the thermometer level and the humidity needle changed abruptly whenever a new value was received. To improve this, I implemented a simple interpolation between the current value and the new incoming value, resulting in a much more fluid and natural movement in the interface.
Finally, I added a visual status indicator to show whether the communication with the ESP32 is working correctly. This indicator uses a simple color code (green, yellow, and red) to represent different states, making it easier to quickly detect possible issues.
Overall, these changes do not modify the core functionality of the system, but they significantly improve the user experience, making the interface more precise, more intuitive, and closer to a real application.
Processing code · W15_IA_1ProcessingDHT_v2.pde Show code
High quality video available on my YouTube channel ↗️.
For this video test I used a hairdryer to increase the temperature (and therefore decrease the humidity) so that the interface could be seen in real time.
From data to visual representation
Beyond improving the visual design, an important part of this interface is how the sensor data is translated into graphical elements.
Instead of simply displaying numbers, the goal was to create a more intuitive and visual representation: temperature is mapped to a vertical level, while humidity is mapped to an angular position.
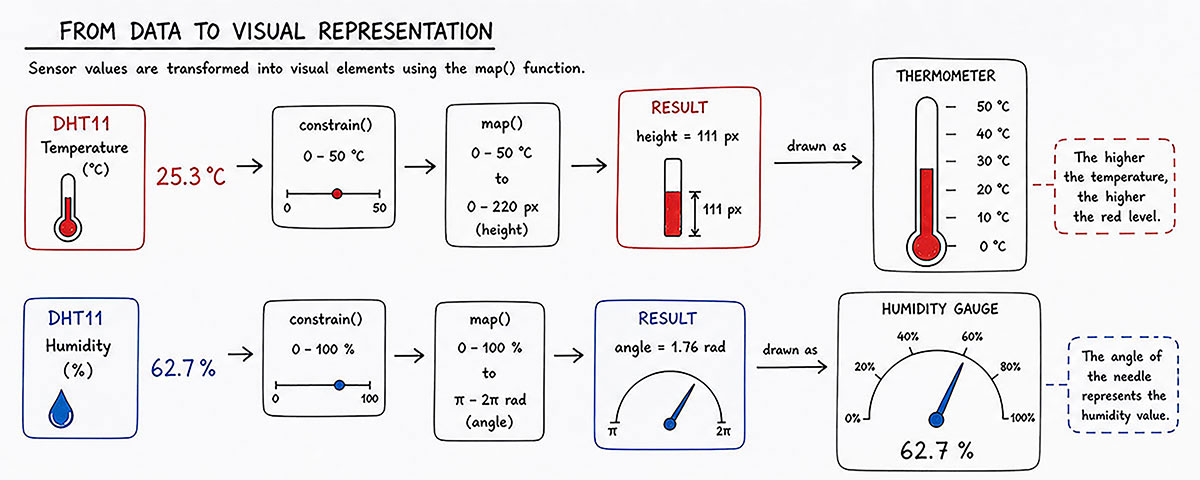
For the thermometer, the temperature value is first constrained between 0 and 50 ºC to avoid out-of-range values. Then, the map() function is used to convert that value into a height inside the thermometer. This height determines how much of the red column is filled, creating a direct visual relationship between the value and its representation.
The scale is generated using loops, placing marks at regular intervals: main marks every 10 ºC and intermediate marks every 5 ºC. Each mark is positioned using the same mapping logic, ensuring visual consistency between the data and the scale.
For the humidity gauge, the approach is different. Instead of height, the value is converted into an angle using the map() function, transforming a range from 0–100% into a semicircular arc (from PI to TWO_PI).
Once the angle is calculated, the position of the needle is obtained using trigonometric functions: cos() and sin(). These functions translate the angle into X and Y coordinates, allowing the needle to rotate around the center of the gauge.
This approach makes the interface behave like an analog instrument, where the value is not only read but also perceived visually through movement and position.
Overall, this process converts raw sensor data into a more intuitive, readable and engaging interface, reinforcing the idea that data visualization plays a key role in user interaction.
Processing code explanation
Once the interface was developed and tested, I organized the Processing code into several main parts: initialization, data reception, visualization, smooth animation, and visual improvements.
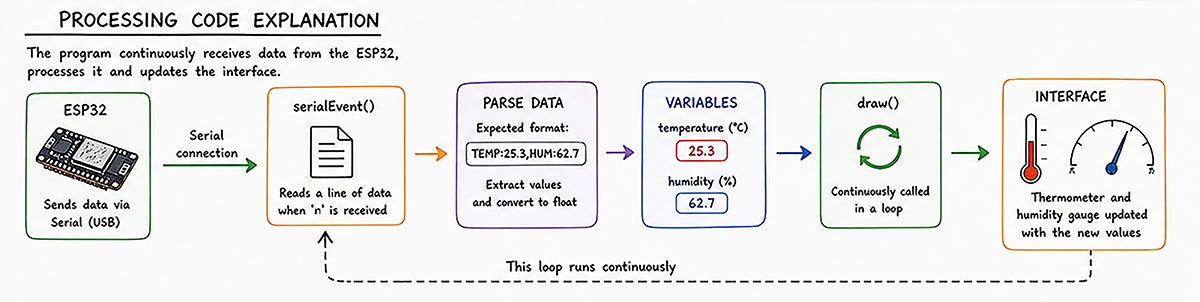
In the setup() function, the application window is configured and the serial communication with the XIAO ESP32-C6 is initialized. I also print the list of available serial ports in the console, which helped me identify the correct port for my board. In addition, I use bufferUntil('\n') so that Processing waits until a complete line is received before processing the data.
The incoming data is handled inside serialEvent(). Every time a new line arrives through the serial port, Processing checks that it follows the expected format: TEMP:xx,HUM:xx. Then, the text is split to separate temperature and humidity, and both values are converted into float variables so they can be used in the graphics.
The draw() function updates the interface in real time. In every frame, the screen is cleared and all the elements are redrawn: title, connection status, numerical values, thermometer, and humidity gauge.
To avoid sudden changes in the interface, I added two intermediate variables: displayTemperature and displayHumidity. These variables do not jump directly to the new received value. Instead, they are updated progressively using a simple interpolation. This makes both the thermometer level and the humidity needle move in a much smoother and more natural way.
The drawThermometer() function represents the temperature as a vertical thermometer. First, the value is limited to a safe range using constrain(), and then it is converted into a proportional height using map(). The scale was also improved with main marks every 10 ºC and intermediate marks every 5 ºC, making the reading more precise.
The drawHumidityGauge() function represents humidity as a circular gauge with a needle. The humidity value is limited between 0 and 100%, and then converted into an angle. From that angle, the code calculates the final position of the needle using cos() and sin(). I also added main marks every 20% and intermediate marks every 10%, making the gauge much easier to read.
To improve the visual interpretation, I added two helper functions: getTemperatureColor() and getHumidityColor(). These functions change the color of the thermometer and the humidity needle depending on the value range, making it easier to quickly understand whether the environment is cold, comfortable, hot, dry, or humid.
Finally, the drawStatusIndicator() function draws a small status indicator next to the connection text. This indicator changes color depending on the communication state: green when the system is connected, yellow while waiting for data, and red if an error occurs.
Overall, this structure makes the code clearer and more modular, separating data reading, processing, and graphical representation. It also transforms simple serial data into a more complete, intuitive, and application-like interface.
Original code files for this documentation
Files for download
- Arduino web interface PCB's ON/OFF buttons (W15_GA_WebInterface.ino) INO · 3 Kb
- Processing interface PCB's ON/OFF buttons (W15_GA_2Processing.pde) PDE · 1 Kb
- MIT App Inventor interface PCB's ON/OFF buttons project (LEDSonoff.aia) AIP · 205 Kb
- MIT App Inventor interface PCB's ON/OFF Arduino code for PCB (W15_GA_3MAI.ino) INO · 2 Kb
- Arduino read DHT Sensor data (W15_IA_1ArduinoDHT.ino) INO · 1 Kb
- Processing DHT Temp&HR graphics (W15_IA_1ProcessingDHT.pde) PDE · 1 Kb
- Processing DHT Temp&HR graphics V2 (W15_IA_1ProcessingDHT_v2.pde) PDE · 5 Kb
Week questions/tasks
Final reflection
This week was especially interesting for me because it connects two areas I feel very comfortable with: the hardware development we have been working on during FabAcademy and the design of user interfaces, which is part of my daily work as a web designer.
During the group assignment, comparing different tools helped me understand that there is no single “correct” way to interact with an embedded board. Depending on the context, it may make more sense to use a web interface, a desktop application, or a mobile app. More than learning a specific tool, the key takeaway was understanding how to choose the right one depending on the goal.
In the individual assignment, I was able to apply this in a more practical way. Moving from reading raw data in the Serial Monitor to designing a graphical interface completely changes the experience. The system goes from being something purely technical to something that can be understood intuitively by any user.
I also found it very interesting to reuse elements from previous weeks, such as the sensor and serial communication, and give them a new meaning through the interface. It is a good example of how everything starts to connect and come together over time.
Overall, this week helped me realize that in an embedded system it is not only important that it works, but also how it is presented and how the user interacts with it.
Credits
All texts were written in Spanish and translated into English using Google Translate and ChatGPT.