Week 9
Inputs devices
Contents
Starting Point
We're continuing what we learned last week by adding inputs to our PCB. The truth is, even though we have countless sensors around us every day, or even in our pockets, we don't usually stop to think about how they physically or logically work. Understanding how they work is a big challenge for someone like me who doesn't have a background or knowledge in electronics.
Group assignment
We have decided that, as a group effort, each of us will specifically document some of the tests performed on our page.
Probe an input device(s)'s analog levels and digital signals (As a minimum, you should demonstrate the use of a multimeter and an oscilloscope.)
Digital Input device: Humidity & Temperature input device
For this part, I used the temperature and humidity sensor connected to the PCB with the XIAO that I fabricated last week. From there, I uploaded an Arduino code that reads the sensor data every 2 seconds and displays it both in the Serial Monitor and in the Serial Plotter (explained in detail in the individual section below).
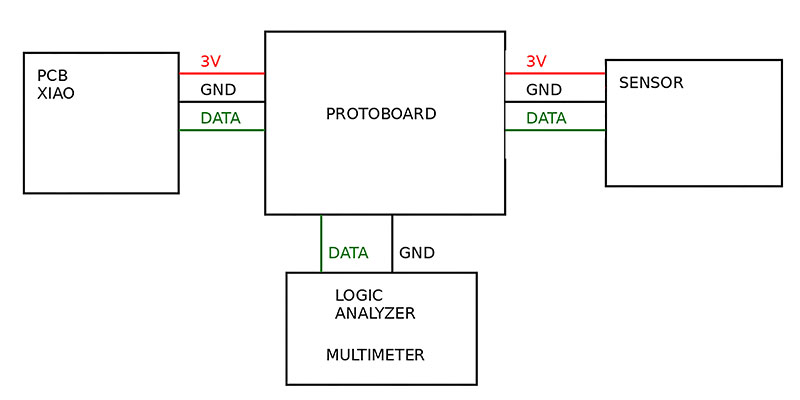
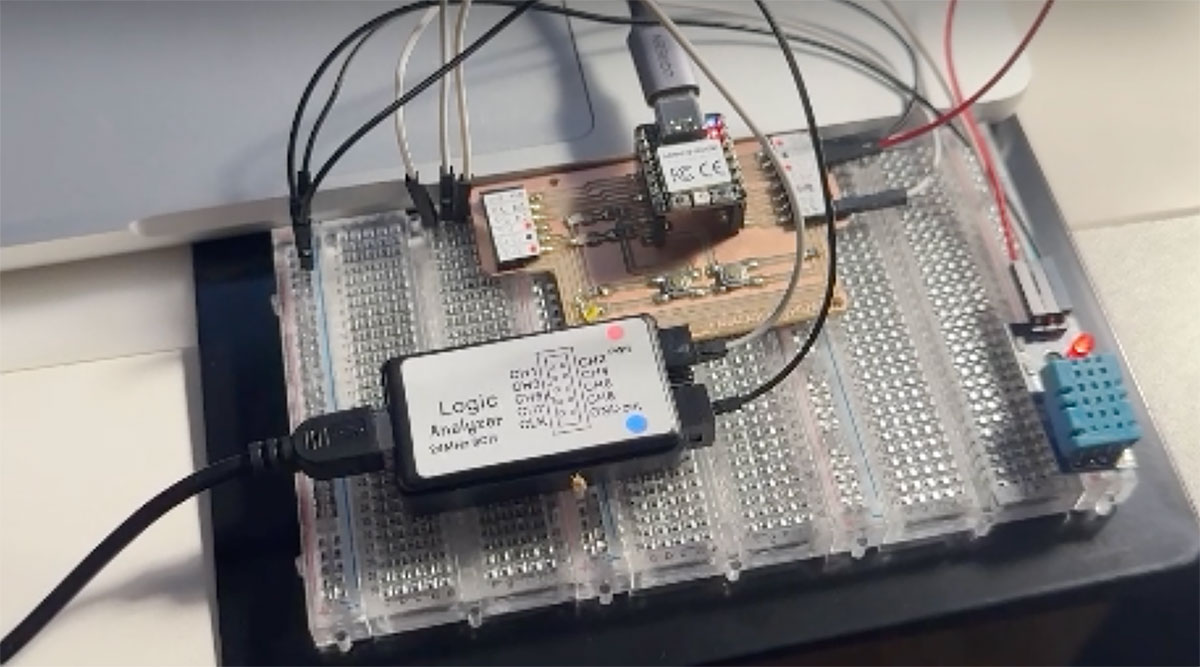
Once I verified that the sensor was working correctly at the software level, the next step was to check how that data was being transmitted at the physical level. Since we do not have an oscilloscope in the FabLab, I used a multimeter and a logic analyzer to study the signal.
First, I connected the multimeter between the DATA and GND pins. What I observed was that, every time the sensor transmits data, the voltage drops briefly for a fraction of a second and then quickly returns to its initial value. This confirms that there is activity on the data line, although the multimeter cannot display the individual pulses because the signal changes too fast.
To get a more precise view, I then used a logic analyzer. With this tool it is possible to capture the signal over time and clearly see the digital pulses. In this case, it can be observed that the communication uses a single-wire digital protocol, where the bits are encoded according to the duration of the pulses. A sequence of short and long pulses appears, corresponding to the binary values sent by the sensor every 2 seconds.
To make the measurement process easier, I assembled the circuit on a protoboard, which allowed me to connect both the multimeter and the logic analyzer in parallel without making the setup more complicated.
In this exercise I understood much better the difference between measurement tools: the multimeter is useful to confirm that there is signal activity, but to really analyze what that signal looks like over time, a logic analyzer (or an oscilloscope) becomes essential.
High quality video available on my YouTube channel ↗️.
High quality video available on my YouTube channel ↗️.
In the video recorded with the logic analyzer, it is also possible to observe the temperature increase in both the Serial Monitor and the Serial Plotter when applying heat using a hair dryer.
In this case, the humidity value was already low, since I had performed a previous test and the sensor did not have enough time to return to the ambient humidity level of the room.
Analog Input device: Joystick (X & Y axis)
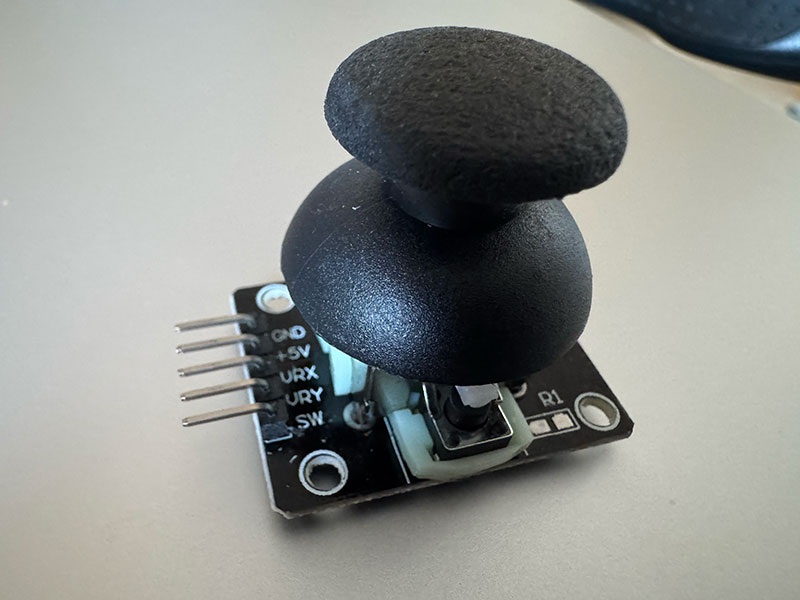
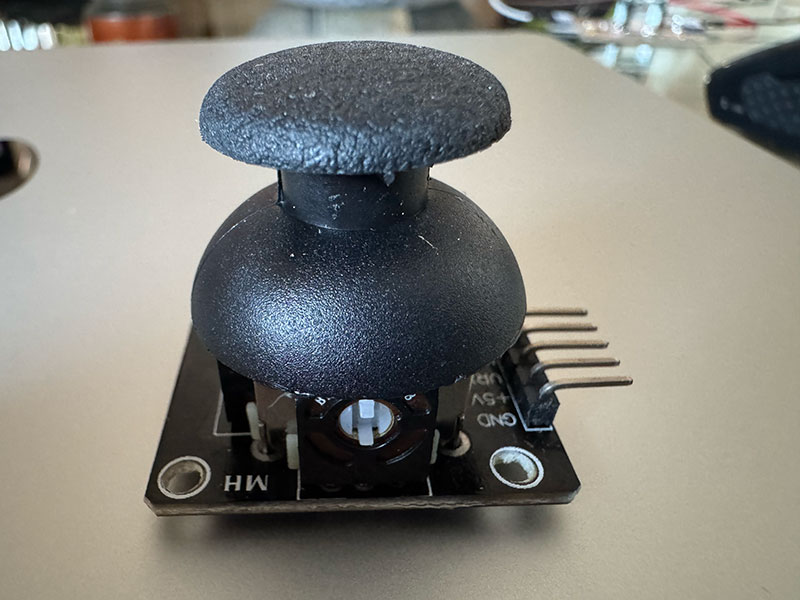
To test an analog input device, I decided to use a joystick, since the movement along the X and Y axes generates analog signals. This type of joystick also includes a button (switch), but that is a digital signal, so I decided not to use or analyze it in this exercise.
The first step was to measure the signal directly using a multimeter, connecting it between GND and one of the joystick’s analog outputs (VRX or VRY). This allowed me to verify that the voltage varies continuously depending on the joystick position. At rest, the value is approximately at the midpoint of the supply voltage (around 2.5V). When moving the joystick, the voltage progressively decreases to values close to 0V at one extreme, and increases up to approximately 5V at the opposite end. This clearly shows that the signal is not digital and discrete, but rather an analog signal proportional to position.
I also verified that the joystick works correctly powered at 3.3V instead of 5V, which is especially useful in this context. By working at 3.3V, the analog outputs (VRX and VRY) are limited to that same range, making them fully compatible with the XIAO’s analog inputs and avoiding potential overvoltage issues.
Once the electrical behavior was validated, I connected the joystick to the PCB with the XIAO that I fabricated last week (link) and developed an Arduino code that continuously reads the X and Y axis values. These values are displayed both in the Serial Monitor and the Serial Plotter, making it easy to visualize how the data changes in real time depending on the joystick movement.
High quality video available on my YouTube channel ↗️.
High quality video available on my YouTube channel ↗️.
Arduino code · 02joystick.ino Show code
// Joystick XIAO RP2040
// VRX -> A0
// VRY -> A1

const int pinX = A0;
const int pinY = A1;

void setup() {
  Serial.begin(115200);
  delay(1000);
}

void loop() {
  int xValue = analogRead(pinX);
  int yValue = analogRead(pinY);

  // ---- Serial Monitor ----
  Serial.print("X: ");
  Serial.print(xValue);
  Serial.print(" | Y: ");
  Serial.println(yValue);

  // ---- Serial Plotter ----
  Serial.print(xValue);
  Serial.print(" ");
  Serial.println(yValue);

  delay(50);
}
ChatGPT prompt used to generate code · 02joystick.ino Show prompt
Document your work on the group work page and reflect on your individual page what you learned
We analyzed different input devices using tools such as a multimeter and a logic analyzer. At an individual level, this exercise helped me better understand how signals behave depending on the type of sensor.
I was able to clearly see the difference between digital and analog signals, as well as the limitations of each measurement tool. In addition, it helped me relate what happens at the physical signal level with the data that is later interpreted by the microcontroller.
Individual assignment
Since we did not have the SRM-20 (view the problems in last week), we started with Arduino starter kits available at the FabLab, which include several input and outputs devices & sensors.
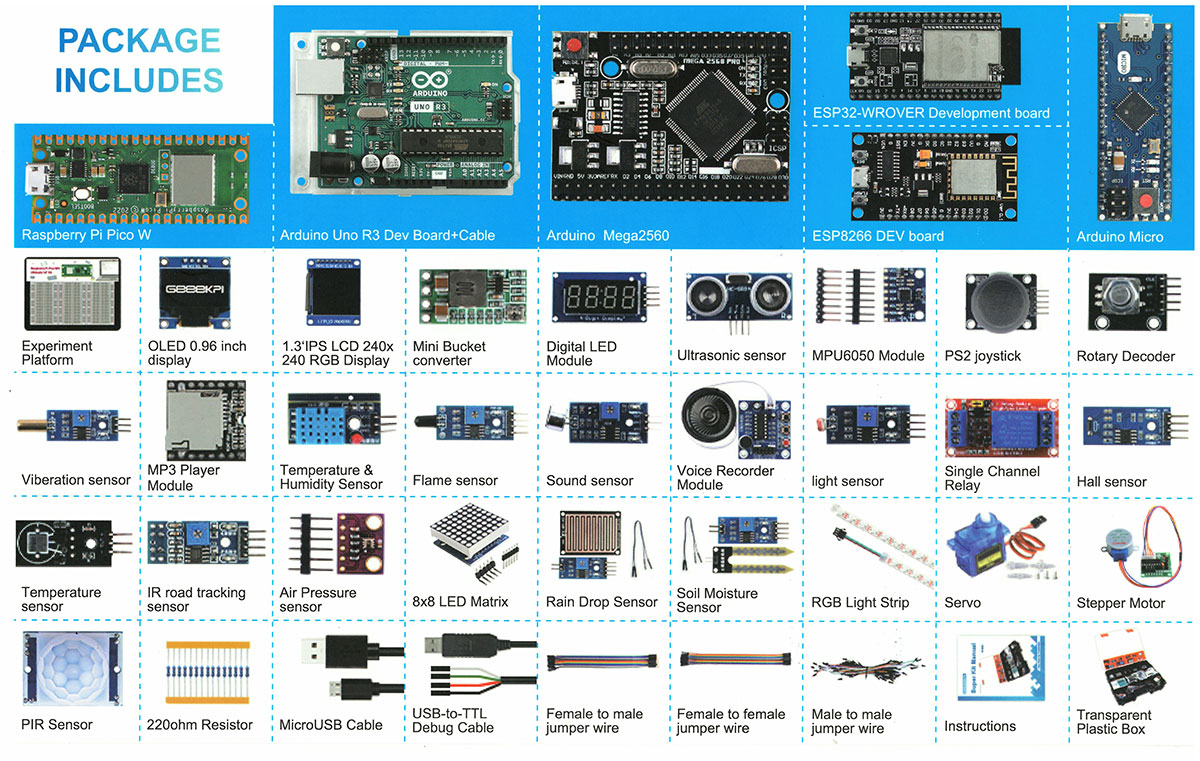
Summary of the sensor modules included in the kit, with their names in English (and Spanish), signal type, and a cropped image taken from the kit photo.
Arduino Kit Input devices & Sensors Reference
| Image | Name/Type | Nombre/tipo (Spanish) | Signal type |
|---|---|---|---|
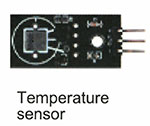 |
Temperature sensor (DS18B20) | Sensor de temperatura (DS18B20) | Digital |
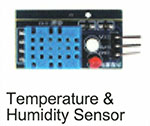 |
Temperature & Humidity sensor (DHT11/DHT22) | Sensor de temperatura y humedad | Digital |
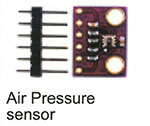 |
Air Pressure sensor | Sensor de presión del aire | Digital |
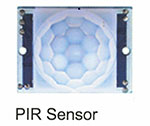 |
PIR sensor | Sensor PIR (movimiento) | Digital |
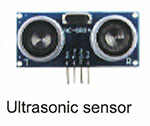 |
Ultrasonic sensor | Sensor ultrasónico | Digital |
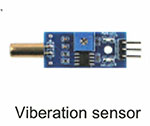 |
Vibration sensor | Sensor de vibración | Digital |
| IR road tracking sensor | Sensor IR de seguimiento de línea | Analog / Digital | |
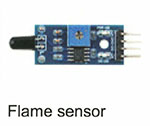 |
Flame sensor | Sensor de llama | Analog / Digital |
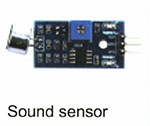 |
Sound sensor | Sensor de sonido | Analog / Digital |
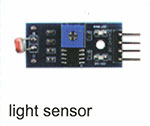 |
Light sensor (LDR) | Sensor de luz | Digital (analog sensor with comparator) |
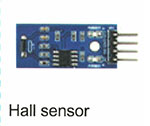 |
Hall sensor | Sensor Hall | Digital |
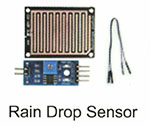 |
Rain drop sensor | Sensor de lluvia | Analog / Digital |
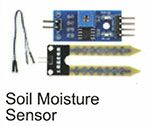 |
Soil moisture sensor | Sensor de humedad del suelo | Analog / Digital |
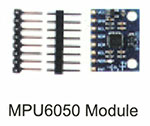 |
MPU6050 module | Módulo MPU6050 (acelerómetro + giroscopio) | Digital (I2C) |
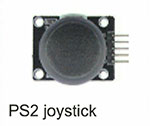 |
PS2 Joystick | Joystick PS2 | Analog (X,Y) + Digital (SW) |
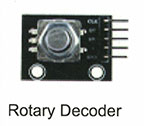 |
Rotary Encoder | Encoder rotatorio | Digital (pulses) + Digital (SW) |
Measure something: add a sensor to a microcontroller board that you have designed and read it.
Temperature & Humidity sensor (DHT11)
To begin the individual assignment, I decided to start by testing a digital sensor, specifically the DHT11 temperature and humidity sensor, which I had already used during the group assignment. In fact, part of this work was developed in parallel between the group and individual sections.
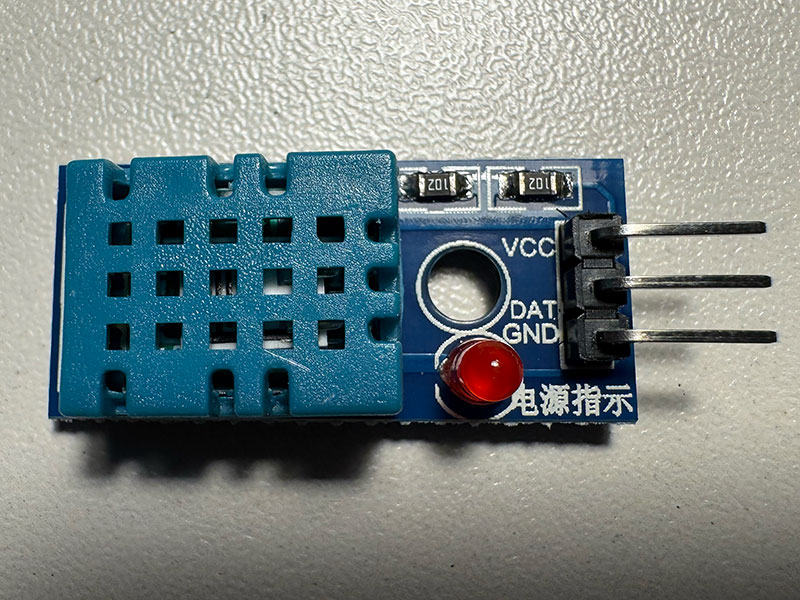
The first step was to connect the sensor to my PCB with the XIAO, using the 3.3V, GND, and DATA pins, with the data line connected to one of the digital pins, D7 (P1).
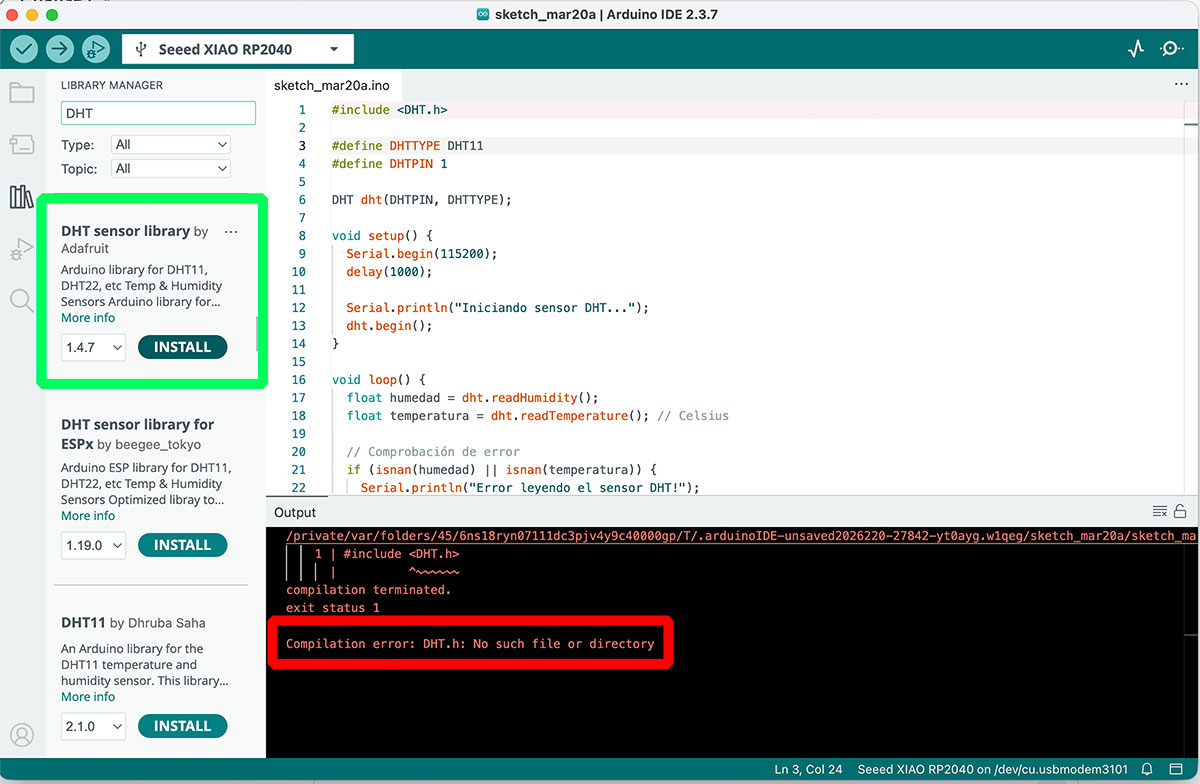
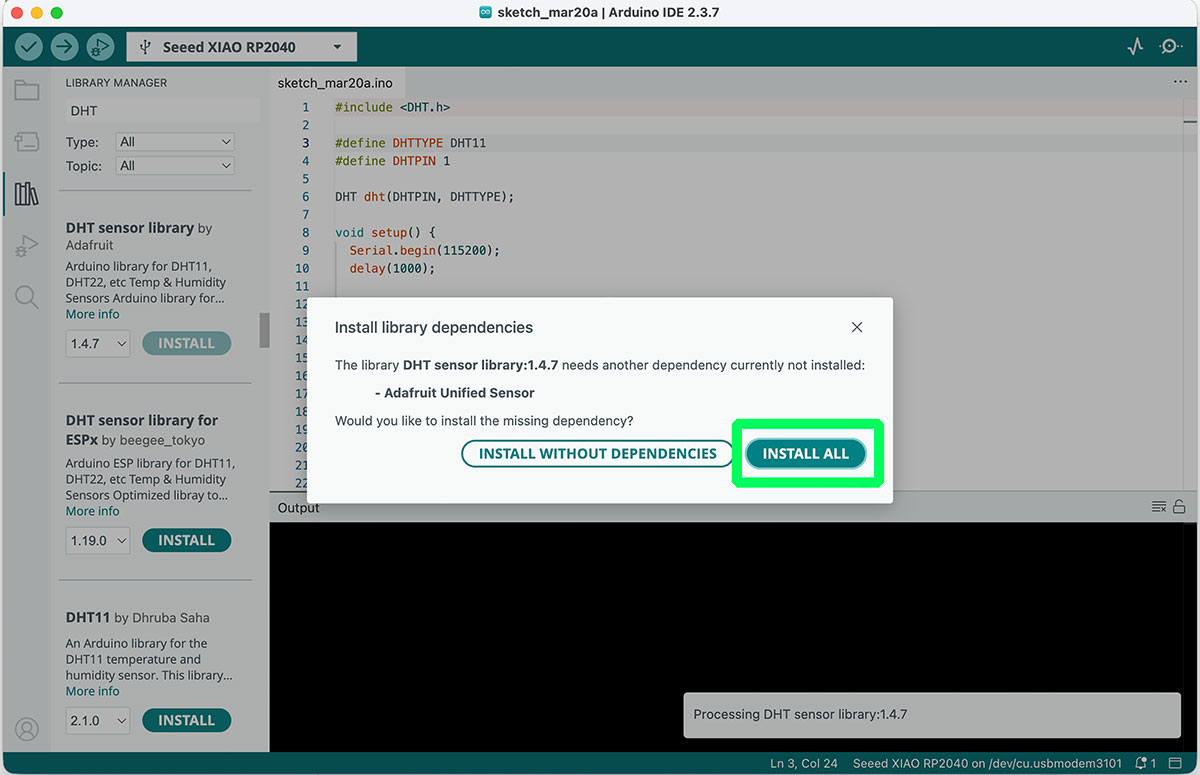
To read the sensor data in Arduino, it is necessary to use the “DHT.h ↗️” library, so I installed it from the Library Manager. During the installation, Arduino indicated that some dependent libraries were also required, such as Adafruit Unified Sensor, which I installed as well.
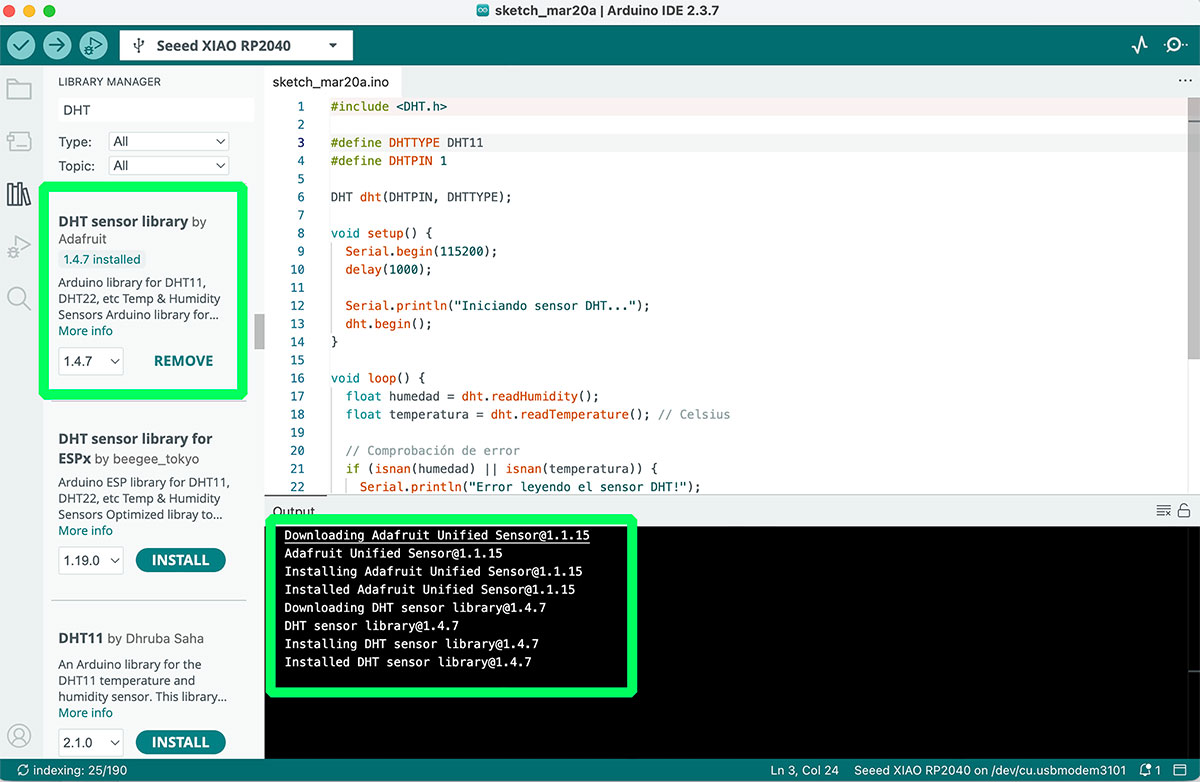
Once everything was configured, I ran a code that reads the sensor data every 2 seconds and displays it both in the Serial Monitor and in the Serial Plotter. This allowed me to quickly verify that the sensor was working correctly and to visualize how the values changed in real time.
DHT11 Pin Connection
| DHT11 Pin | Connected to XIAO RP2040 | Function |
|---|---|---|
| VCC | 3V3 | Power supply |
| DATA | D7 | Digital data signal |
| GND | GND | Ground |
High quality video available on my YouTube channel ↗️.
Arduino code · 01dht.ino Show code
#include

#define DHTTYPE DHT11
#define DHTPIN 1  // D7

DHT dht(DHTPIN, DHTTYPE);

void setup() {
  Serial.begin(115200);
  dht.begin();
}

void loop() {
  float humidity = dht.readHumidity();
  float temperature = dht.readTemperature();

  if (isnan(humidity) || isnan(temperature)) {
    return;
  }

  // SERIAL PLOTTER
  Serial.print("Temp:");
  Serial.print(temperature);
  Serial.print(" ");

  Serial.print("Hum:");
  Serial.println(humidity);

  // SERIAL MONITOR
  Serial.print("# Temp: ");
  Serial.print(temperature);
  Serial.print(" °C | Hum: ");
  Serial.print(humidity);
  Serial.println(" %");

  delay(2000);
}
ChatGPT prompt used to generate code · 01dht.ino Show prompt
Joystick movement/position detection
To complement the analog measurements previously performed with the multimeter, I developed an Arduino code that allows me to read the X and Y axis values of the joystick in real time. This way, I can not only observe how the analog signal changes, but also interpret those values to determine the joystick position (left, right, up, down, or center), providing a more complete understanding of how the sensor works.
The code starts by performing an automatic calibration of the joystick, reading the X and Y values at rest to establish a center reference. From that point on, in each loop iteration, the analog values are read using analogRead() and compared against this reference.
To make the readings more stable, I implemented a dead zone that filters out small fluctuations caused by noise. Depending on whether the values fall above or below this range, the program classifies the joystick position into different states (LEFT, RIGHT, UP, DOWN, or CENTER) and displays both the raw analog values and their interpreted position in the Serial Monitor.
Joystick Wiring to XIAO RP2040
| Joystick pin | XIAO RP2040 pin | Function |
|---|---|---|
| VCC | 3V3 | Power supply |
| GND | GND | Ground |
| VRX | A0 | Analog output for X axis |
| VRY | A1 | Analog output for Y axis |
| SW | Not connected | Push button output, not used in this test |
High quality video available on my YouTube channel ↗️.
Arduino code · 02joystick2.ino Show code
// Analog joystick with direction detection
// XIAO RP2040
// VRX -> A0
// VRY -> A1
// VCC -> 3V3
// GND -> GND

const int pinX = A0;
const int pinY = A1;

int centerX = 0;
int centerY = 0;

int deadZone = 200; // Dead zone to avoid noise around the center

void setup() {
  Serial.begin(115200);
  delay(2000); // Do not touch the joystick during calibration

  // Automatic center calibration
  centerX = analogRead(pinX);
  centerY = analogRead(pinY);

  Serial.println("Calibrated center:");
  Serial.print("X: ");
  Serial.println(centerX);
  Serial.print("Y: ");
  Serial.println(centerY);
}

void loop() {
  int xValue = analogRead(pinX);
  int yValue = analogRead(pinY);

  int stateX = 0;   // -1 = LEFT, 0 = CENTER, 1 = RIGHT
  int stateY = 0;   // -1 = DOWN, 0 = CENTER, 1 = UP

  // X axis detection
  if (xValue < centerX - deadZone) {
    stateX = -1; // LEFT
  } else if (xValue > centerX + deadZone) {
    stateX = 1; // RIGHT
  }

  // Y axis detection (inverted axis)
  if (yValue < centerY - deadZone) {
    stateY = 1; // UP
  } else if (yValue > centerY + deadZone) {
    stateY = -1; // DOWN
  }

  // Serial Monitor output
  Serial.print("X: ");
  Serial.print(xValue);
  Serial.print(" | Y: ");
  Serial.print(yValue);

  Serial.print(" | PosX: ");
  if (stateX == -1) Serial.print("LEFT");
  else if (stateX == 1) Serial.print("RIGHT");
  else Serial.print("CENTER");

  Serial.print(" | PosY: ");
  if (stateY == -1) Serial.print("DOWN");
  else if (stateY == 1) Serial.print("UP");
  else Serial.print("CENTER");

  Serial.println();

  delay(100);
}
ChatGPT prompt used to generate code · 02joystick2.ino Show prompt
Rain sensor (digital and Analog)
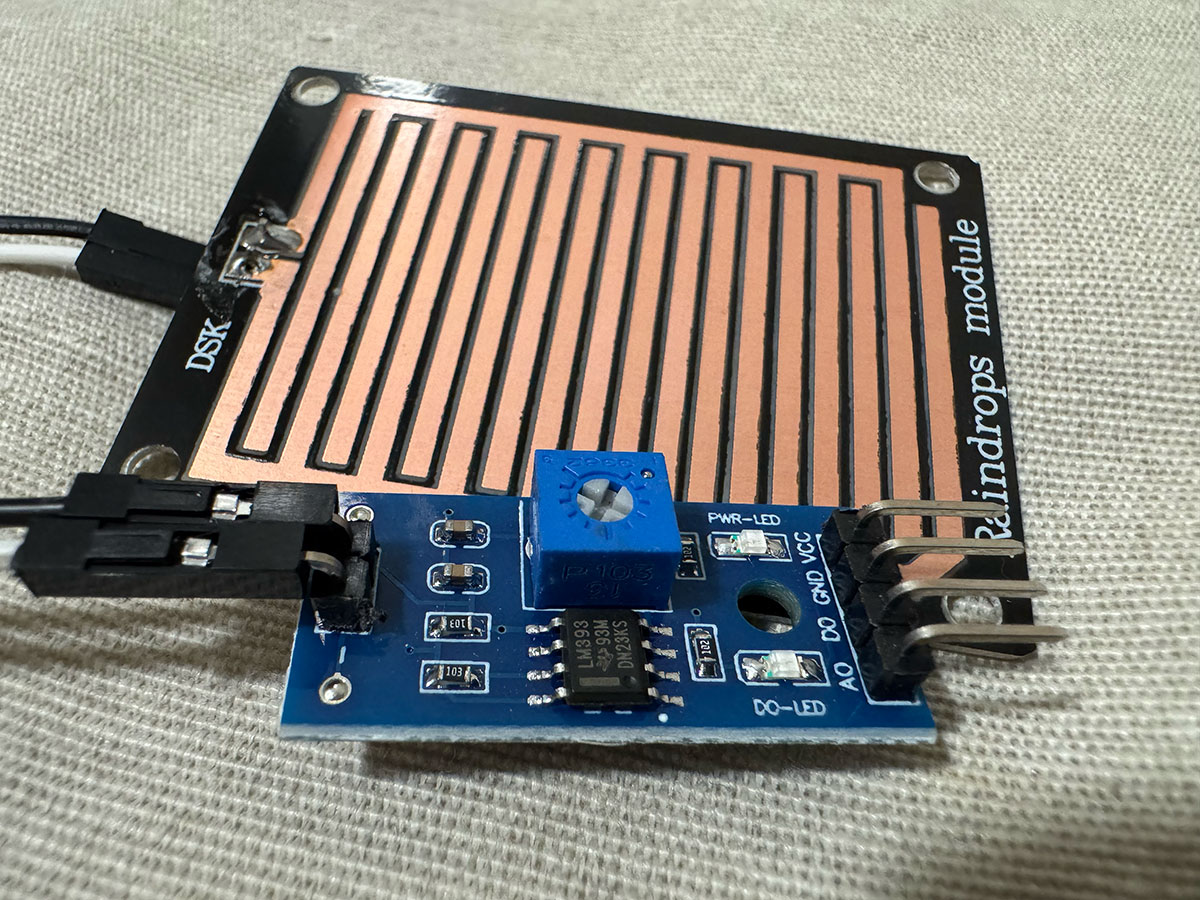
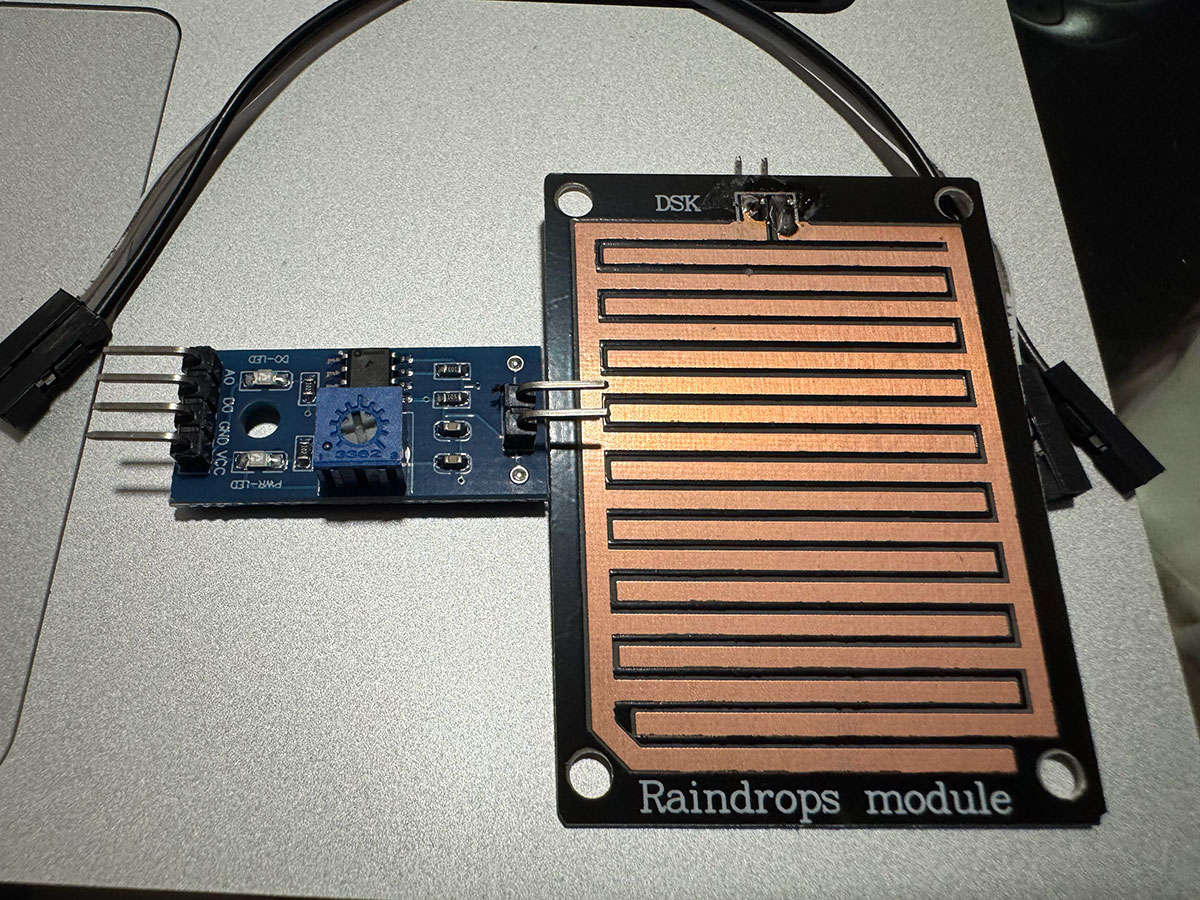
The rain sensor used in this project consists of a conductive plate that detects the presence of water through changes in the resistance between its tracks. When water comes into contact with the surface, the conductivity increases, and the electronic module converts this variation into both analog and digital signals. To better understand how the sensor behaves under different conditions, I wrote a simple program that allows me to see in real time what the sensor is “detecting”.
From the readings obtained, it can be observed that in a dry state the sensor outputs analog values close to the maximum (around 1000), while when water is applied these values drop significantly (to around 500). This clearly reflects the increase in conductivity on the surface and makes it easy to distinguish between dry and wet conditions.
Regarding the digital output, after adjusting the module’s potentiometer, I was able to set a threshold where just a small amount of water (a few drops) causes the sensor to change state and activate the integrated LED. This confirms that the detection threshold is properly configured, allowing the digital output to be used as a reliable indicator of rain presence.
In this way, the sensor can be used both to continuously measure moisture levels through the analog output, and to easily detect the presence of rain using the digital output.
Rain Sensor Wiring
| Rain Sensor Pin | XIAO RP2040 Pin | Function |
|---|---|---|
| VCC | 3V3 | Power supply |
| GND | GND | Ground |
| AO | A0 / P26 | Analog output reading |
| DO | D1 / A1 / P27 | Digital output reading |
High quality video available on my YouTube channel ↗️.
Arduino code · 03rain.ino Show code
#define RAIN_ANALOG A0      // AO → A0
#define RAIN_DIGITAL 27     // DO → P27 (D1)

void setup() {
  Serial.begin(115200);
  pinMode(RAIN_DIGITAL, INPUT);
}

void loop() {
  int analogValue = analogRead(RAIN_ANALOG);
  int digitalValue = digitalRead(RAIN_DIGITAL);

  Serial.print("Analog: ");
  Serial.print(analogValue);
  Serial.print(" | Digital: ");
  Serial.println(digitalValue);

  delay(500);
}
ChatGPT prompt used to generate code · 03rain.ino Show prompt
IR sensor -IR road tracking sensor- (digital and Analog)
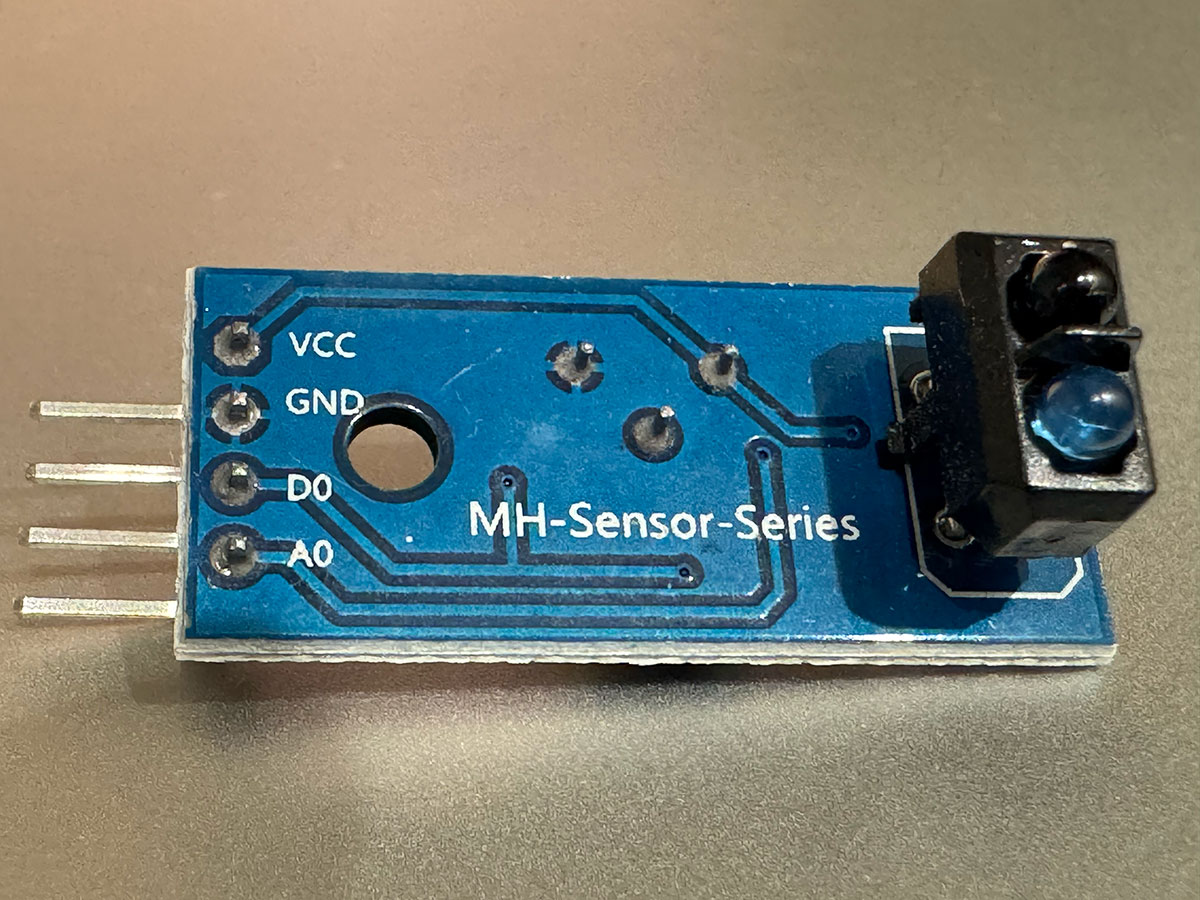
The sensor used in this case is an infrared reflection module, commonly known as an IR road tracking sensor. It is designed to detect differences in infrared light reflected by surfaces. The sensor works by emitting infrared radiation and measuring how much of that signal is received back, allowing it to distinguish between different materials or detect the presence of nearby objects.
To better understand its real behavior and evaluate whether it could be used in applications such as goal detection in a foosball table, I developed a small program that allows me to visualize in real time both the analog and digital outputs generated by the sensor.
From the collected data, it can be observed that the analog output varies depending on the amount of reflected infrared light: light-colored or nearby surfaces produce higher values, while darker or less reflective surfaces generate lower values. This makes it possible to detect changes in the environment, such as the presence or movement of an object.
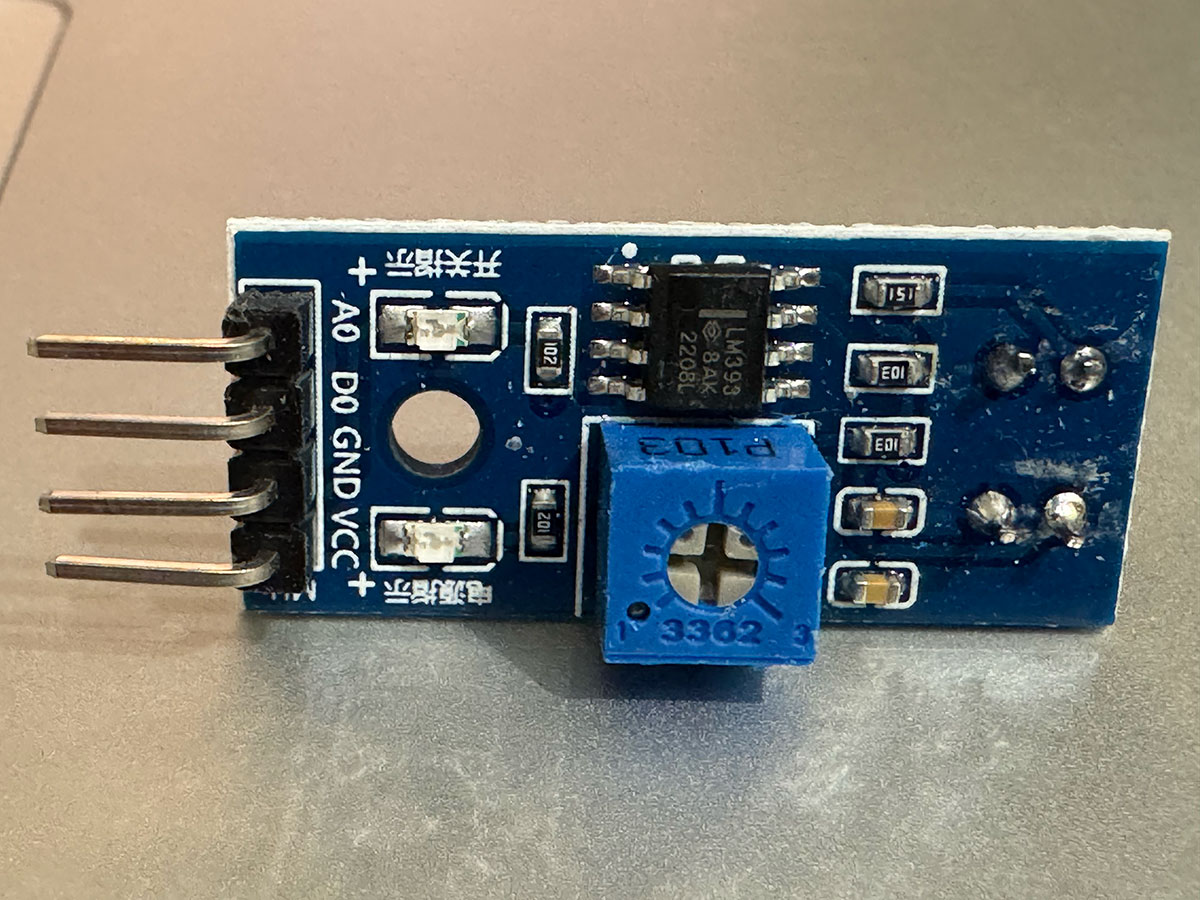
On the other hand, the digital output depends on a threshold set using the module’s potentiometer. When the analog signal crosses this threshold (either above or below, depending on the configuration), the output switches between 0 and 1. By properly adjusting this threshold, the sensor can reliably detect specific events, simplifying its use in applications where only a binary signal is needed.
The IR reflection sensor (MH-Sensor-Series) was connected to the XIAO RP2040 using both its analog and digital outputs. The sensor was powered at 3.3V to ensure compatibility with the logic levels of the microcontroller.
| Sensor Pin | Connected To (XIAO RP2040) | Description |
|---|---|---|
| VCC | 3V3 | Power supply (3.3V) |
| GND | GND | Common ground |
| A0 | A0 (P26) | Analog output (reflection intensity) |
| D0 | D1 (P27) | Digital output (threshold-based detection) |
Using both outputs allows comparing raw analog values with the threshold-based digital signal, which is useful for calibration and testing.
High quality video available on my YouTube channel ↗️.
Arduino code · 04IR.ino Show code
// Pins
const int analogPin = A0;   // Sensor A0 -> XIAO A0 (P26)
const int digitalPin = D1;  // Sensor D0 -> XIAO D1 (P27)

void setup() {
  Serial.begin(115200);

  pinMode(digitalPin, INPUT);

  Serial.println("IR Sensor test (Analog + Digital)");
}

void loop() {
  // Read analog value
  int analogValue = analogRead(analogPin);

  // Read digital value
  int digitalValue = digitalRead(digitalPin);

  // Print values
  Serial.print("Analog: ");
  Serial.print(analogValue);
  Serial.print(" | Digital: ");
  Serial.println(digitalValue);

  delay(200);
}
ChatGPT prompt used to generate code · 04IR.ino Show prompt
RCWL-0516 microwave motion sensor
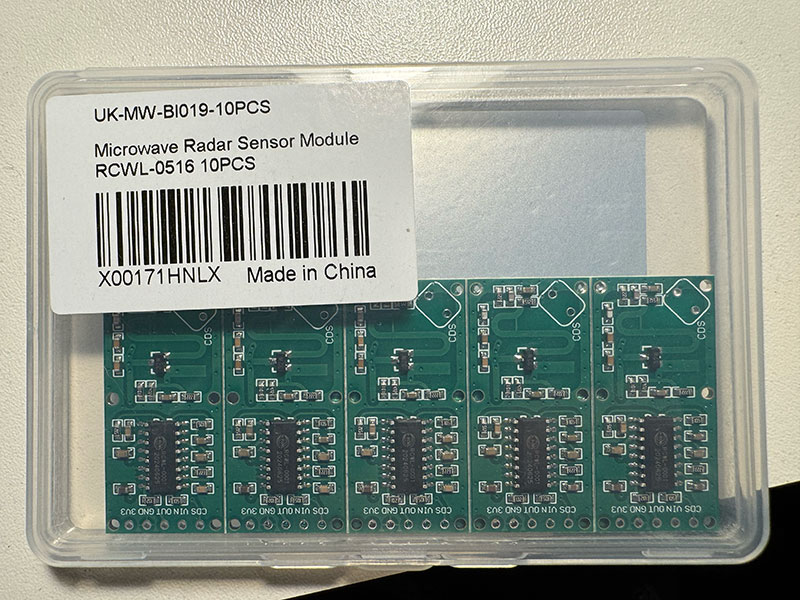
Unlike the previous sensors, this one was not included in the Arduino starter kit. In this case, I bought a pack of 10 RCWL-0516 modules on Amazon for around €9, with the intention of testing them and comparing their behavior with the MH-Sensor-Series motion sensor that I had used before.
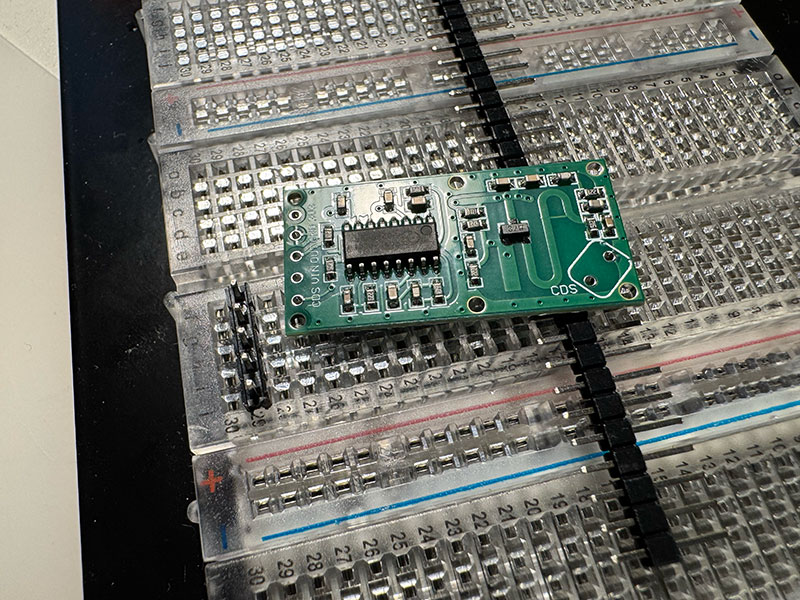
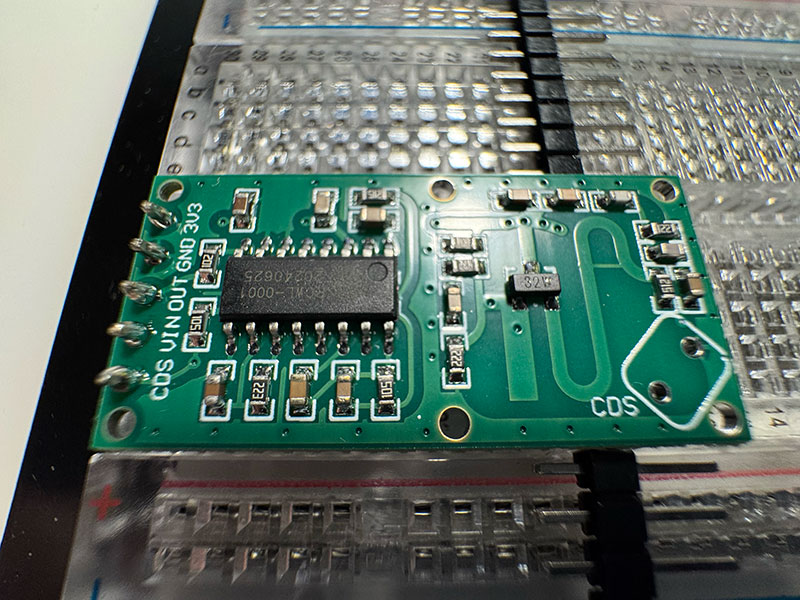
The RCWL-0516 is a microwave motion sensor based on Doppler radar. Instead of detecting heat like a PIR sensor, it works by emitting microwaves and analyzing changes in the reflected signal when movement occurs in front of the module. One of its most distinctive features is that it does not have a visible sensing element, since the antenna is integrated directly into the PCB itself.
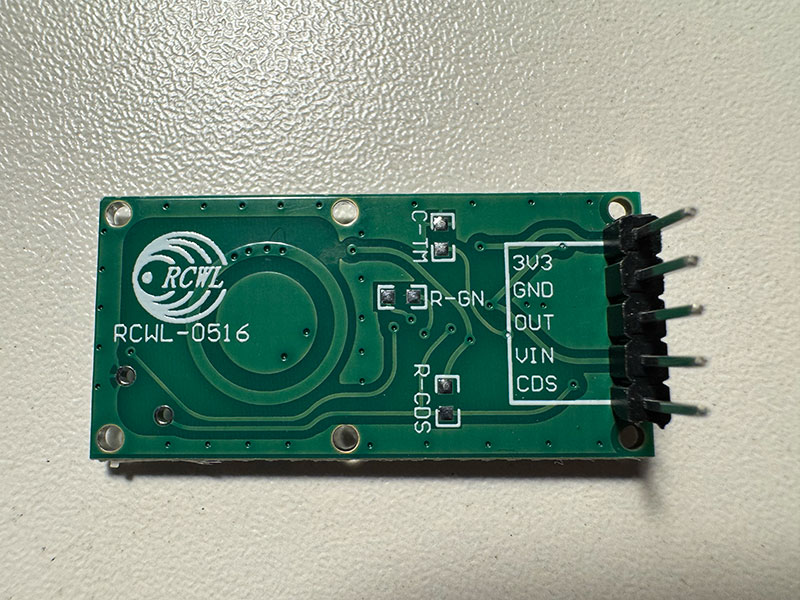
For the test, I connected the module to my XIAO-based PCB using VIN, GND, and OUT. The correct wiring was: VIN → 5V, GND → GND, and OUT → D1. At first the sensor did not respond, because I had incorrectly tried to power it through the 3V3 pin of the module. After reviewing the pinout and connecting it properly through VIN, the sensor started working correctly.
To read its behavior, I used a simple Arduino program that continuously checks the digital output. During the tests, I observed that the sensor remained at 0 when no motion was detected and changed to 1 when movement occurred. I also noticed that the response was much clearer when the module itself moved, which matches the expected behavior of a Doppler-based sensor.
After adjusting the test method and adding a 500 ms delay between readings, I could confirm that the module was also detecting my body movement. In practice, each motion event generated around five consecutive HIGH readings, which corresponds to approximately 2.5 seconds of active output. This shows that the sensor does not produce an extremely short pulse, but keeps the signal HIGH for a short hold time, making it easier to read from the microcontroller.
This simple test reads the digital output of the RCWL-0516 and prints its state to the serial monitor every 500 ms. A value of 0 means that no motion is being detected, while 1 indicates that motion has been detected. Using this delay made it easier to observe that each detection event kept the output active for around 2.5 seconds.
Sensor Wiring (XIAO RP2040)
The RCWL-0516 microwave motion sensor was connected to the XIAO RP2040 using its digital output. The module was powered through the VIN pin using 5V, as it requires a higher voltage than the typical 3.3V logic level of the microcontroller.
| Sensor Pin | Connected To (XIAO RP2040) | Description |
|---|---|---|
| VIN | 5V | Power supply input (recommended 4–28V) |
| GND | GND | Common ground |
| OUT | D1 (P27) | Digital output (motion detection signal) |
The OUT pin provides a digital signal that goes HIGH when motion is detected. The 3V3 pin of the module was not used, as it is a regulated output rather than a power input.
High quality video available on my YouTube channel ↗️.
Arduino code · 05RCWL1.ino Show code
const int sensorPin = D1;

void setup() {
  Serial.begin(115200);
  pinMode(sensorPin, INPUT);
  delay(1000);
  Serial.println("RCWL test start");
}

void loop() {
  int state = digitalRead(sensorPin);
  Serial.println(state);
  delay(500);
}
ChatGPT prompt used to generate code · 05RCWL1.ino Show prompt
Original code files for this documentation
Files for download
- Sensor DHT Temperature & Humidity Arduino code (01dht.ino) INO · 0,6 Kb
- Joystick movement Arduino code (02joystick.ino) INO · 0,4 Kb
- Joystick movement Arduino detect (02joystick2.ino) INO · 0,4 Kb
- Water test in rain sensor (03rain.ino) INO · 0,4 Kb
- IR test sensor (04IR.ino) INO · 0,4 Kb
- RCWL-0516 test sensor (05RCWL1.ino) INO · 0,2 Kb
Input devices testing for my final project
Taking advantage of the input devices tested this week, the RCWL-0516 microwave sensor and the IR road tracking sensor, I am going to do tests simulating a goal and have the sensor detect when the ball has entered and a player has scored a goal.
Final project development - Week09 sectionWeek questions/tasks
Final reflection
This has been a very interesting week, especially because I was able to directly apply what I learned to my Final Project. Going from not really understanding how a sensor works to having a basic understanding of its behavior has been a significant challenge for me, mainly due to my lack of background in electronics.
Learning about analog and digital signals, and how to use them depending on the desired outcome, has been particularly valuable. It has given me a clearer view of how input devices interact with the microcontroller and how that information can be used in a practical way.
Credits
I would like to thank to Javier ↗️ (FabLab Ponferrada Manager) for facilitating our access to the fablab and lend us material.
And to my wife, for her help in recording the videos.
All texts were written in Spanish and translated into English using Google Translate and ChatGPT.