14. Interface and application programming
This week, I created a web interface to control the DC motor I used in week 10 using a web browser.
We also did a group assignment for this week, which you can find here.I used the PCB I made during week 8 with an ESP32 to create a web server that serves an HTML page with a user interface.
I used the code from week 10 as a basis for the motor´s functionality.
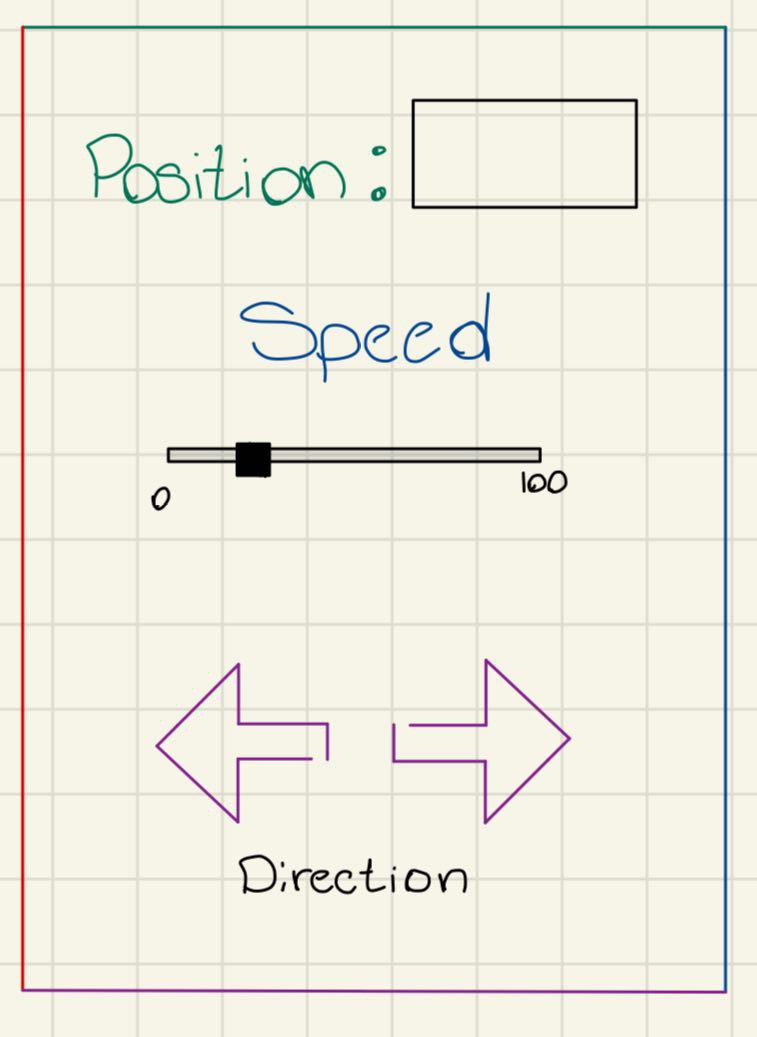
For the interface I wanted to control the motor´s speed and direction, I also wanted to display the motor´s position. I drew the interface as how I wanted it to look:
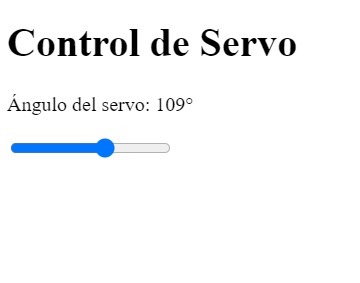
I had previously made a simple web interface to move a servo motor, but I didn´t knew how to improve its look:
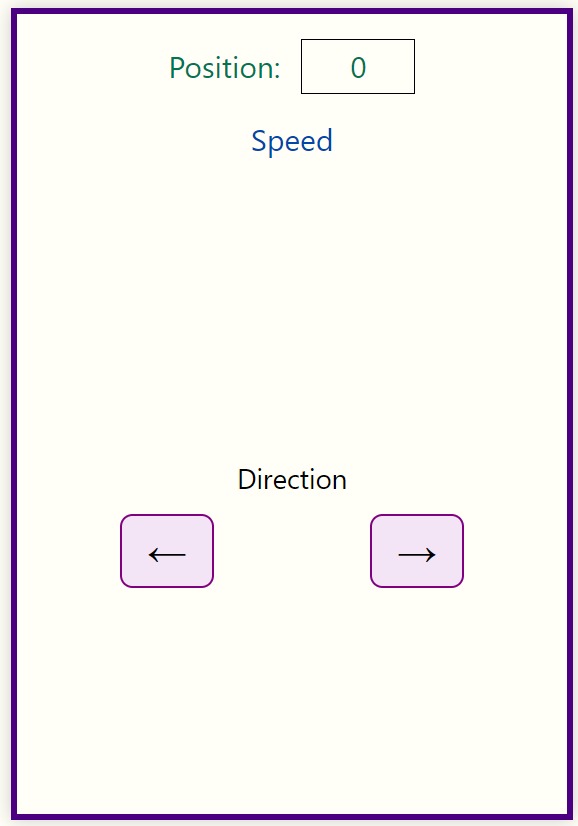
I tried uploading the drawing I made to ChatGPT so it could help me make the interface look nice. It gave me this HTML code:
!DOCTYPE html>
html lang="en">
head>
    meta charset="UTF-8" />
    title>Motor Control with RoundSlider
    link rel="stylesheet" href="https://cdn.jsdelivr.net/npm/round-slider@1.6.1/dist/roundslider.min.css"/>
    style>
    body {
        font-family: 'Segoe UI', sans-serif;
        background-color: #fffef7;
        display: flex;
        justify-content: center;
        align-items: center;
        height: 100vh;
    }
    .container {
        width: 400px;
        height: 600px;
        border: 5px solid #4b0082;
        padding: 20px;
        text-align: center;
        box-shadow: 0 0 15px rgba(0,0,0,0.2);
    }
    .position {
        color: #007550;
        font-size: 24px;
        margin-bottom: 20px;
    }
    .position span {
        border: 1px solid #000;
        padding: 5px 15px;
        margin-left: 10px;
        display: inline-block;
        min-width: 60px;
        text-align: center;
    }
    .speed-label {
        color: #0047ab;
        font-size: 24px;
        margin: 10px 0;
    }
    #speed-knob {
        margin: 0 auto;
        height: 200px;
        width: 200px;
    }
    .direction {
        font-size: 22px;
        margin-top: 30px;
    }
    .arrow-buttons {
        display: flex;
        justify-content: space-around;
        margin-top: 15px;
    }
    .arrow-buttons button {
        font-size: 32px;
        padding: 10px 20px;
        cursor: pointer;
        border: 2px solid #800080;
        border-radius: 10px;
        background-color: #f3e5f5;
        transition: background-color 0.3s;
    }
    .arrow-buttons button:hover {
        background-color: #e1bee7;
    }
    /style>
/head>
body>
    div class="container">
    div class="position">Position: .span id="pos">0/span>/div>
    div class="speed-label">Speed/div>
    div id="speed-knob">/div>
    div class="direction">Direction/div>
    div class="arrow-buttons">
        button onclick="setDir('left')">/button>
        button onclick="setDir('right')">/button>
    /div>
    /div>

    script src="https://cdn.jsdelivr.net/npm/round-slider@1.6.1/dist/roundslider.min.js">
    script>
    $("#speed-knob").roundSlider({
        radius: 100,
        width: 16,
        min: 0,
        max: 255,
        value: 0,
        handleSize: "+8",
        handleShape: "round",
        sliderType: "min-range",
        circleShape: "pie",
        startAngle: 315,
        drag: function (args) {
        fetch("/setSpeed?value=" + args.value);
        }
    });

    function setDir(dir) {
        fetch("/setDir?value=" + dir);
    }

    setInterval(() => {
        fetch("/getPos")
        .then(res => res.text())
        .then(val => {
            document.getElementById("pos").textContent = val;
        });
    }, 500);
    /script>
/body>
/html>
I opened a new HTML file in VS Code and with the Live Preview extension I viewed how the interface looked like:
After seeing the interface I wanted to add a graph to show the motor speed. I found a library called Chart.js that allows you to create beautiful graphs. I added the library to the HTML code and created a line chart to display the motor speed in real-time.
const chart = new Chart(ctx, {
    type: 'line',
    data: {
    labels: labels,
    datasets: [{
        label: 'Speed',
        data: data,
        borderColor: '#4b0082',
        tension: 0.2,
        fill: false
    }]
    },
    options: {
    scales: {
        x: { display: false },
        y: { min: 0, max: 255 }
    }
    }
});
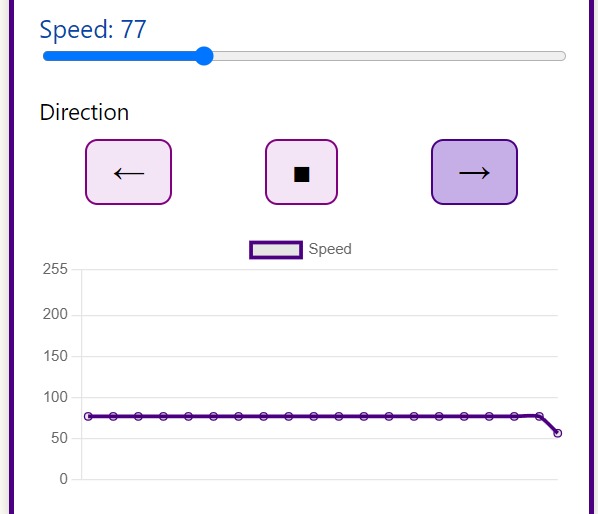
I also noticed that the buttons to change the motor´s direction didn´t had a way to show that they were pressed, so I added some logic to change color when pressed, I also added a stop button.
div class="arrow-buttons">
    button id="leftBtn" onclick="setDir('left')">←/button>
    button id="stopBtn" onclick="setDir('stop')">■/button>
    button id="rightBtn" onclick="setDir('right')">→/button>
    /div>
.arrow-buttons button.active {
    background-color: #c6afe6;
    border-color: #4b0082;
    font-weight: bold;
    }
function setDir(dir) {
    fetch("/setDir?value=" + dir);

    // Clear all button states
    document.getElementById("leftBtn").classList.remove("active");
    document.getElementById("rightBtn").classList.remove("active");
    document.getElementById("stopBtn").classList.remove("active");

    // Highlight selected button
    if (dir === "left") {
        document.getElementById("leftBtn").classList.add("active");
    } else if (dir === "right") {
        document.getElementById("rightBtn").classList.add("active");
    } else if (dir === "stop") {
        document.getElementById("stopBtn").classList.add("active");
    }
    }
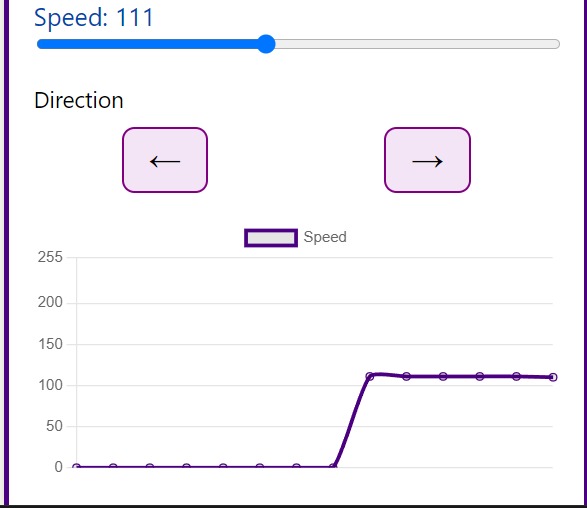
Here´s how it looked like:
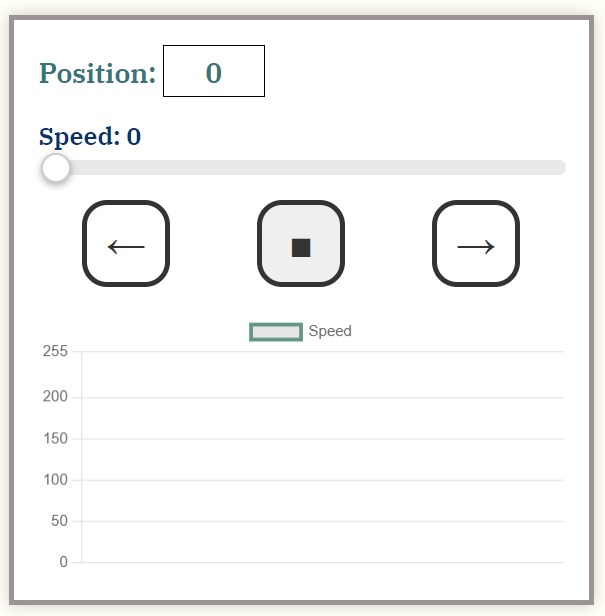
I was happy with the result, but I wanted to make it look more professional. I changed the font and colors to improve the appearance of the interface. I also made the graph look nicer by changing its colors. And here´s how looks:
Here´s the final HTML code .
Here's the final code I uploaded to my ESP32.
The web interface includes a speed slider, direction buttons, and a real-time graph that displays the motor's speed. The graph updates every second to provide a live view of the motor's performance.
I connected my phone to the ESP32 wifi network and pasted the IP into a browser.
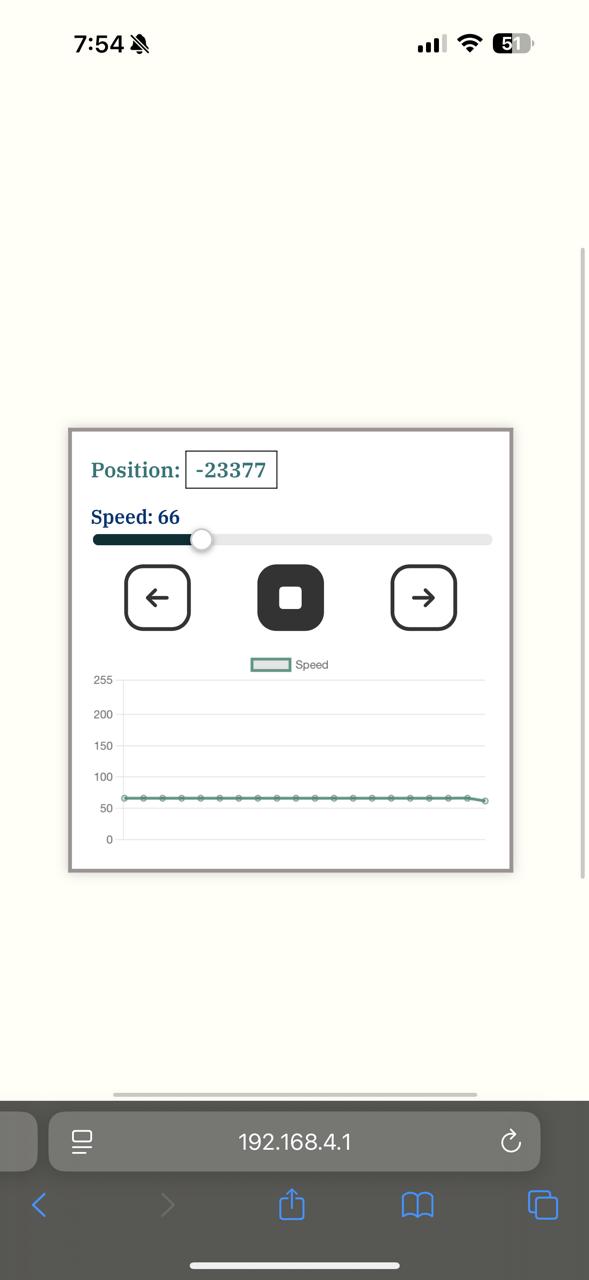
The image has the IP I used, which I found inside the WiFi setting.s
Summary
This week, I learned how to create a web interface to control a DC motor using an ESP32. I used HTML, CSS, and JavaScript to create a user-friendly interface. I also learned how to use Chart.js to create real-time graphs. This project helped me understand how to integrate hardware with software and create a complete system.