Electronic and programming.
With most of the encloser done with and since I have also finished printing my board, lets now mover to programming my board to be able to send the data it receives to a web server and hopefully with that data I turn that data dynamic.
For this I read through the Random nerds tutorial on how to create graphs using sensor data. Ohh lord hopefully I can get this completed! I really think that its going to be a bit tough as there are several steps to follow to even before the actual programming process begins! But now without further a do let get right into it.
To use the data collected and turn it into charts, we will be using a html file and a arduino sketch. For the arduino sketch we will have to install the ESPAsyncWebserver and the AsyncWebserver. Then we have to download the file upload plugin(NOTE: the plug in only works for the legacy version 1.8.x) Then we have to create a html file that is able to receive the data from my board and then put it into graphs using the high charts library to turn the data collected into charts. OHH lord! that a lot of work that we will have to do! But lets get right into it.
Firstly lets get to creating our plan on how we will face this and start with it!:
Plan
Firstly we will install the file uploader plugin so that we will be able to uplaod our html file to our board.
Next we will have to install the ESPAsyncWebserver and the AsyncWebserver libaries.
Then will have to edit the code they made to fit my own specific means. (Meaning I will have to make the code work using the Xiao esp32 c3 and then also adjust it so that it works using the soil moisture and the DHT sensor.)
Now I will have to change the html code to make it according to my own needs.
schedule/ work plan - 1 week and more before presentation!
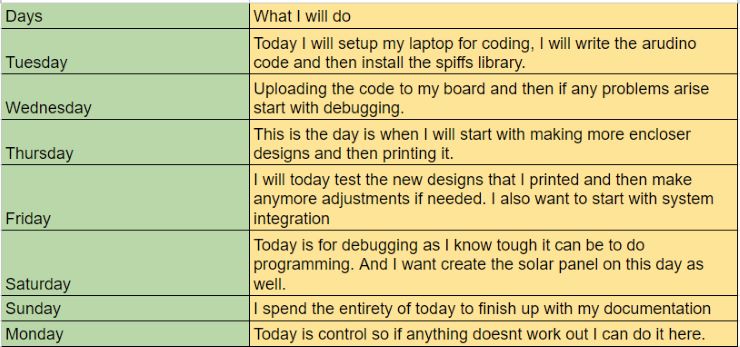
With about 1 week and 4 days left I want to finish everything before the presentation so that I have a bit of time to prepare for the final presentation.
WOW thats a lot of work that needs to be done. So without any further interference, lets get right into it!
File uploader plug in.
As in written in my plan, lets download the file uploader plug in. This add in will allow us to upload files that are not arduino sketches such as html file to our xiao esp32 c3 board. This is really important for our project as without this, we would not be able to upload our html file, meaning no data charts.
Also the plug in only works on the legacy version of the arduino IDE(1.8.x). To start with installing the plug in I first started with going to the random nerds documentation and then tutorial and going to the link that will take me to the file uploader plug in repository.
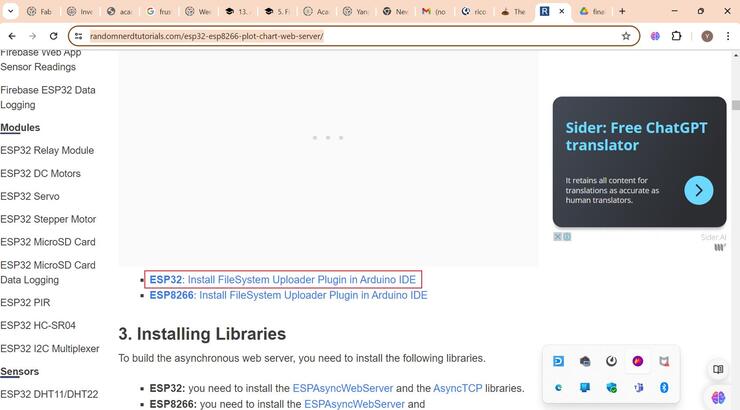
After following the link you will be met with this page. This is where you can download the plug in. This is the link to the download git page --> Download
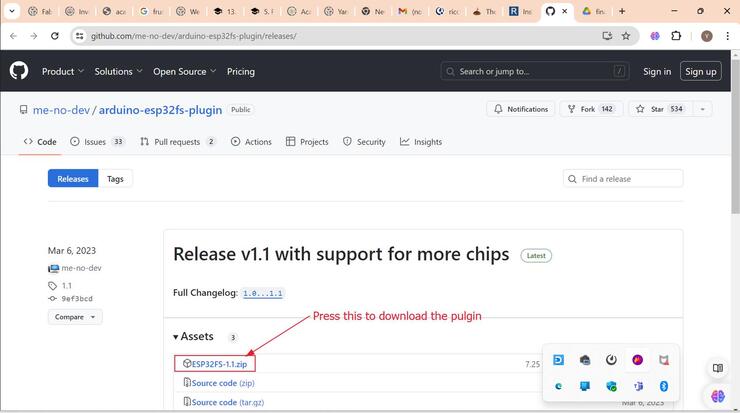
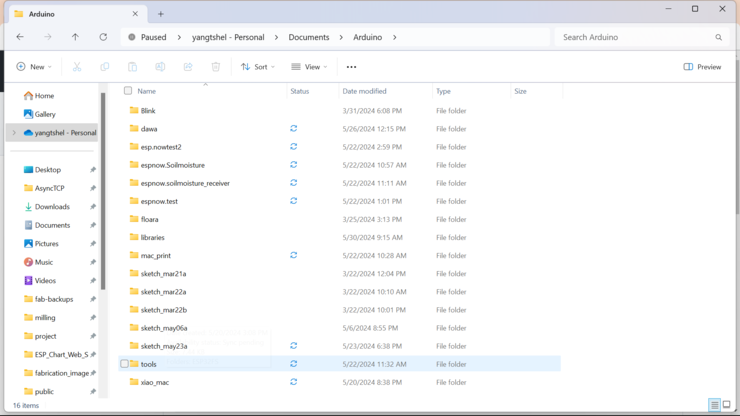
After downloading the zip file, you will have to go to your arduino file and there you will have to create a folder called tools and unzip the downloaded file and then place it inside there.
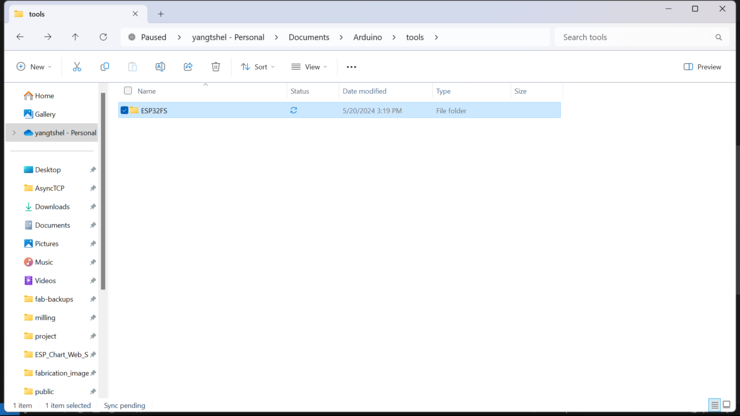
Next you can see the file upload option on your arduino ide under the tools option.
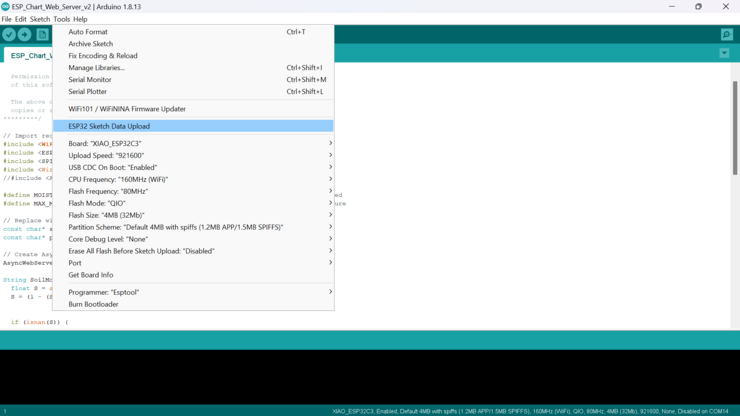
With that we are now done with installing and implementing the file uploader plug in, into our arduino IDE. Before moving on though, lets go on how to actually use it.
Firstly to use the file uploader plugin we first have to create a folder named data next to our arduino sketch.
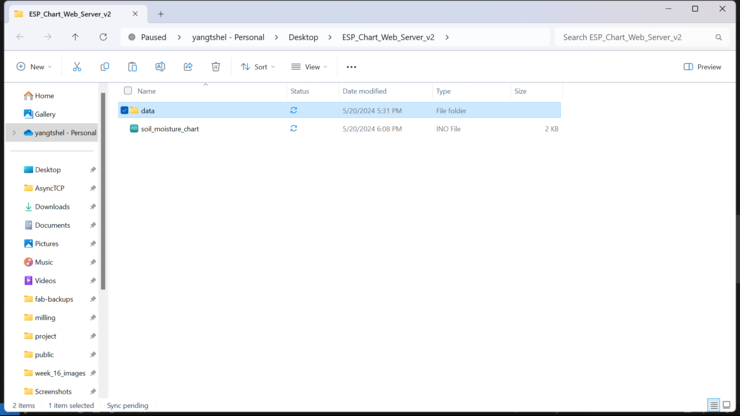
Next we have to put our html file inside the data folder and then name it index.
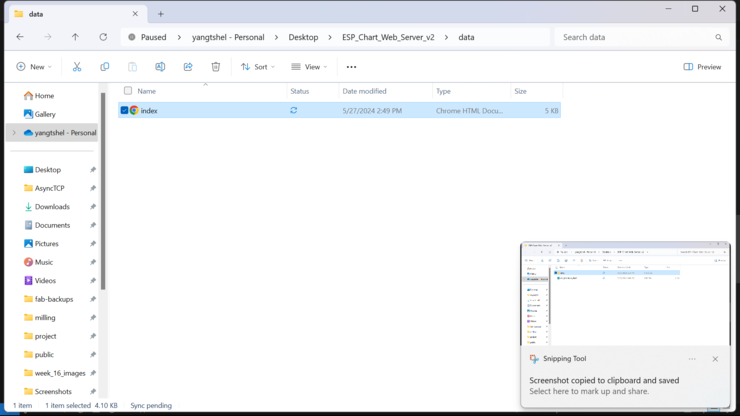
All of this has to be done as without this process the file uploader wont be able to upload the html file we want it to. Now we have finished with the installation of the file uploader.
Downloading libraries.
Now we have to download the libraries that are necessary for the code to work as we want. The libraries we are going to be downloading will be the ESPAsyncWebserver and the AsyncWebserver library. We want our code to be able to updates the values gets and then send it to the web server, To do that we will have to create an asynchronous web server to be able to send data both ways and then being able to update the values on the web server without having to refresh the page all the time. An asynchronous webserver will be able to maintain the webserver charts while also being able to receive data and update itself without having to refresh the webserver.
To create this asynchronous webserver we have to download the above mentioned libraries. Therefore lets get right into downloading the libraries!
Firstly like before we have to go the random nerds website (Thank you very much! I don't know how I would have been able to complete this project without this great documentation! Random Nerds.) and then search for the webserver libraries and the then click on the link to go to the git lab page to download the library.
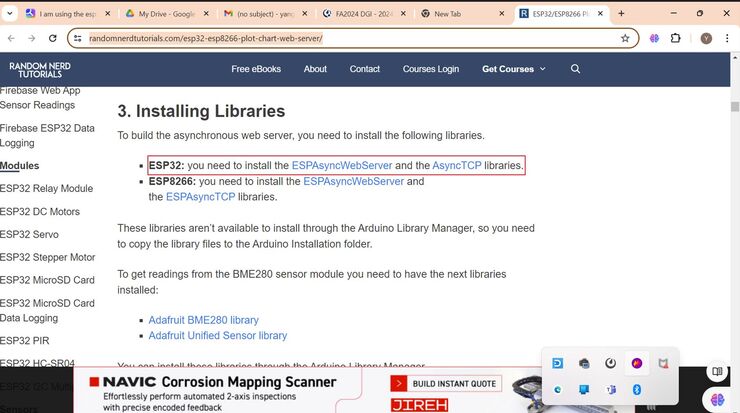
After going to the link, you have to download the file.
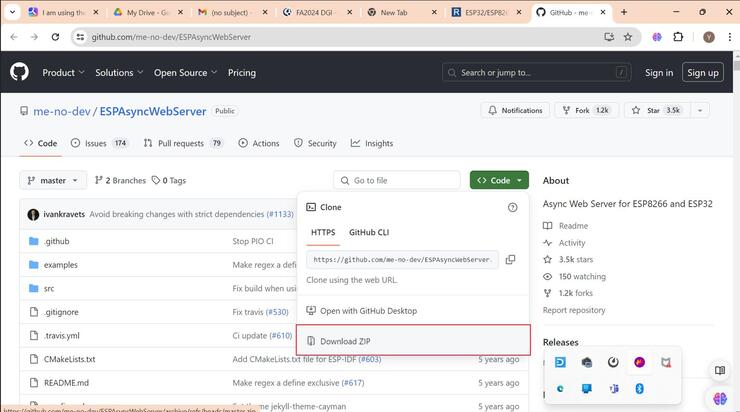
Pressing download zip will download the zip file which then you have to extract to the arduino library file.(NOTE: There are two mentioned libraries in documentation. You have to download both of them, as the library wont work with only one of them! )
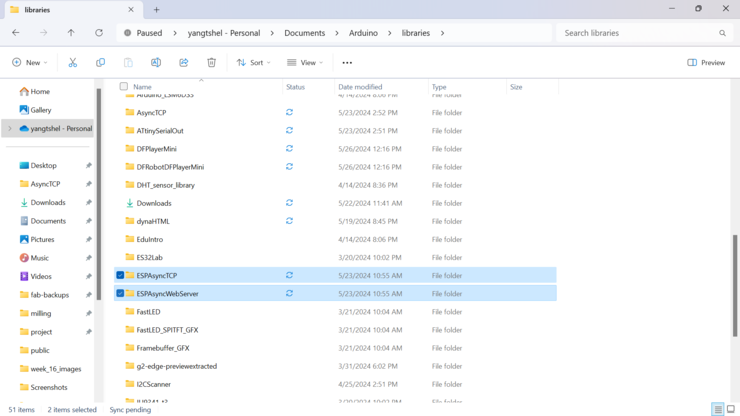
After that I am done with downloading the libraries(NOTE: I thought that I downloaded all the libraries but there was this one crucial library that I hadn't installed that would make the next few hours for me into hell.)
Arduino programming !
Now we have to create our arduino code that would work with my components(The soil moisture and the DHT sensor.) Firstly I just looked at and studied the code that the random nerds documentation provided. After I studied the code they supplied, I removed the some lines of the code that weren't required. The lines I removed were:
        #else
          #include <Arduino.h>
          #include <ESP8266WiFi.h>
          #include <Hash.h>
          #include <ESPAsyncTCP.h>
          #include <ESPAsyncWebServer.h>
          #include <FS.h>
        #endif
        #include <Wire.h>
        #include <Adafruit_Sensor.h>
        #include <Adafruit_BME280.h>
Firstly I removed the else command which included the required libraries for the esp8266. Since I am not using the Adafruit sensor and I have no components that work on I2C, I can simply remove thees libraries as well. With that also all the commands that require these library.
        String readBME280Temperature() {
          // Read temperature as Celsius (the default)
          float t = bme.readTemperature();
          // Convert temperature to Fahrenheit
          //t = 1.8 * t + 32;
          if (isnan(t)) {
            Serial.println("Failed to read from BME280 sensor!");
            return "";
          }
          else {
            Serial.println(t);
            return String(t);
          }
        }

        String readBME280Humidity() {
          float h = bme.readHumidity();
          if (isnan(h)) {
            Serial.println("Failed to read from BME280 sensor!");
            return "";
          }
          else {
            Serial.println(h);
            return String(h);
          }
        }

        String readBME280Pressure() {
          float p = bme.readPressure() / 100.0F;
          if (isnan(p)) {
            Serial.println("Failed to read from BME280 sensor!");
            return "";
          }
          else {
            Serial.println(p);
            return String(p);
          }
        }
Next I removed these codes as these code are for the adafruit sensor that I am not using. I would have to create my own new function that utilizes my sensors.
        server.on("/temperature", HTTP_GET, [](AsyncWebServerRequest *request){
            request->send_P(200, "text/plain", readBME280Temperature().c_str());
          });
          server.on("/humidity", HTTP_GET, [](AsyncWebServerRequest *request){
            request->send_P(200, "text/plain", readBME280Humidity().c_str());
          });
          server.on("/pressure", HTTP_GET, [](AsyncWebServerRequest *request){
            request->send_P(200, "text/plain", readBME280Pressure().c_str());
          });
Next I would have to remove these codes which as these code require the functions that I changed in the previous step. I would have to change these code accordingly to my own code.
With all of these changes being pointed out, I now have to write the code then I will be able to start uploading it!
I rewrote the code according to my needs. This is the code(NOTE: This code utilizes only the soil moisture sensor so that it will also only generate one chart.)
        /*********
          Rui Santos
          Complete project details at https://RandomNerdTutorials.com

          Permission is hereby granted, free of charge, to any person obtaining a copy
          of this software and associated documentation files.

          The above copyright notice and this permission notice shall be included in all
          copies or substantial portions of the Software.
        *********/

        // Import required libraries
        #include <WiFi.h>
        #include <ESPAsyncWebServer.h>
        #include <SPIFFS.h>


        #define MOISTURE_SENSOR_PIN 3  // Analog pin where the soil moisture sensor is connected
        #define MAX_MOISTURE_VALUE 4095  // Maximum value of the sensor reading for full moisture

        // Replace with your network credentials
        const char* ssid = "DGI";
        const char* password = "LetMePass!";

        // Create AsyncWebServer object on port 80
        AsyncWebServer server(80);

        String SoilMoisture() {
          float S = analogRead(MOISTURE_SENSOR_PIN);
          S = (1 - (S / (float)MAX_MOISTURE_VALUE)) * 100;


          if (isnan(S)) {
            Serial.println("Failed to read from Soil moisture sensor");
            return "";
          }
          else {
            Serial.println(S);
            return String(S);
          }
        }


        void setup() {
          // Serial port for debugging purposes
          Serial.begin(115200);

          pinMode(MOISTURE_SENSOR_PIN, INPUT);


          if (!SPIFFS.begin()) {
            Serial.println("an error has occurred while mounting SPIFFS");
            return;
          }

          // Connect to Wi-Fi
          WiFi.begin(ssid, password);
          while (WiFi.status() != WL_CONNECTED) {
            delay(1000);
            Serial.println("Connecting to WiFi..");
          }

          // Print ESP32 Local IP Address
          Serial.println(WiFi.localIP());

          // Route for root / web page
          server.on("/", HTTP_GET, [](AsyncWebServerRequest * request) {
            request->send(SPIFFS, "/index.html");
          });
          server.on("/soilMoisture", HTTP_GET, [](AsyncWebServerRequest * request) {
            request->send_P(200, "text/plain", SoilMoisture().c_str());
          });

          // Start server
          server.begin();
        }

        void loop() {

        }
In the code I made it so that the reading that the soil moisture sensor gets will be turned into percentage and then be displayed on the webserver. With the code done with I complied once to see if the code was working as wanted. after the compiling was done, it failed!!!
        C:\Users\yangt\OneDrive\Documents\Arduino\libraries\ESPAsyncWebServer\src\WebAuthentication.cpp:74:3: error: 'mbedtls_md5_starts_ret' was not declared in this scope; did you mean 'mbedtls_md5_starts'?
          74 |   mbedtls_md5_starts_ret(&_ctx);
              |   ^~~~~~~~~~~~~~~~~~~~~~
              |   mbedtls_md5_starts
        C:\Users\yangt\OneDrive\Documents\Arduino\libraries\ESPAsyncWebServer\src\WebAuthentication.cpp:75:3: error: 'mbedtls_md5_update_ret' was not declared in this scope; did you mean 'mbedtls_md5_update'?
          75 |   mbedtls_md5_update_ret(&_ctx, data, len);
              |   ^~~~~~~~~~~~~~~~~~~~~~
              |   mbedtls_md5_update
        C:\Users\yangt\OneDrive\Documents\Arduino\libraries\ESPAsyncWebServer\src\WebAuthentication.cpp:76:3: error: 'mbedtls_md5_finish_ret' was not declared in this scope; did you mean 'mbedtls_md5_finish'?
          76 |   mbedtls_md5_finish_ret(&_ctx, _buf);
              |   ^~~~~~~~~~~~~~~~~~~~~~
              |   mbedtls_md5_finish
        C:\Users\yangt\OneDrive\Documents\Arduino\libraries\ESPAsyncWebServer\src\AsyncEventSource.cpp: In member function 'void AsyncEventSourceClient::_queueMessage(AsyncEventSourceMessage*)':
        C:\Users\yangt\OneDrive\Documents\Arduino\libraries\ESPAsyncWebServer\src\AsyncEventSource.cpp:189:7: error: 'ets_printf' was not declared in this scope; did you mean 'vswprintf'?
          189 |       ets_printf("ERROR: Too many messages queued\n");
              |       ^~~~~~~~~~
              |       vswprintf
        exit status 1
        Error compiling for board XIAO_ESP32C3.
This is the error message after close inspection it suggested a problem with the library where there were several syntax mistakes.
After inspecting the error message I went on to the ESPAsyncWebserver library and fixed each and every error message show above. But even after doing all that the code wont compile for my board.
        exit status 1
        Error compiling for board XIAO_ESP32C3.
I even tried reinstalling the libraries but it didn't work. It stayed like this for several hours and then suddenly something hit me! There were several people who used the same library and then it worked for them. Therefore the problem didn't lie in the library. Thinking more, the arduino IDE software was created to program arduino boards and not esp boards. Maybe somehow the esp32 codes weren't properly compiling in arduino IDE! For that there must be a library that makes it work. So then I set out on finding this library. I installed about 15 libraries when I found the library I was looking for. It is the arduino esp library.
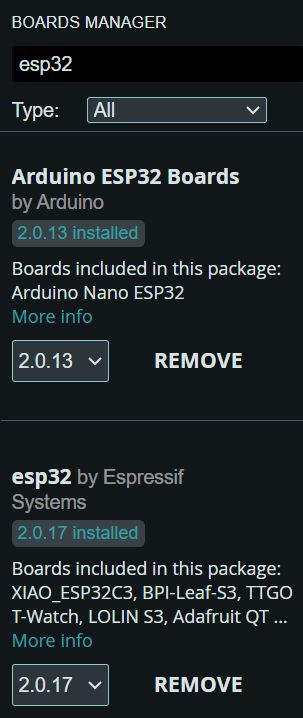
I still do not fully understand how this library was able to fix my problem but I am still grateful that it works!
Later after all of this is over, I must come back and try to understand more about the esp and its limitations.
Html file
Now the last step towards our procedure we have to see change the html file and then and then upload the file to my xiao esp 32 c3.
Firstly I would have to change the html file to my terms of only using 1 chart for now.
I simply changed the amount of charts used and then also made my request open the data that is being fetched from the Xiao esp32 c3.
<head>
          <meta name="viewport" content="width=device-width, initial-scale=1">
          <script src="https://code.highcharts.com/highcharts.js"></script>
          <style>
            body {
              min-width: 310px;
                max-width: 800px;
                height: 400px;
              margin: 0 auto;
            }
            h2 {
              font-family: Arial;
              font-size: 2.5rem;
              text-align: center;
            }
          </style>
        </head>
        <body>
          <h2>Farm soil node</h2>
          <div id="chart-moisture" class="container"></div>
          <div id="chart-humidity" class="container"></div>
          <div id="chart-tempreture" class="container"></div>
        </body>
        <script>
        var chartT = new Highcharts.Chart({
          chart:{ renderTo : 'chart-moisture' },
          title: { text: 'Soil Moisture' },
          series: [{
            showInLegend: false,
            data: []
          }],
          plotOptions: {
            line: { animation: false,
              dataLabels: { enabled: true }
            },
            series: { color: '#059e8a' }
          },
          xAxis: { type: 'datetime',
            dateTimeLabelFormats: { second: '%H:%M:%S' }
          },
          yAxis: {
            title: { text: 'Soil Moisture' }
            //title: { text: 'Temperature (Fahrenheit)' }
          },
          credits: { enabled: false }
        });
        setInterval(function ( ) {
          var xhttp = new XMLHttpRequest();
          xhttp.onreadystatechange = function() {
            if (this.readyState == 4 && this.status == 200) {
              var x = (new Date()).getTime(),
                  y = parseFloat(this.responseText);
              //console.log(this.responseText);
              if(chartT.series[0].data.length > 40) {
                chartT.series[0].addPoint([x, y], true, true, true);
              } else {
                chartT.series[0].addPoint([x, y], true, false, true);
              }
            }
          };
          xhttp.open("GET", "/soilMoisture", true);
          xhttp.send();
        }, 30000 ) ;
        </script>
        </html>
With the html file now done I just had to upload it in my board. Remember to place the file in a folder named data and then the file itself should be named index.(NOTE: While writing the name of the html file, do not write index.html! This is because the ".html" Will automatically be there once you change the file name to index. If you do change the name to index.html, the actual file name will become index.html.html which the file uploader plug in wont recognize. )
Now all you have to do is to press the sketch data upload!

Results
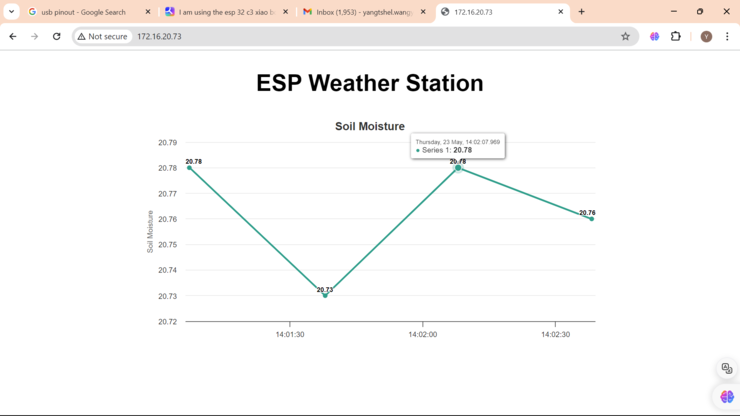
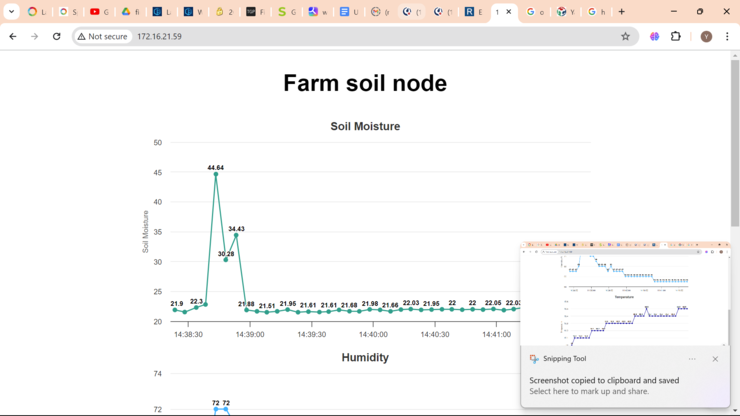
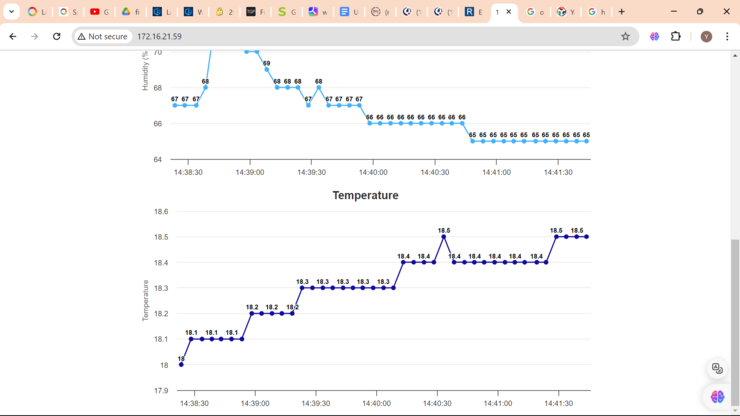
All that work was a success! Now I will try to do it with all my sensors combined!
I just rewrote the arduino code and the html file to also be able to handle the DHT sensor on top of the soil moisture sensor!
And behold.... It didn't work! For some reason all the data was being compounded into one charts it was practically unreadable!
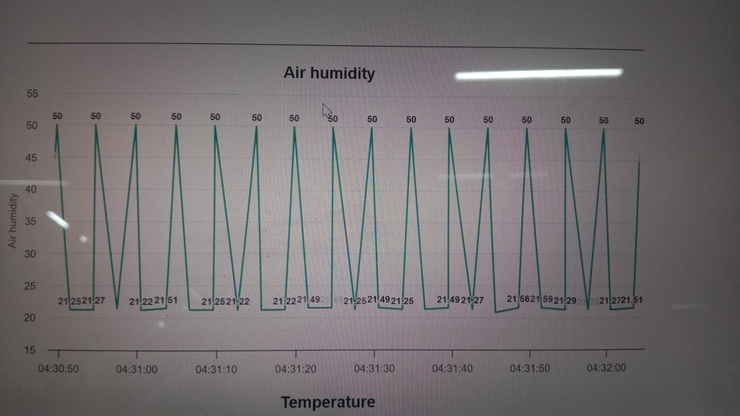
After trying to debug for I while wondered if just changing the colors would work? and who could have guessed, that actually worked!!!
Arduino code
/*********
          Rui Santos
          Complete project details at https://RandomNerdTutorials.com

          Permission is hereby granted, free of charge, to any person obtaining a copy
          of this software and associated documentation files.

          The above copyright notice and this permission notice shall be included in all
          copies or substantial portions of the Software.
        *********/

        // Import required libraries
        #include <WiFi.h>
        #include <ESPAsyncWebServer.h>
        #include <SPIFFS.h>
        #include <DHT.h>

        #define DHT_PIN 2       // Pin connected to the DHT11 data pin
        #define DHT_TYPE DHT11  // DHT sensor type

        DHT dht(DHT_PIN, DHT_TYPE);
        //#include <Adafruit_Sensor.h>

        #define MOISTURE_SENSOR_PIN 3    // Analog pin where the soil moisture sensor is connected
        #define MAX_MOISTURE_VALUE 4095  // Maximum value of the sensor reading for full moisture

        // Replace with your network credentials
        const char* ssid = "DGI";
        const char* password = "LetMePass!";

        // Create AsyncWebServer object on port 80
        AsyncWebServer server(80);

        String SoilMoisture() {
          float S = analogRead(MOISTURE_SENSOR_PIN);
          S = (1 - (S / (float)MAX_MOISTURE_VALUE)) * 100;


          if (isnan(S)) {
            Serial.println("Failed to read from Soil moisture sensor");
            return "";
          } else {
            Serial.println(S);
            return String(S);
          }
        }


        String SoilTempreture() {
          float T = dht.readTemperature();

          if (isnan(T)) {
            Serial.println("Failed to read from Soil moisture sensor");
            return "";
          } else {
            Serial.println(T);
            return String(T);
          }
        }


        String SoilHumidity() {
          float H = dht.readHumidity();

          if (isnan(H)) {
            Serial.println("Failed to read from Soil moisture sensor");
            return "";
          } else {
            Serial.println(H);
            return String(H);
          }
        }

        void setup() {
          // Serial port for debugging purposes
          Serial.begin(115200);

          pinMode(MOISTURE_SENSOR_PIN, INPUT);
          dht.begin();
          pinMode(4, OUTPUT);
          pinMode(10, OUTPUT);

          if (!SPIFFS.begin()) {
            Serial.println("an error has occurred while mounting SPIFFS");
            return;
          }

          // Connect to Wi-Fi
          WiFi.begin(ssid, password);
          while (WiFi.status() != WL_CONNECTED) {
            delay(1000);
            Serial.println("Connecting to WiFi..");
          }

          // Print ESP32 Local IP Address
          Serial.println(WiFi.localIP());

          // Route for root / web page
          server.on("/", HTTP_GET, [](AsyncWebServerRequest* request) {
            request->send(SPIFFS, "/index.html");
          });
          server.on("/soilMoisture", HTTP_GET, [](AsyncWebServerRequest* request) {
            request->send_P(200, "text/plain", SoilMoisture().c_str());
          });
          delay(1000);
          server.on("/SoilTempreture", HTTP_GET, [](AsyncWebServerRequest* request) {
            request->send_P(200, "text/plain", SoilTempreture().c_str());
          });
          delay(1000);
          server.on("/SoilHumidity", HTTP_GET, [](AsyncWebServerRequest* request) {
            request->send_P(200, "text/plain", SoilHumidity().c_str());
          });
          delay(1000);

          // Start server
          server.begin();
        }

        void loop() {
          float Y = analogRead(MOISTURE_SENSOR_PIN);
          Y = (1 - (Y / (float)MAX_MOISTURE_VALUE)) * 100;

          if (Y > 37) {
            digitalWrite(4, HIGH);
            digitalWrite(10, LOW);
          } else {
            digitalWrite(10, HIGH);
            digitalWrite(4, LOW);
          }
        }
Html file
        <!DOCTYPE HTML><html>
        <!-- Rui Santos - Complete project details at https://RandomNerdTutorials.com

        Permission is hereby granted, free of charge, to any person obtaining a copy
        of this software and associated documentation files.
        The above copyright notice and this permission notice shall be included in all
        copies or substantial portions of the Software. -->
        <head>
          <meta name="viewport" content="width=device-width, initial-scale=1">
          <script src="https://code.highcharts.com/highcharts.js"></script>
          <style>
            body {
              min-width: 310px;
                max-width: 800px;
                height: 400px;
              margin: 0 auto;
            }
            h2 {
              font-family: Arial;
              font-size: 2.5rem;
              text-align: center;
            }
          </style>
        </head>
        <body>
          <h2>Farm soil node</h2>
          <div id="chart-moisture" class="container"></div>
          <div id="chart-humidity" class="container"></div>
          <div id="chart-tempreture" class="container"></div>
        </body>
        <script>
        var chartT = new Highcharts.Chart({
          chart:{ renderTo : 'chart-moisture' },
          title: { text: 'Soil Moisture' },
          series: [{
            showInLegend: false,
            data: []
          }],
          plotOptions: {
            line: { animation: false,
              dataLabels: { enabled: true }
            },
            series: { color: '#059e8a' }
          },
          xAxis: { type: 'datetime',
            dateTimeLabelFormats: { second: '%H:%M:%S' }
          },
          yAxis: {
            title: { text: 'Soil Moisture' }
            //title: { text: 'Temperature (Fahrenheit)' }
          },
          credits: { enabled: false }
        });
        setInterval(function ( ) {
          var xhttp = new XMLHttpRequest();
          xhttp.onreadystatechange = function() {
            if (this.readyState == 4 && this.status == 200) {
              var x = (new Date()).getTime(),
                  y = parseFloat(this.responseText);
              //console.log(this.responseText);
              if(chartT.series[0].data.length > 40) {
                chartT.series[0].addPoint([x, y], true, true, true);
              } else {
                chartT.series[0].addPoint([x, y], true, false, true);
              }
            }
          };
          xhttp.open("GET", "/soilMoisture", true);
          xhttp.send();
        }, 5000 ) ;


        var chartH = new Highcharts.Chart({
          chart:{ renderTo:'chart-humidity' },
          title: { text: 'Humidity' },
          series: [{
            showInLegend: false,
            data: []
          }],
          plotOptions: {
            line: { animation: false,
              dataLabels: { enabled: true }
            }
          },
          xAxis: {
            type: 'datetime',
            dateTimeLabelFormats: { second: '%H:%M:%S' }
          },
          yAxis: {
            title: { text: 'Humidity (%)' }
          },
          credits: { enabled: false }
        });
        setInterval(function ( ) {
          var xhttp = new XMLHttpRequest();
          xhttp.onreadystatechange = function() {
            if (this.readyState == 4 && this.status == 200) {
              var x = (new Date()).getTime(),
                  y = parseFloat(this.responseText);
              //console.log(this.responseText);
              if(chartH.series[0].data.length > 40) {
                chartH.series[0].addPoint([x, y], true, true, true);
              } else {
                chartH.series[0].addPoint([x, y], true, false, true);
              }
            }
          };
          xhttp.open("GET", "/SoilHumidity", true);
          xhttp.send();
        }, 5000 ) ;


        var chartP = new Highcharts.Chart({
          chart:{ renderTo:'chart-tempreture' },
          title: { text: 'Temperature' },
          series: [{
            showInLegend: false,
            data: []
          }],
          plotOptions: {
            line: { animation: false,
              dataLabels: { enabled: true }
            },
            series: { color: '#18009c' }
          },
          xAxis: {
            type: 'datetime',
            dateTimeLabelFormats: { second: '%H:%M:%S' }
          },
          yAxis: {
            title: { text: 'Temperature' }
          },
          credits: { enabled: false }
        });
        setInterval(function ( ) {
          var xhttp = new XMLHttpRequest();
          xhttp.onreadystatechange = function() {
            if (this.readyState == 4 && this.status == 200) {
              var x = (new Date()).getTime(),
                  y = parseFloat(this.responseText);
              //console.log(this.responseText);
              if(chartP.series[0].data.length > 40) {
                chartP.series[0].addPoint([x, y], true, true, true);
              } else {
                chartP.series[0].addPoint([x, y], true, false, true);
              }
            }
          };
          xhttp.open("GET", "/SoilTempreture", true);
          xhttp.send();
        }, 5000 ) ;
        </script>
        </html>
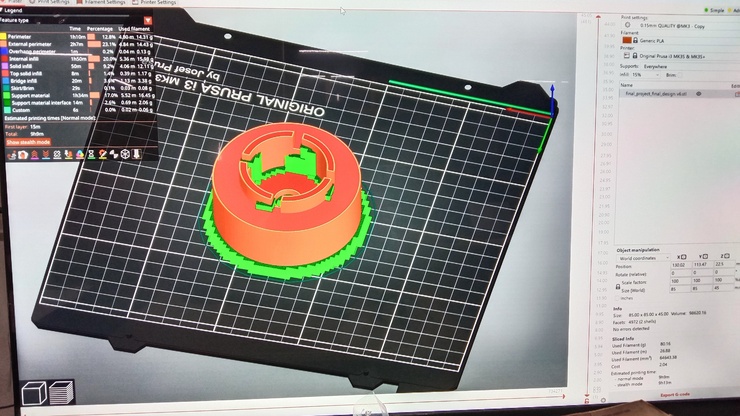
After I used all my sensors, I came to a problem, the humidity sensor gave very accurate measuring, but it needed to be exposed to air to do it. And I also needed to make it water proof, therefore I went to designing right away! I came up with a design that has a hole through which air could pass through, but then I also added a sort of cover over the hole so that no water could pass through
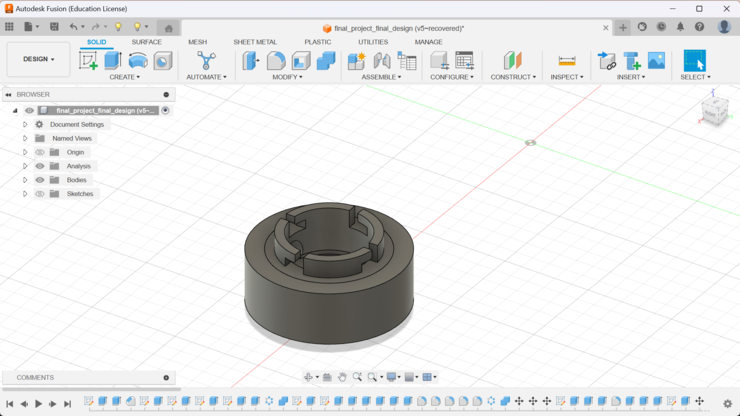
The beauty of the slide lock is that I can just simply add new components on top of them by simply just having them have the same lock and socket!
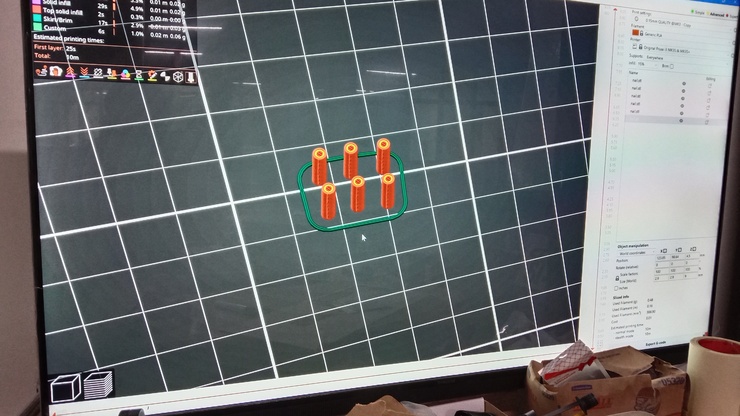
I put this model to the pursa slicer and then this is how it looks!
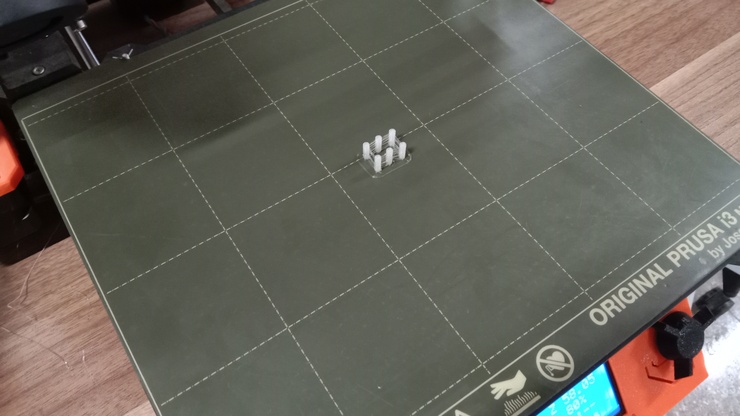
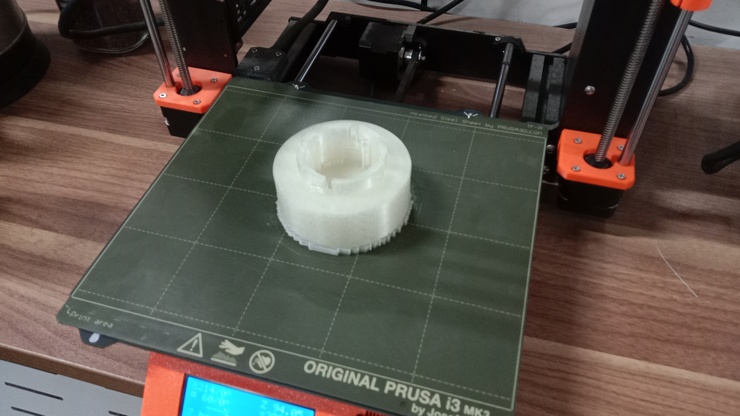
I hooked it up on the printer and then this is how it looks after the printing has been done!
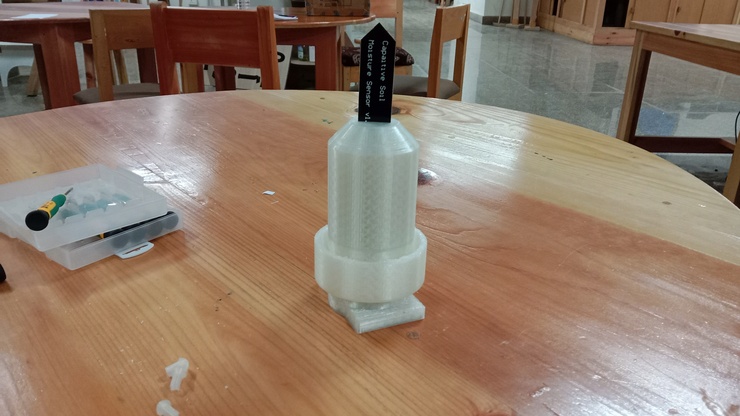
I was also recommended by my fab guru Rico to add LED's inside my project as there weren't many electronics that gave an output. The data output it gives could be considered an output but the fact still remains that there ins't an output device and since it it better being safe then sorry we decided on creating an entirely new board to be able to control a red and blue LED.
The blue LED indicates that the soil moisture is stable and then the red led indicates that more water needs to be added. With this in mind I jumped into Kicad and made another schematic.
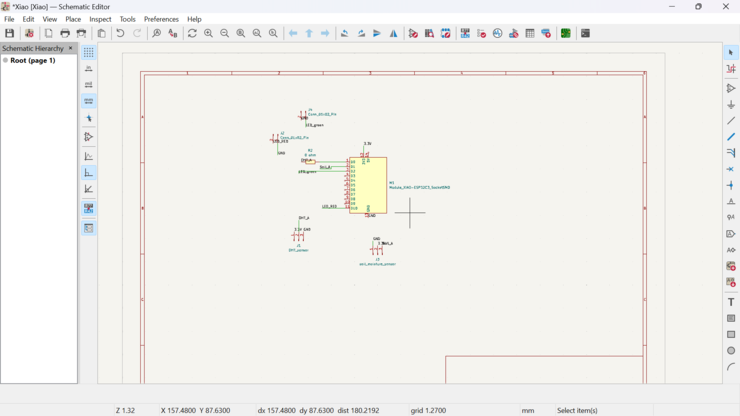
For the PCB editor I simply just added two pin sockets for the LEDs. Also I didn't have to add resistors as the Xiao digital pins give an output of 3.3 volts and then the output current also wasn't very high. Not only that much but since I had to have the LED to be its brightest!
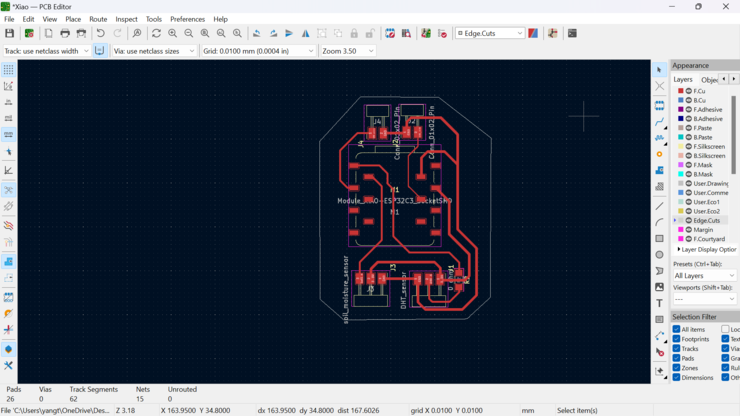
Then I set up my Roland SRM to start with the milling process. I printed my board and then who could have guessed! again on the same spot as before, the machine didn't cut properly!!! And I now also have to perform surgery on the board for it to function.
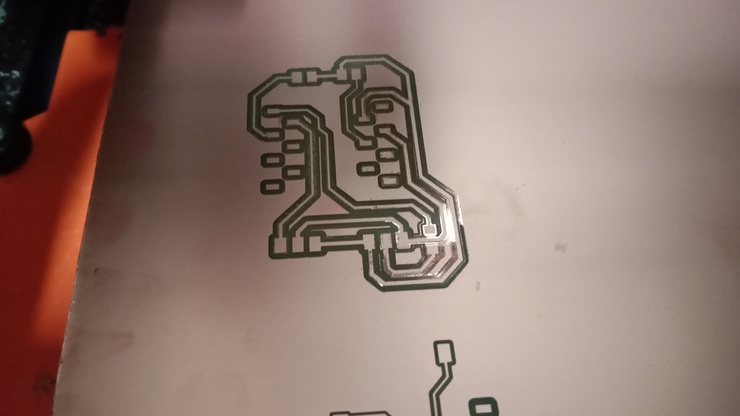
After finishing with the cutting process I specified the spot that required my theoretical surgery.
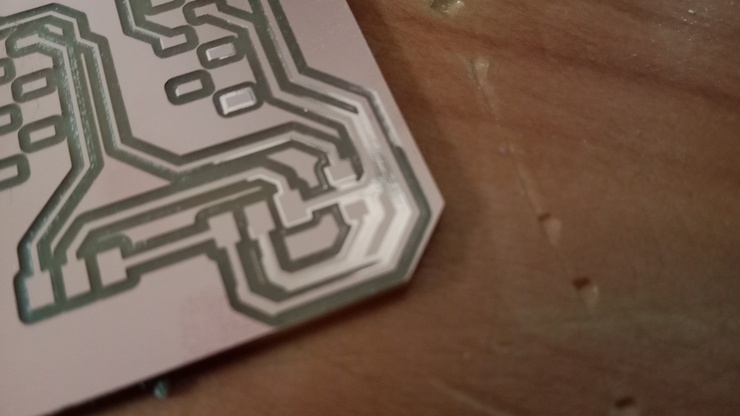
The surgery was quick and easy, also it did some good as it connected my ground to the rest of the board forming a sort of ground reservoir!
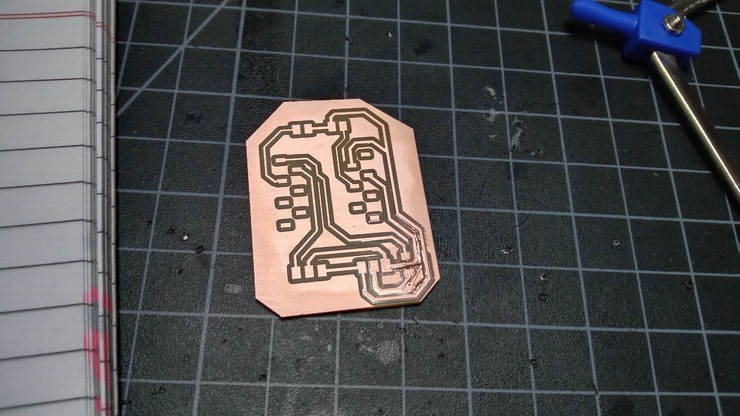
Now I just had to get all the components and then solder them in place!
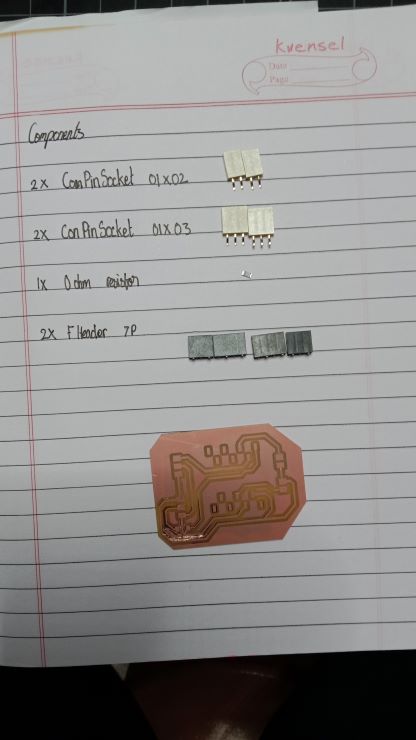
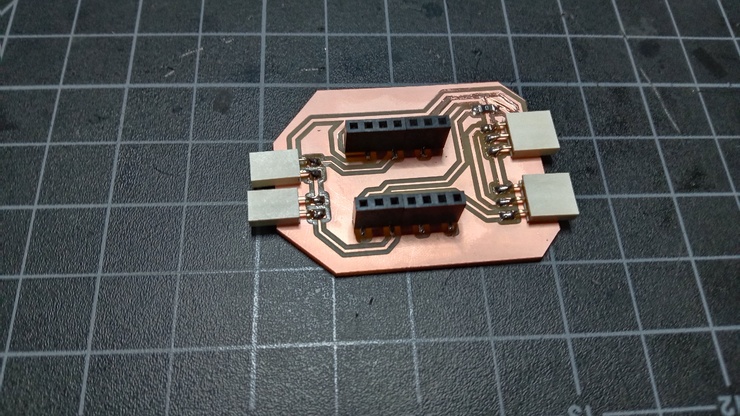
To test whether the code worked or not I just used a simple blink code.
Solar Power!!!
Now this is one of the main components for my final project. If I really want my project to be able to survive being out in the field for extended periods of time. It was recommended to me by fab guru Rico Sir. This was also my very first time handling a solar panel and don't actually know what to do. Firstly I had to test how much current the solar panel was generating.
First test!
For the first attempt I just connected the positive and then the negative poles of the solar panel to the a multimeter to see if the solar panel was able to generate enough current.
The solar panel wasn't able to generate enough current by itself. It was generating at most about 25 amps. I think I need to add something that would be able to increase the amount of current flowing through.
Second test
For the second test I tried using a capacitor so that the capacitor is able to hold up the current then be able to give a steady output current. I used an 1 ferret capacitor and then attached then to the positive and negative points of the solar panel and then connected the two points to wires to see if the solar panel was generating enough current.
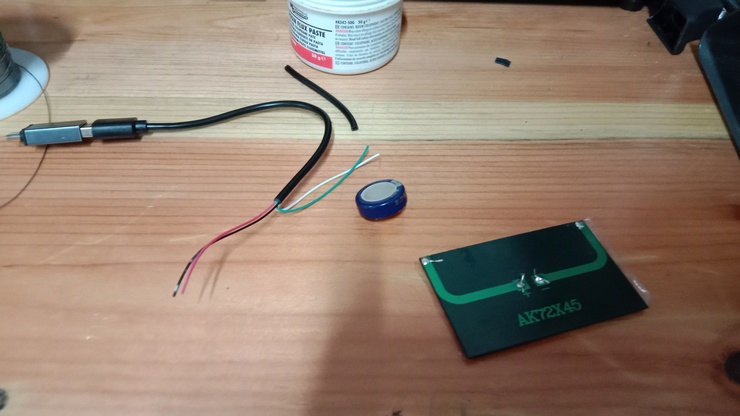
.jpg)
After the test was conducted we could clearly see the amount of current the solar panel was generating was more than enough to be able to be able to charge the battery on the xiao esp32 c3.
Design changes
I had to make some changes so that I would be able to fit all my components and electronics. For that to be possible I had to create a two additional chambers and then also a slight change to the main compartment that would hold the micro controller.
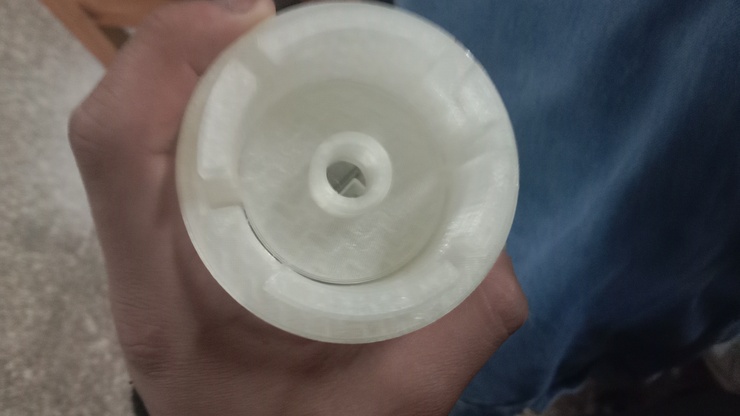
For the chamber that holds my micro controller, I need it so that the soil moisture sensor wont move up and down after being placed on the ground. for that I simply added a inverse twist lock socket inside the chamber. With that I also created a sort of key for me to be able to lock the soil moisture sensor in place.
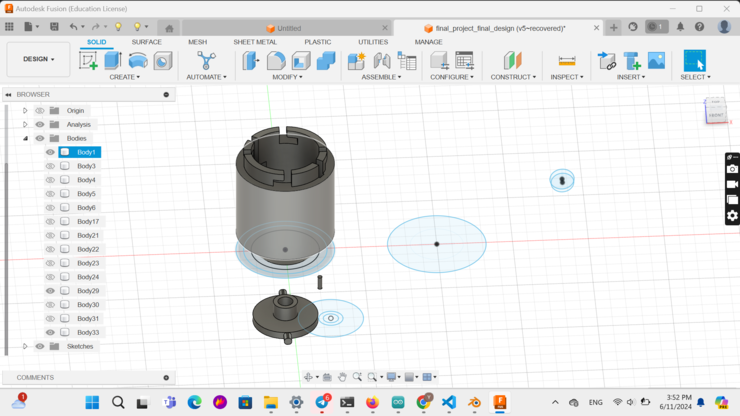
I took the design into the pursa slicer.
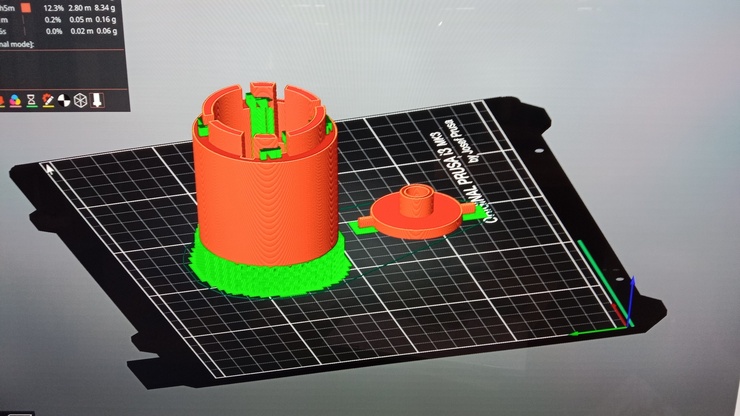
And then printed the design.
After that I moved on to designing the additional chambers for my final project encloser.
For the additional chambers the components had to have a key on one end and then a socket on the other.
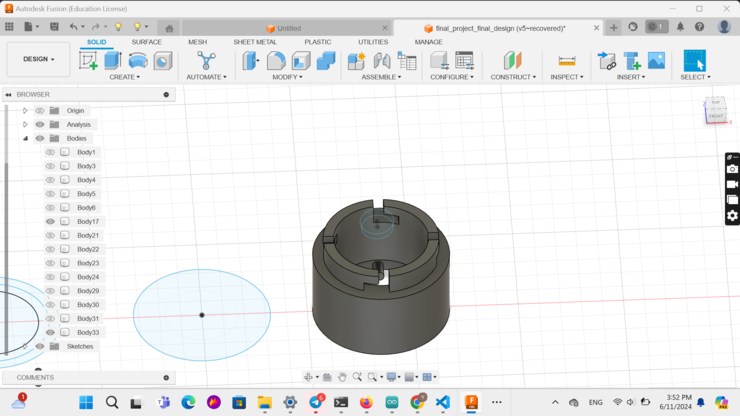
Now with that done the entire design for my final project has been completed. This is how my entire design looks.
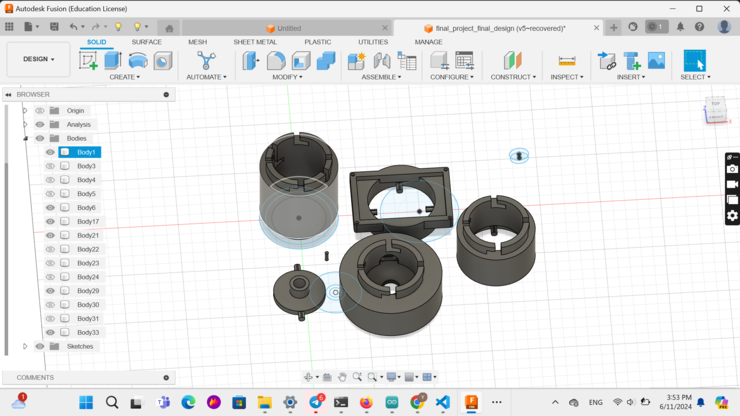
Anyways after I finished designing, I simply had to wait for the printing to be done.
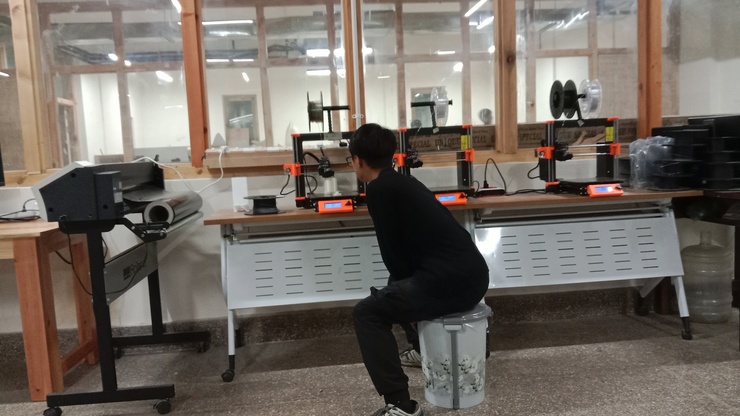
After 3 hours of printing, It was done!!!
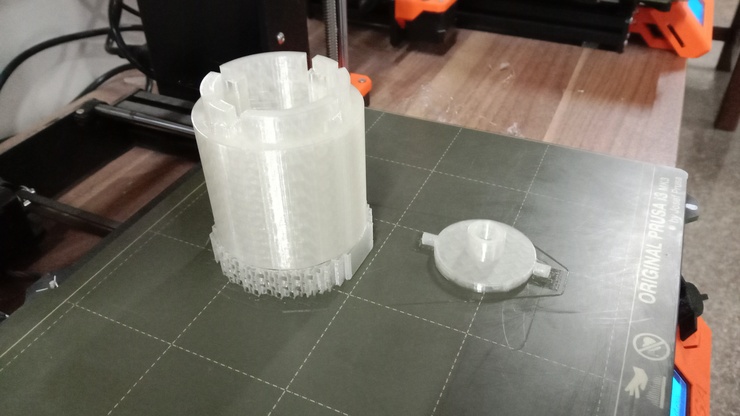
The locking mechanism using the inverted twist lock was perfect!!! It worked perfectly ensuring that the soil moisture sensor not only had its own place but also ensured that the soil moisture sensor wont move up and down.
 .
.
Now lets get to the last bit. I now have to laser cut top for a transparent top and then also I have to have to screw the top with some screws(Problem: No screws would fit the holes I made onto my solar panel holder, therefore I had to 3D print custom screws.)
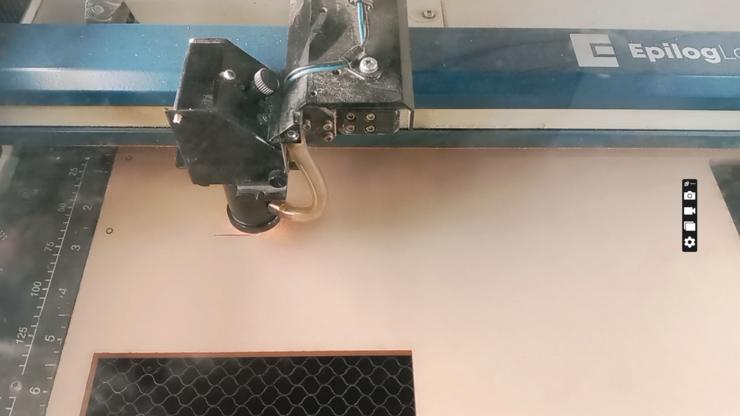
I 3D printed the screws and laser cut the top.
