Interface and Application Programming
I made this assignment in a individual way.
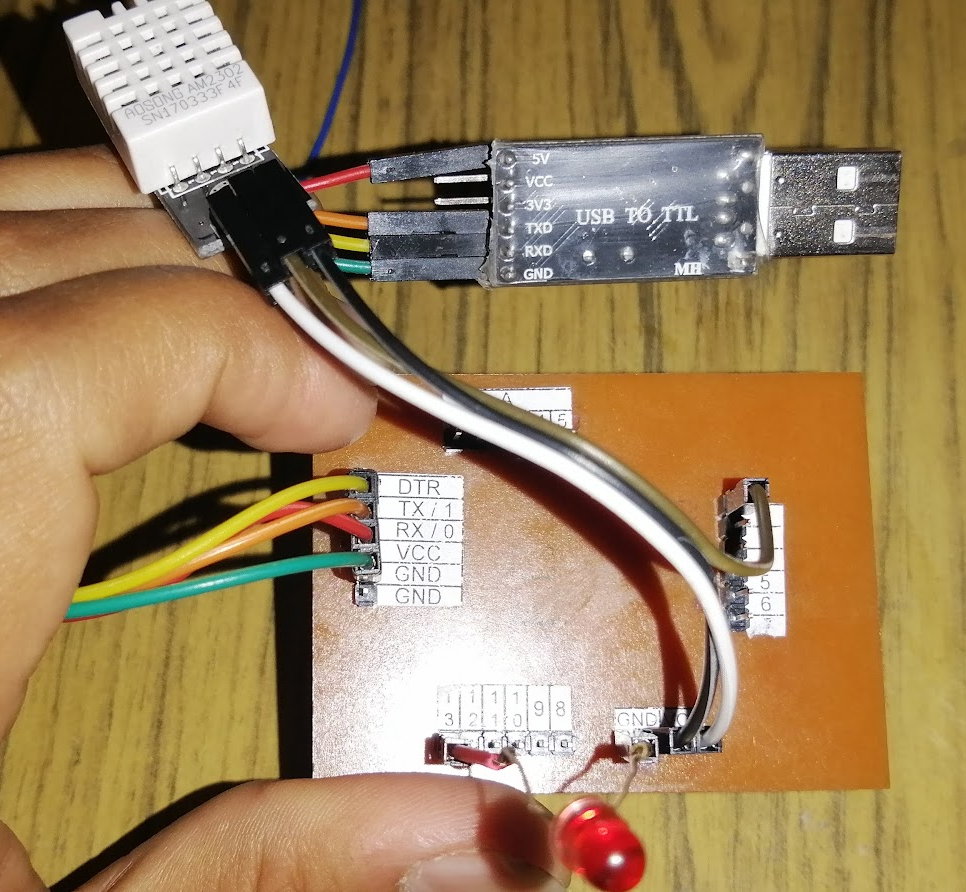
In this assigment I used the Fabduino PCB Board, designed in previous assignments. A graphic interface was created using software PROCESSING, to read sensor DHT22 that is connected to the board to read temperature and humidity. Additionally a graphic button can turn on a led using the mouse.
The connection between Arduino and PC is made using serial protocol at 9600 baud, through USB port.
Processing (from Wikipedia)
Processing is a free graphical library and integrated development environment (IDE) built for the electronic arts, new media art, and visual design communities with the purpose of teaching non-programmers the fundamentals of computer programming in a visual context.
Processing uses the Java language, with additional simplifications such as additional classes and aliased mathematical functions and operations. It also provides a graphical user interface for simplifying the compilation and execution stage.
The Processing language and IDE have been the precursor to other projects including Arduino, Wiring and Processing.js.
There are other programs for interfacing a microcontroller:
LABVIEW: (from Wikipedia)
![]()
Laboratory Virtual Instrument Engineering Workbench (LabVIEW) is a system-design platform and development environment for a visual programming language from National Instruments.
The graphical language is named "G"; not to be confused with G-code. The G dataflow language was originally developed by LabVIEW. LabVIEW is commonly used for data acquisition, instrument control, and industrial automation on a variety of operating systems (OSs), including macOS and other versions of Unix and Linux, as well as Microsoft Windows.
Dataflow programming
The programming paradigm used in LabVIEW, sometimes called G, is based on data availability. If there is enough data available to a subVI or function, that subVI or function will execute. The execution flow is determined by the structure of a graphical block diagram (the LabVIEW-source code) on which the programmer connects different function-nodes by drawing wires. These wires propagate variables and any node can execute as soon as all its input data become available. Since this might be the case for multiple nodes simultaneously, LabVIEW can execute inherently in parallel. Multi-processing and multi-threading hardware is exploited automatically by the built-in scheduler, which multiplexes multiple OS threads over the nodes ready for execution.
Graphical programming
LabVIEW integrates the creation of user interfaces (termed front panels) into the development cycle. LabVIEW programs-subroutines are termed virtual instruments (VIs). Each VI has three components: a block diagram, a front panel, and a connector pane. The last is used to represent the VI in the block diagrams of others, calling VIs. The front panel is built using controls and indicators. Controls are inputs: they allow a user to supply information to the VI. Indicators are outputs: they indicate, or display, the results based on the inputs given to the VI. The back panel, which is a block diagram, contains the graphical source code. All of the objects placed on the front panel will appear on the back panel as terminals. The back panel also contains structures and functions which perform operations on controls and supply data to indicators. The structures and functions are found on the Functions palette and can be placed on the back panel. Collectively controls, indicators, structures, and functions are referred to as nodes. Nodes are connected using wires, e.g., two controls and an indicator can be wired to the addition function so that the indicator displays the sum of the two controls. Thus a virtual instrument can be run as either a program, with the front panel serving as a user interface, or, when dropped as a node onto the block diagram, the front panel defines the inputs and outputs for the node through the connector pane. This implies each VI can be easily tested before being embedded as a subroutine into a larger program.

Main view
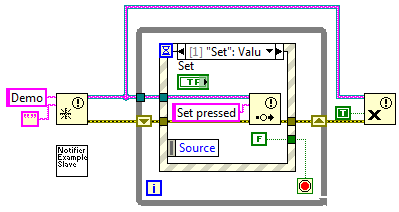
Block diagram view
MATLAB (from Wikipedia)

MATLAB (an abbreviation of "MATrix LABoratory") is a proprietary multi-paradigm programming language and numeric computing environment developed by MathWorks. MATLAB allows matrix manipulations, plotting of functions and data, implementation of algorithms, creation of user interfaces, and interfacing with programs written in other languages.
Although MATLAB is intended primarily for numeric computing, an optional toolbox uses the MuPAD symbolic engine allowing access to symbolic computing abilities. An additional package, Simulink, adds graphical multi-domain simulation and model-based design for dynamic and embedded systems.
Simulink is for Model-Based Design:
From Concept to Operation
- To transform development of complex systems, market-leading companies adopt Model-Based Design by systematically using models throughout the entire process.
- Use a virtual model to simulate and test your system early and often
- Validate your design with physical models, Hardware-in-the-Loop testing, and rapid prototyping
- Generate production-quality C, C++, CUDA, PLC, Verilog, and VHDL code and deploy directly to your embedded system
- Maintain a digital thread with traceability through requirements, system architecture, component design, code and tests
- Extend models to systems in operation to perform predictive maintenance and fault analysis

Parts required in this assignment
01 Fabduino PCB Board
01 DHT22 sensor
01 5mm Red led
01 USB to TTL serial interface
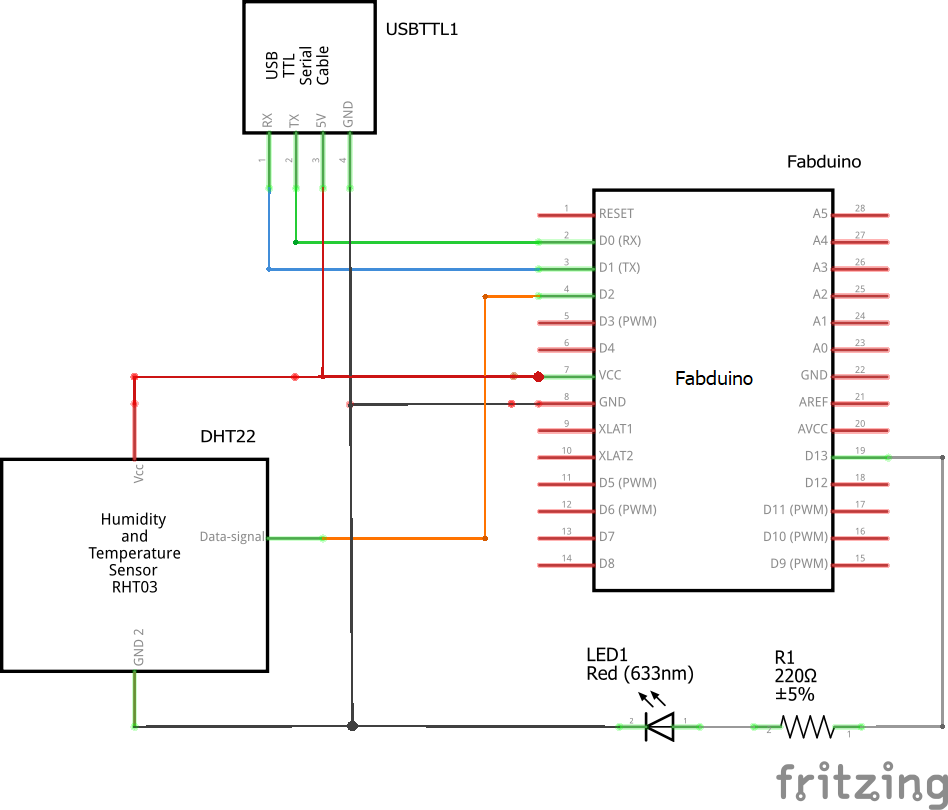
Schematic Circuit
I used the DHT22 sensor and a 5mm red LED. Fabduino Board needs the USB to TTL Serial interface to transmit the data to a computer, via serial protocol at 9600 bps.
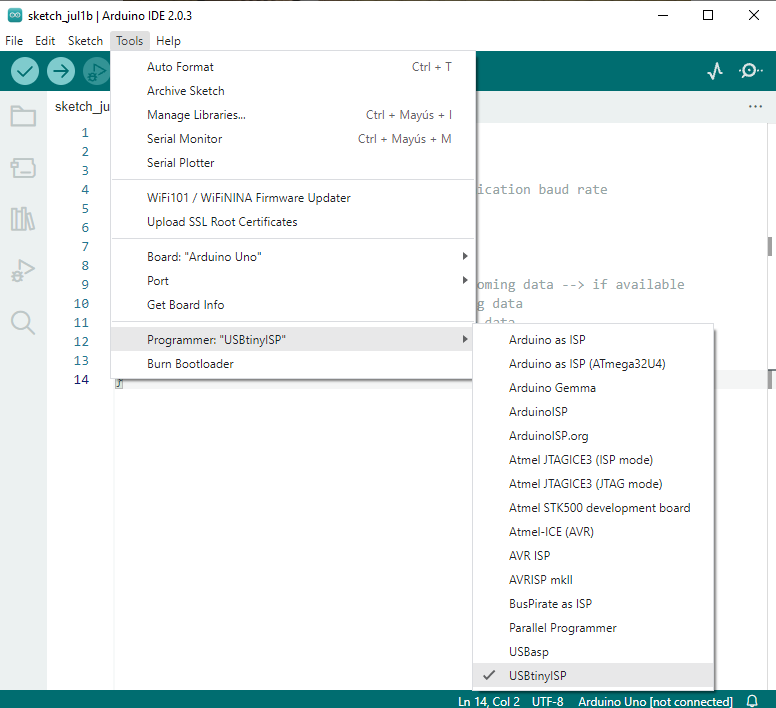
Programming PCB Boards
In the programming IDE we must select the board Arduino UNO and USBTinySIP for programming.
Code / Firmware
//I made a modification of this code
//https://github.com/winlinvip/SimpleDHT/blob/master/examples/DHT22Default/DHT22Default.ino
#include <Wire.h> //Including wire library
#include <SimpleDHT.h> //DHT22sensor libraryint pinDHT22 = 2;
int led=13;boolean status=LOW; //Estado del led
SimpleDHT22 dht22;#define ALTITUDE 700 //Altitude where I live (change this to your altitude)
void setup() {
Serial.begin(9600); //Starting serial communication
pinMode(led,OUTPUT);}
void loop() {
char status;
double T, P, p0; //Creating variables for temp, pressure and relative pressurefloat temperature = 0;
float humidity = 0;
int err = SimpleDHTErrSuccess;
if ((err = dht22.read2(pinDHT22, &temperature, &humidity, NULL)) != SimpleDHTErrSuccess) {
Serial.print("Read DHT22 failed, err="); Serial.println(err);delay(2000);
return;
}Serial.print((float)temperature);
Serial.print(",");
Serial.print((float)humidity);
Serial.print(",");
delay(2000);if(Serial.available()>0) {
byte dato = Serial.read(); //Los almacena en la variable "dato"
if(dato==65) //Si recibe una "A" (en ASCII "65") cada vez cambia led
{
status=!status; //Cambia el estatus del led
}
digitalWrite(led,status);
}
}

Connect the USB Cable to programming the board.
The connection is shown below:
Code in Processing software
Type the serial COM port used to communicate correctly. In this case COM7.
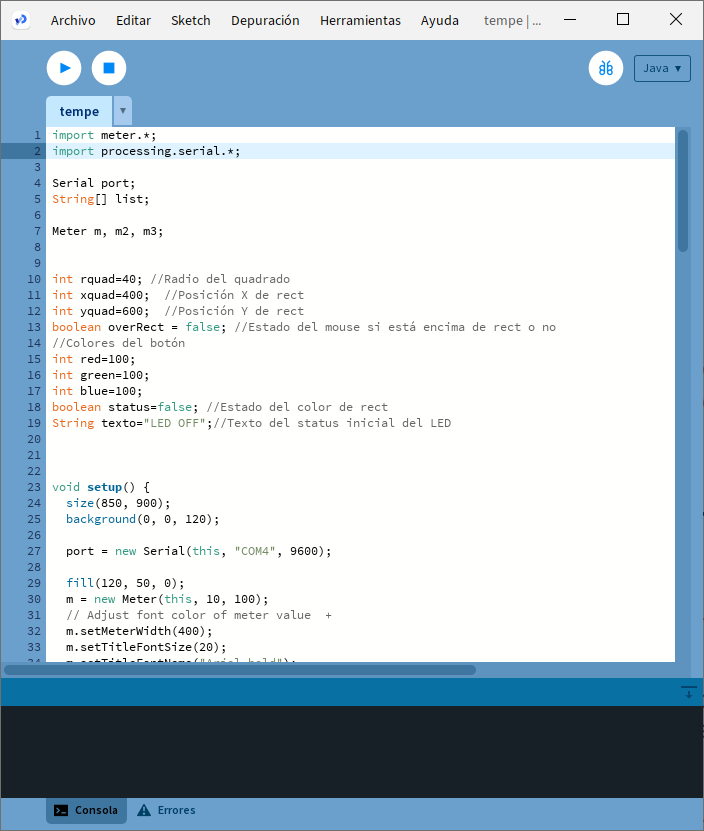
Processing Code
I modified this code located in
import meter.*;
import processing.serial.*;
Serial port;
String[] list;
Meter m, m2, m3;
int rquad=40; //Radio del quadrado
int xquad=400; //Posición X de rect
int yquad=460; //Posición Y de rect
boolean overRect = false; //Estado del mouse si está encima de rect o no
//Colores del botón
int red=100;
int green=100;
int blue=100;
boolean status=true; //Estado del color de rect
String texto="LED OFF";//Texto del status inicial del LED
void setup() {
size(850, 600);
background(0, 0, 120);
port = new Serial(this, "COM7", 9600);
fill(120, 50, 0);
m = new Meter(this, 10, 100);
// Adjust font color of meter value +
m.setMeterWidth(400);
m.setTitleFontSize(20);
m.setTitleFontName("Arial bold");
m.setTitle("Temperature (C)");
m.setDisplayDigitalMeterValue(true);
// Meter Scale
String[] scaleLabelsT = {"0", "10", "20", "30", "40", "50", "60", "70", "80"};
m.setScaleLabels(scaleLabelsT);
m.setScaleFontSize(18);
m.setScaleFontName("Times New Roman bold");
m.setScaleFontColor(color(200, 30, 70));
m.setArcColor(color(141, 113, 178));
m.setArcThickness(10);
m.setMaxScaleValue(80);
m.setNeedleThickness(3);
m.setMinInputSignal(0);
m.setMaxInputSignal(80);
// A second meter for reference
int mx = m.getMeterX();
int my = m.getMeterY();
int mw = m.getMeterWidth();
m2 = new Meter(this, mx + mw + 20, my);
m2.setMeterWidth(400);
m2.setTitleFontSize(20);
m2.setTitleFontName("Arial bold");
m2.setTitle("Humidity (%)");
m2.setDisplayDigitalMeterValue(true);
String[] scaleLabelsH = {"0", "10", "20", "30", "40", "50", "60", "70", "80", "90", "100"};
m2.setScaleLabels(scaleLabelsH);
m2.setScaleFontSize(18);
m2.setScaleFontName("Times New Roman bold");
m2.setScaleFontColor(color(200, 30, 70));
m2.setArcColor(color(141, 113, 178));
m2.setArcThickness(10);
m2.setMaxScaleValue(100);
m2.setNeedleThickness(3);
m2.setMinInputSignal(0);
m2.setMaxInputSignal(100);
// A third meter for reference
int m2x = m2.getMeterX();
int m2y = m2.getMeterY();
int m2w = m2.getMeterWidth();
}
public void draw() {
textSize(36);
fill(0, 255, 0);
text("Sensor de temperatura y humedad", 150, 400);
if (port.available() > 0) {
String val = port.readString();
list = split(val, ',');
float temp = float(list[0]);
float hum = float(list[1]);
// float press = float(list[2]);
println("Temperature: " + temp + " C " + "Humidity: " + hum + " %");
m.updateMeter(int(temp));
m2.updateMeter(int(hum));
}
//Dibujamos un rectangulo de color gris
fill(red,green,blue);
rectMode(RADIUS); //Esta función hace que Width y Height de rect sea el radio (distancia desde el centro hasta un costado).
rect(xquad,yquad,rquad,rquad);
}
void mousePressed() { //Cuando el mouse está apretado
if (overRect==true) { //Si el mouse está dentro de rect
status=!status; //El estado del color cambia
port.write("A"); //Envia una "A" para que el Arduino encienda el led
//if(status==true) {
//Color del botón rojo
//red=255;
//green=0;
//blue=0;
//texto="LED ON";
}
//if(status==false) {
//Color del botón negro
//red=100;
//green=100;
//blue=100;
//texto="LED OFF";
//}
//}
}
After compiling next visual interface is shown.

Left pane shows the temperature in degrees and the right pane the humidity value in percentage.
The gray button turn on/off a led using the mouse left click,
How it works?
The controller board senses temperature and humidity values sent through the USB serial interface. These values are shown on the Processing graphic screen. When the mouse is placed over the gray button, it sends the character A to the board, lighting the LED.